August 13, 2026
Comparison of Long-Run Rates of Return for Crop and Livestock Farms
by Michael Langemeier


A structural shift in global grain markets that started in 2007 had major impacts on both crop and livestock prices as well as enterprise net returns. Did this structural shift result in differing rates of return for crop and livestock farms? This article uses aggregate commodity price indices for crop and livestock enterprises, and rates of return for beef, dairy, diversified, and crop farms derived from the FINBIN database to address this question.
Comparison of Commodity Prices
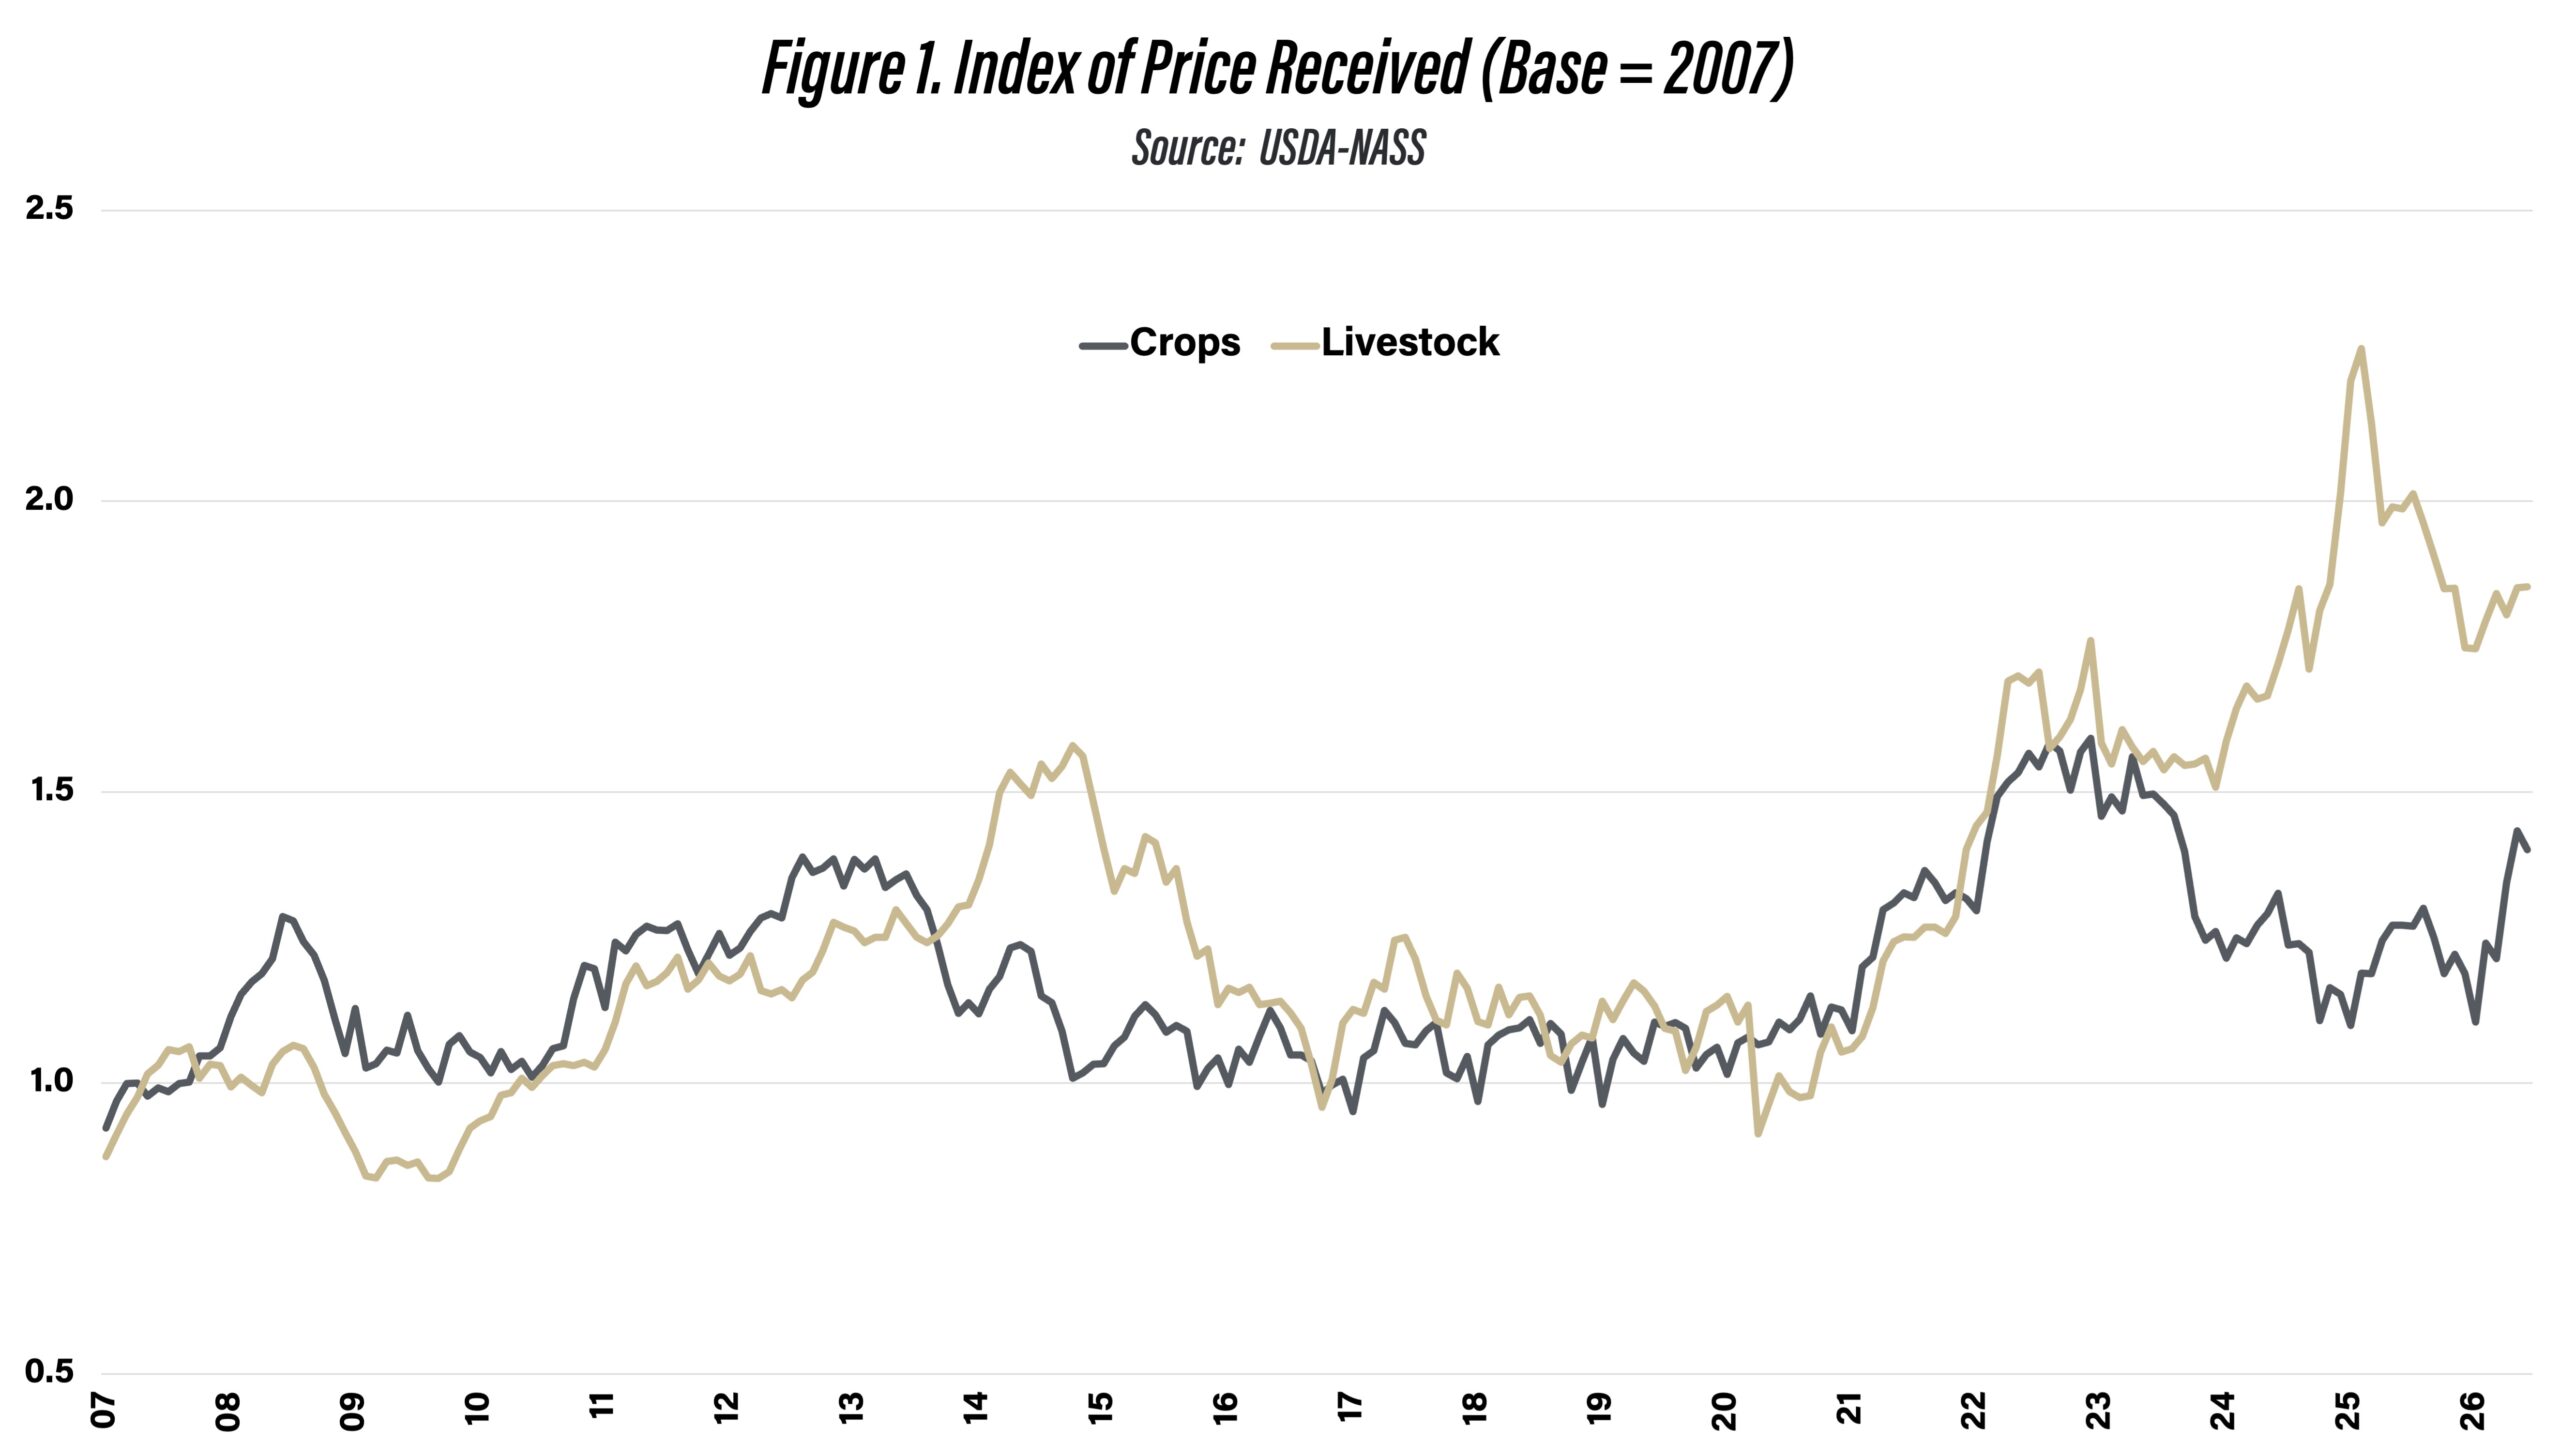
Figure 1. Index of Price Received (Base = 2007)
Source: USDA-NASS
Figure 1 illustrates the index of price received for all crop enterprises and all livestock enterprises using USDA-NASS data. 2007 was chosen as the base period and thus has an index of 1.00. The two aggregate commodity price indices diverged from 2008 to 2010, from 2014 to 2016, and from 2023 to the current month. The livestock index was below the crop index from 2008 to 2010, and above the crop index from 2014 to 2016 and from 2023 to the current month. The divergence between the two aggregate price indices has been particularly large recently. The livestock index was 43% higher in 2024 and 63% higher in 2025 than the crop index. Moreover, for the first six months of 2026, the livestock index was 41% higher than the crop index.
Comparison of Rates of Return
As discussed in Langemeier (2025), there are three major changes that contribute to an increase or decrease in net worth: change in retained earnings, change in contributed capital, and change in market valuation. The change in retained earnings measures the amount of net income in a particular year that is kept in the business. The change in capital contributions accounts for gifts, debts forgiven, and capital contributions and distributions. The change in market valuation subtracts the change in deferred liabilities from the change in the market value of capital assets. Deferred liabilities represent an amount that is owed if an asset is sold.
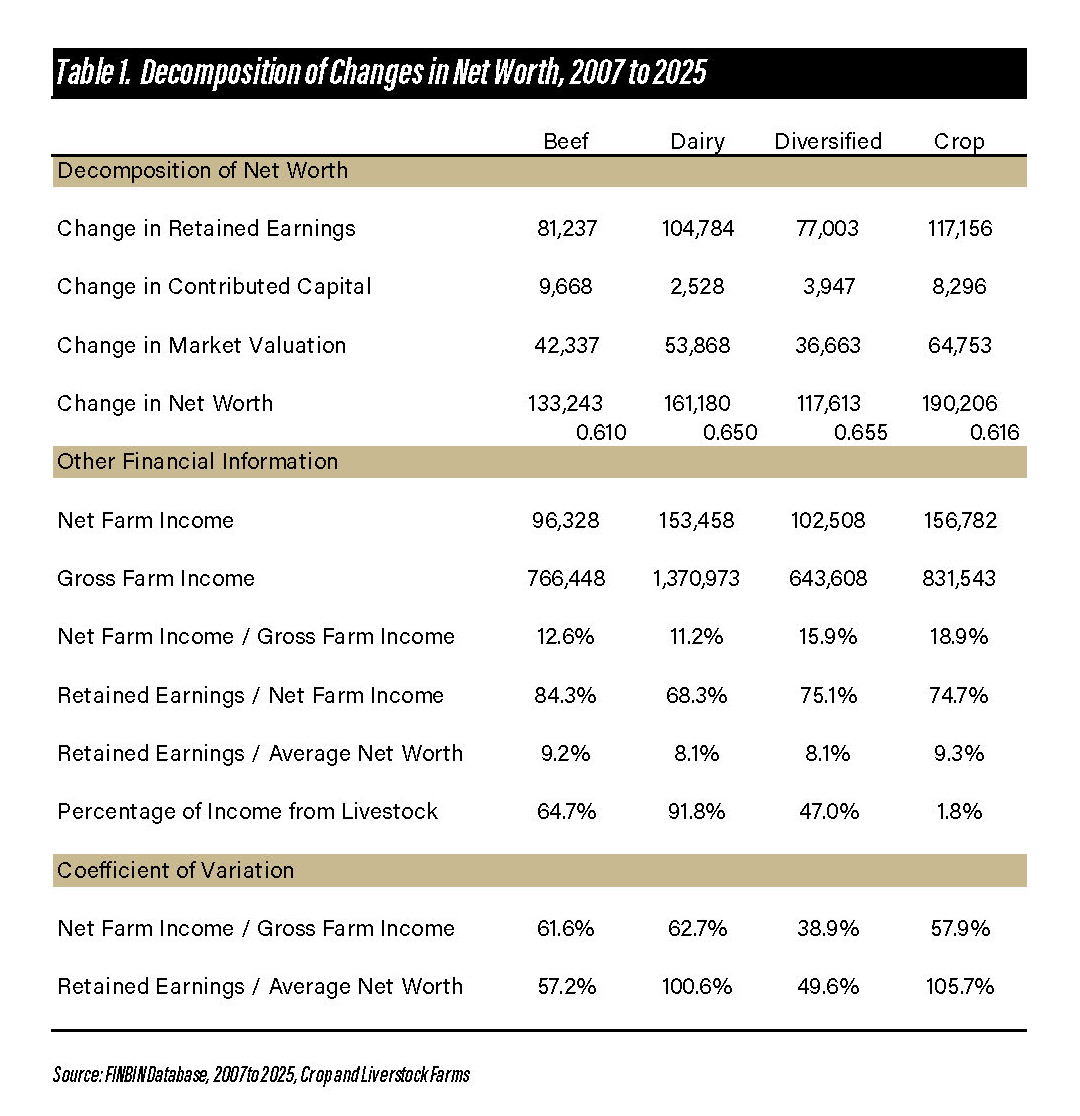
Table 1. Decomposition of Changes in Net Worth, 2007 to 2025
Table 1 contains the average for the change in net worth and its component for beef, dairy, diversified, and crop farms included the FINBIN database. When comparing farm types, it is useful to briefly discuss the major sources of cash farm income for each farm type. The five largest sources of cash farm income (in descending order) for the beef farms were beef finishing, corn, soybeans, beef backgrounding, and beef calves. The five largest sources of cash farm income for the dairy farms were milk, cull breeding stock, corn, dairy calves, and soybeans. For the diversified farms, the five largest sources of cash farm income were corn, custom work income, dairy finishing, contract livestock income, and soybeans. Finally, for crop farms, the five largest sources of cash farm income were corn, soybeans, spring wheat, sugar beets, and custom work income. The retained earnings computation in Table 1 included both net farm income and personal income. Depending on farm type, from 61% to 66% of the change in net worth can be attributed to retained earnings.
In addition to changes in net worth, Table 1 contains summary statistics for net farm income, gross farm income, net farm income as a percentage of gross income (i.e., the net farm income ratio), retained earnings as a percentage of net farm income and net worth, and percentage of income from livestock. Using gross farm income as a measure of farm size, on average, the diversified farms were the smallest farm type, and the dairy farms were the largest. The net farm income ratio measures farm efficiency. The diversified farms and the crop farms had relatively higher net farm income ratios compared to the beef and dairy farms. The dairy farms retained the smallest amount of net farm income while the beef farms retained the highest proportion of net farm income. Rates of return (i.e., retained earnings as a proportion of net worth) ranged from 8.1% to 9.3%, a relatively small range.
The coefficient of variation (standard deviation divided by the average) is a measure of relative variability. Coefficients of variation were computed for the net farm income ratio and the rate of return. Relative variability of the net farm income ratio for the diversified farms was substantially lower than that for the other three farm types. Rates of returns for the diversified farms and the beef farms were less variable than rates of return for dairy farms and crop farms. Using percentage of income from livestock to gauge specialization, the diversified farms and the beef farms were less specialized than dairy and crop farms. Typically, increasing diversification (i.e., reducing specialization) mitigates risk.
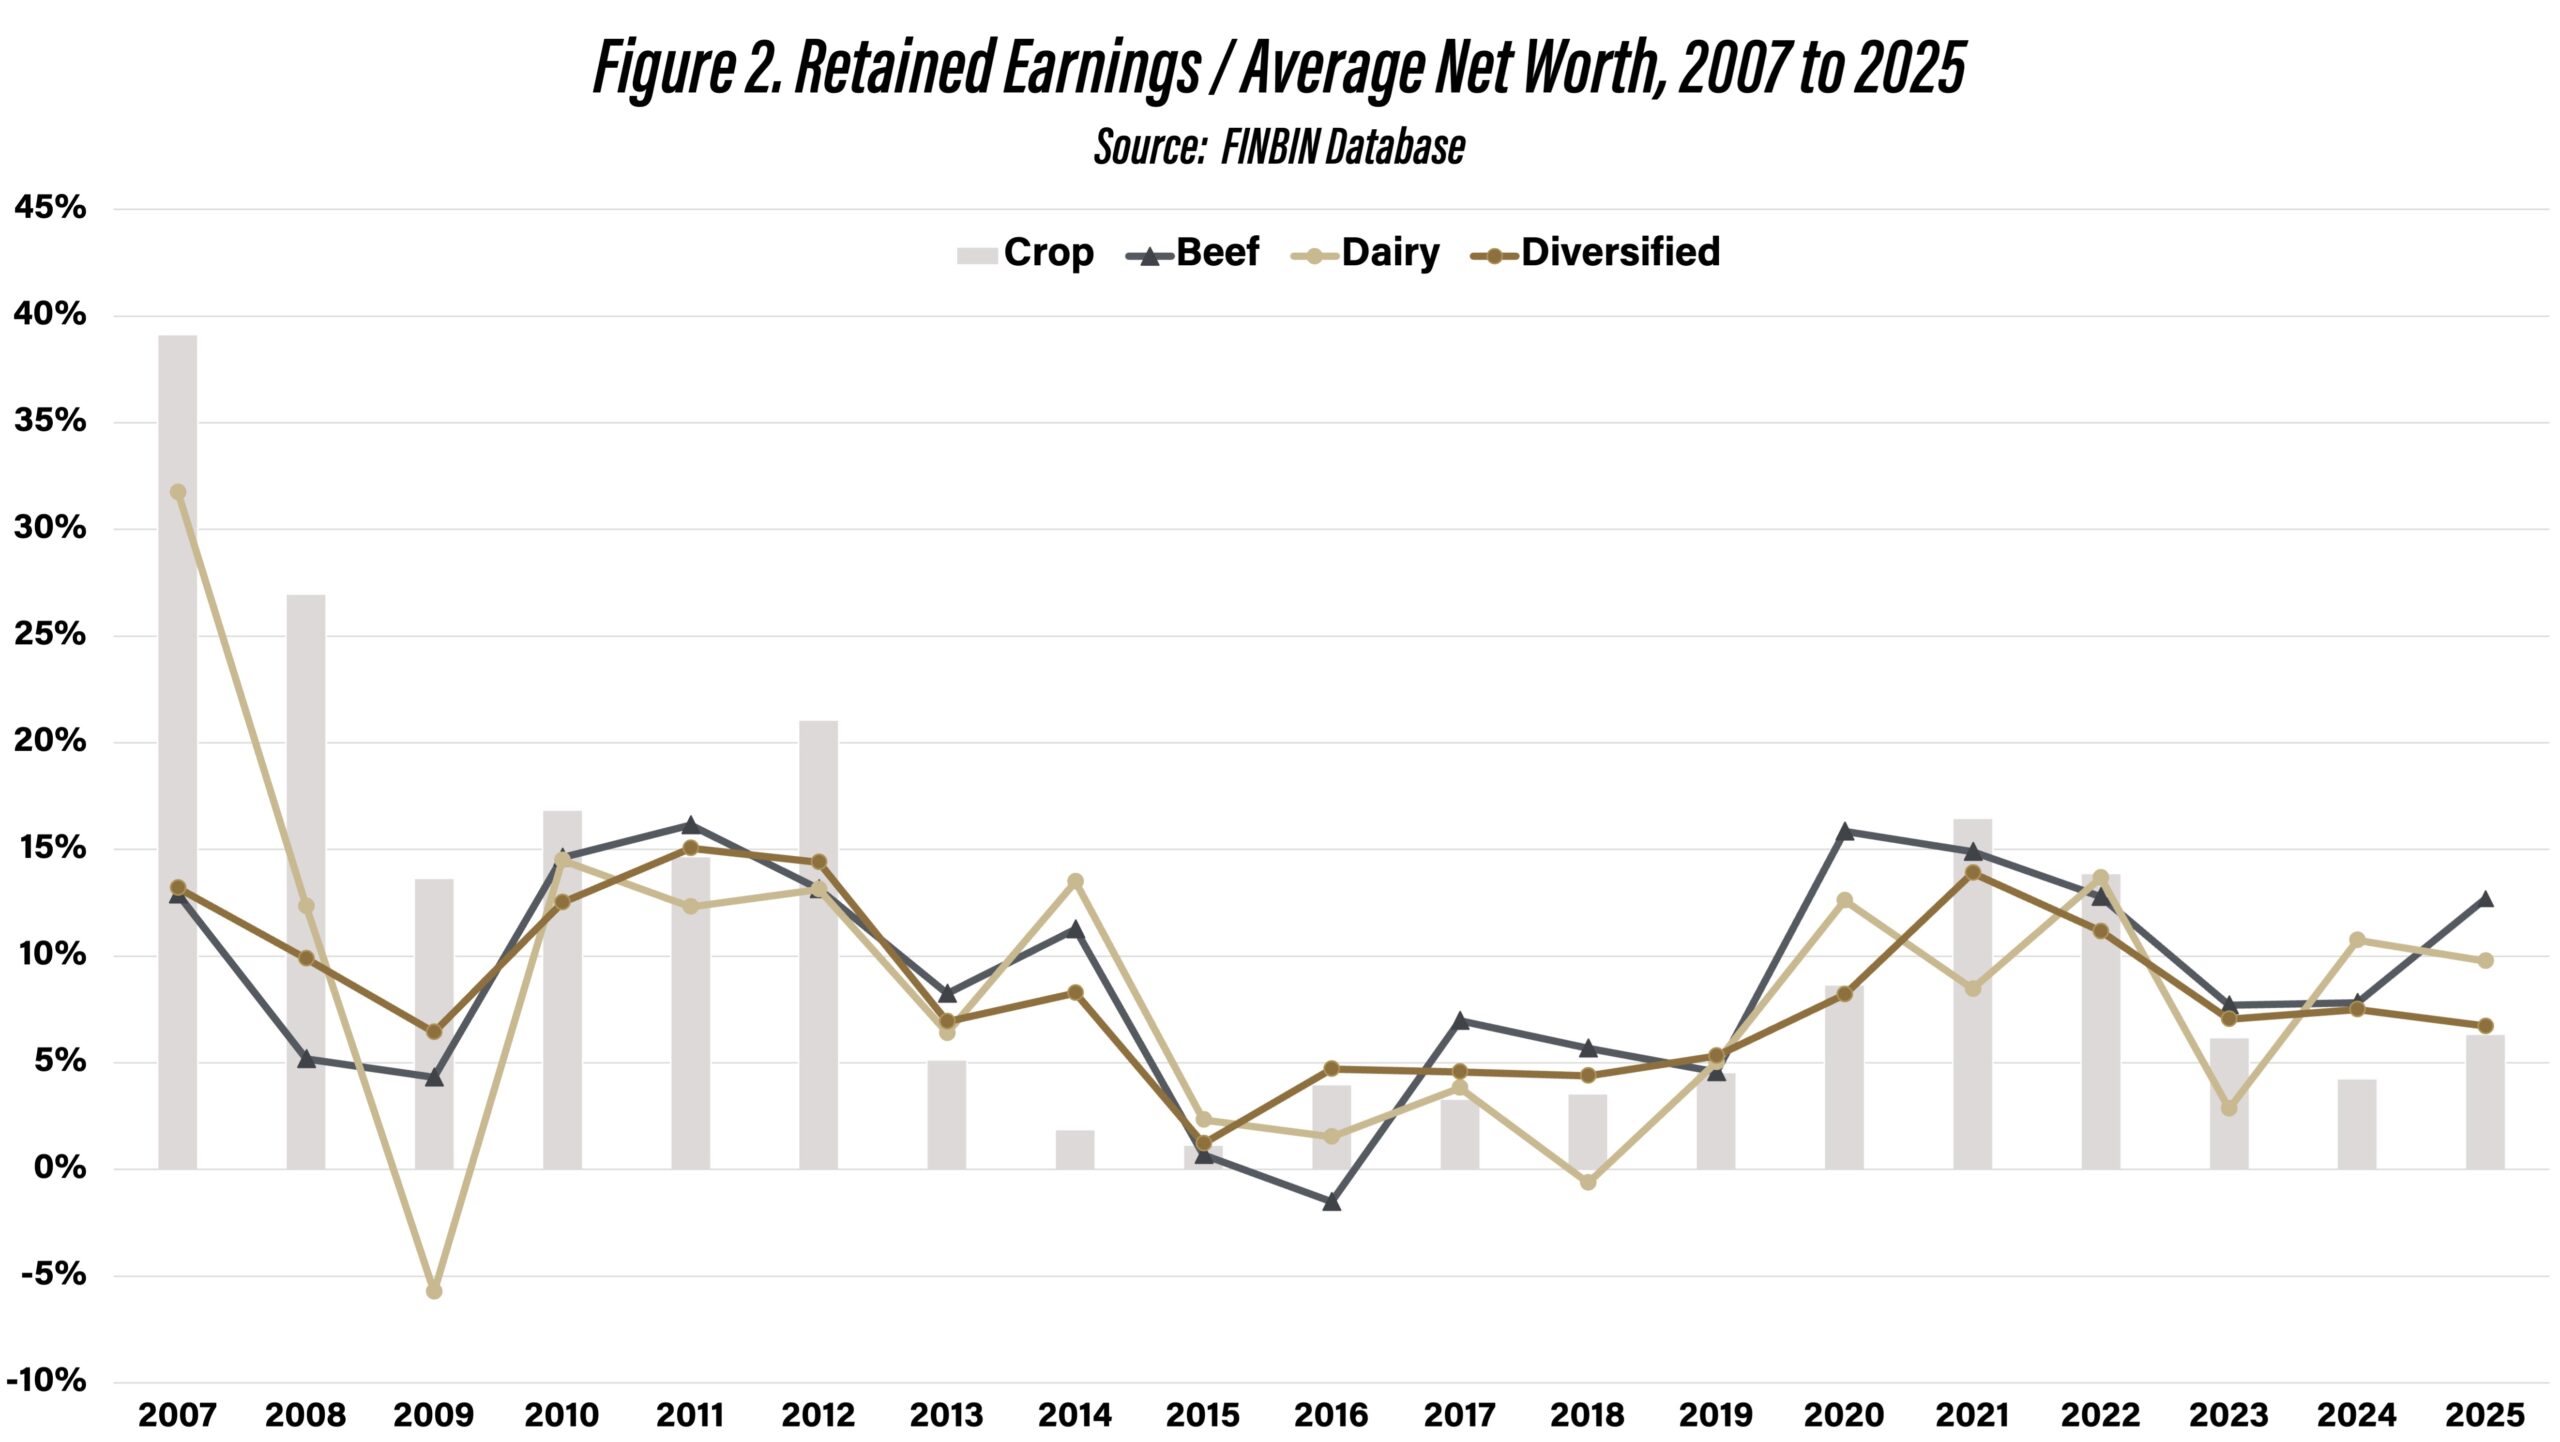
Figure 2. Retained Earnings / Average Net Worth, 2007 to 2025
Source: FINBIN Database
Figure 2 illustrates retained earnings as a percentage of average net worth for all four farm types. Even though rates of return for diversified and beef farms were less variable, there is quite a bit of variability for all four farm types. The rate of return for dairy was negative in 2009 and 2018 while the rate of return was negative for beef farms was negative in 2016. The rate of return was over 20% for dairy farms in 2007 and crop farms in 2007, 2008, and 2012. Financial performance for crop farms was relatively stronger than livestock farms from 2007 to 2012, and relatively weaker in the last three years.
Concluding Comments
Average rates of return for beef, dairy, diversified, and crop farms ranged from 8.1% to 9.3% from 2007 to 2025. Variability in rates of return were lower for the beef and the diversified farms. Financial efficiency, measured using the net farm income ratio, was relatively higher for the diversified and crop farms.
In summary, rates of return since 2007 have been relatively strong for both crop and livestock farms. Moreover, the structural shift in global grain markets did not seem to adversely impact one type of farm (e.g., crop farm) over another type of farm (e.g., livestock farm).
Citations
Center for Farm Financial Management, University of Minnesota, FINBIN web site, accessed July 6, 2026.
Langemeier, M. “Decomposition of Changes in Net Worth.” Center for Commercial Agriculture, Purdue University, May 21, 2025.
TAGS:
TEAM LINKS:

RELATED RESOURCES
UPCOMING EVENTS
Join educators from across the Midwest to build skills for communicating soil health concepts on Nov. 4-5, 2026. In the field, we’ll evaluate the relationship between soil health and water management focusing on irrigation and edge of field practices. The in-service will have both classroom and on farm demonstrations.
The Land of Opportunity: A Conference for Farmland Owners will be held at two locations on October 5 and October 6, providing farmland owners with valuable information and resources to help them make informed decisions about their land. The conference will feature keynote presentations, educational breakout sessions, and networking opportunities designed specifically for those who own, manage, or have an interest in farmland.