November 20, 2026
Post-Harvest Basis Increases Have Shifted Regional Strength
by Josh Strine


Over the past two months, corn and soybean basis has been volatile across the Eastern Corn Belt. Basis weakened through October in many parts of the region as farmers wrapped up harvest and local supply increased. However, the trend reversed in the first three weeks of November as the seasonal post-harvest increase began. Since September, inconsistent patterns have reshaped local basis strength for both corn and soybeans. Indiana continues to lead corn basis, while soybean basis has strengthened in many parts of Illinois due to sharp increases. With no October update, this report covers basis movement from the fourth week of September through the third week of November.
Corn Basis Trends
In September, we expected corn basis to weaken through at least the first half of October as harvest pace accelerated after a slow start in several states. This expectation held in parts of Indiana, Michigan, and Ohio. For example, West-Central Indiana corn basis to December futures fell by $0.09/bu in the first two weeks of October (Figure 1). In some districts, basis continued to decline through the rest of October, including South-Central Michigan, where it fell to -$0.53/bu in the last week of October. However, basis did not decline across the entire region. Iowa corn basis remained largely stable throughout October, with the state average changing by only $0.02/bu, while Illinois basis rose in all nine districts, led by a $0.47/bu gain in Southwest Illinois (Figure 2).
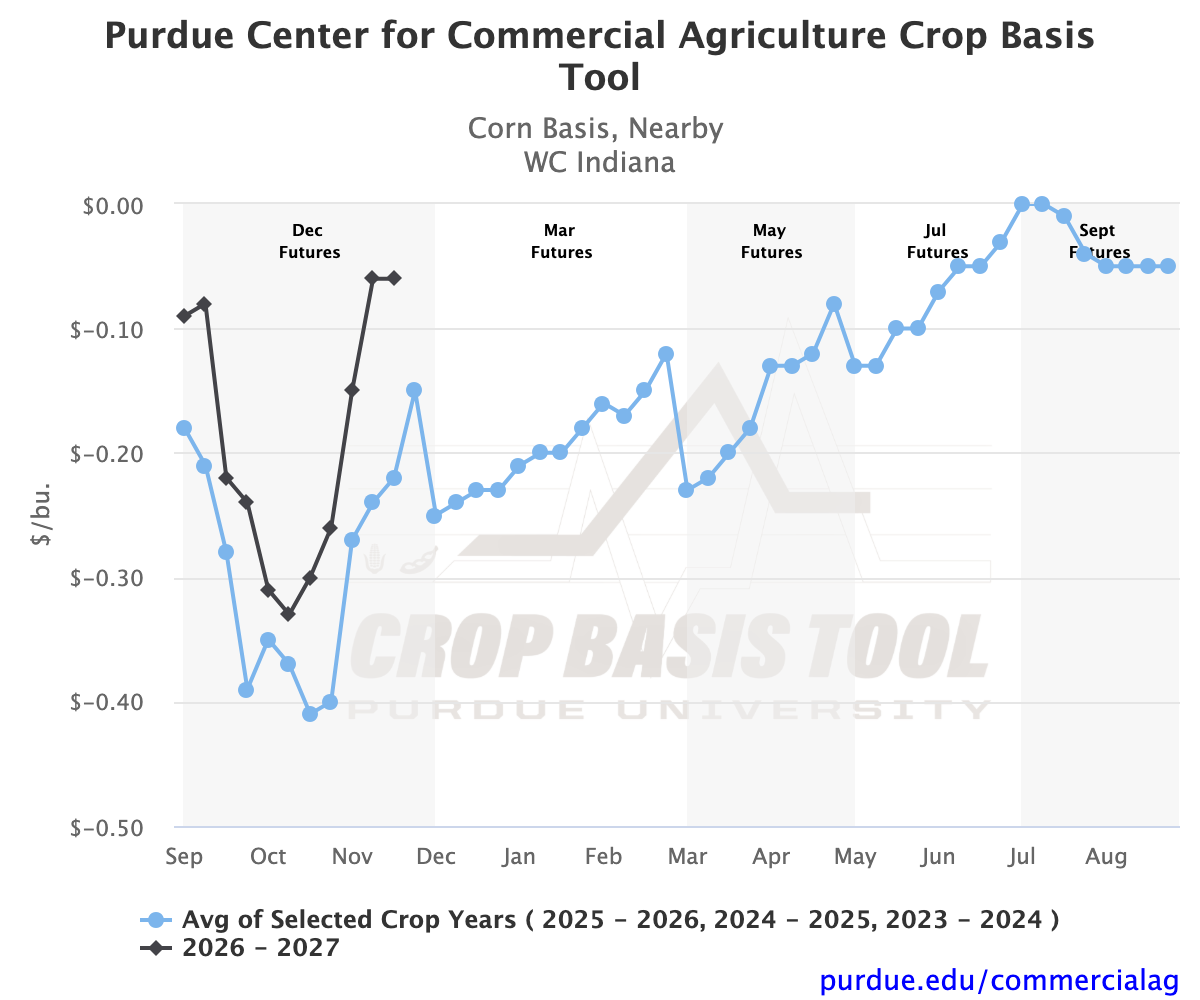
Figure 1. West-Central Indiana corn basis.
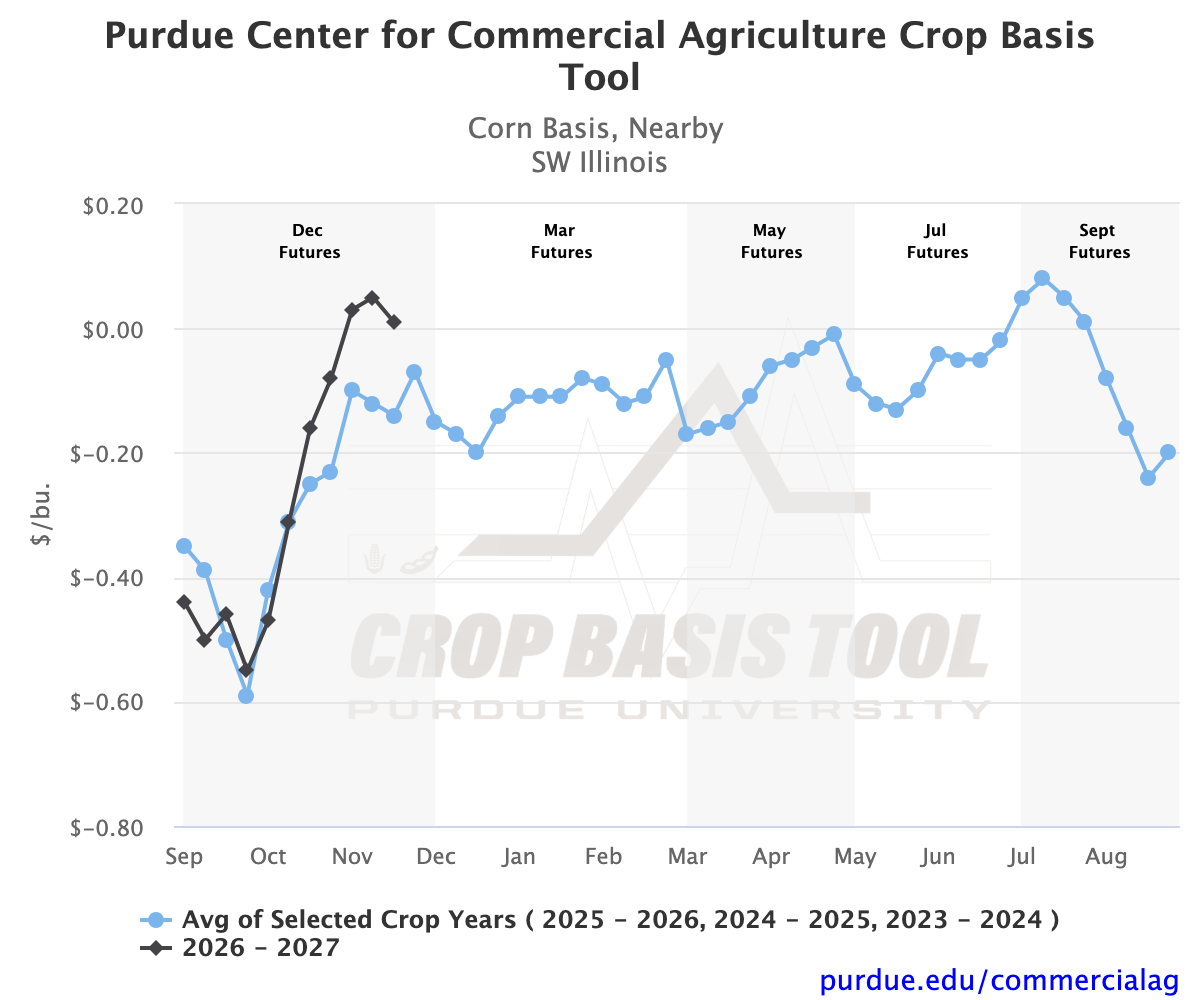
Figure 2. Southwest Illinois corn basis.
In November, basis patterns have been much more consistent across the region. At this time last year, we discussed the post-harvest increase in corn basis, a pattern that has recurred this year. Over the past three weeks, basis has increased in 38 of the 41 tracked crop-reporting districts. On average, basis gained the most in Indiana ($0.18/bu) and the least in Iowa ($0.07/bu). Two of the three outliers were in Eastern Ohio and Southeast Michigan. In East-Central Ohio, basis decreased by $0.20/bu, and in Southeast Michigan, it decreased by $0.02/bu.
Over the past two months, the variance in local basis trends has substantially altered the Eastern Corn Belt basis map (Figure 3). In September, basis was strongest in Indiana and Ohio. Indiana continues to set the benchmark, but Illinois now has among the strongest local basis levels after gains over the past two months. Basis is weakest in Iowa and in eastern Michigan and Ohio. In Northeast Iowa, basis to December futures is -$0.44/bu, the lowest for this time of year since at least 2004.
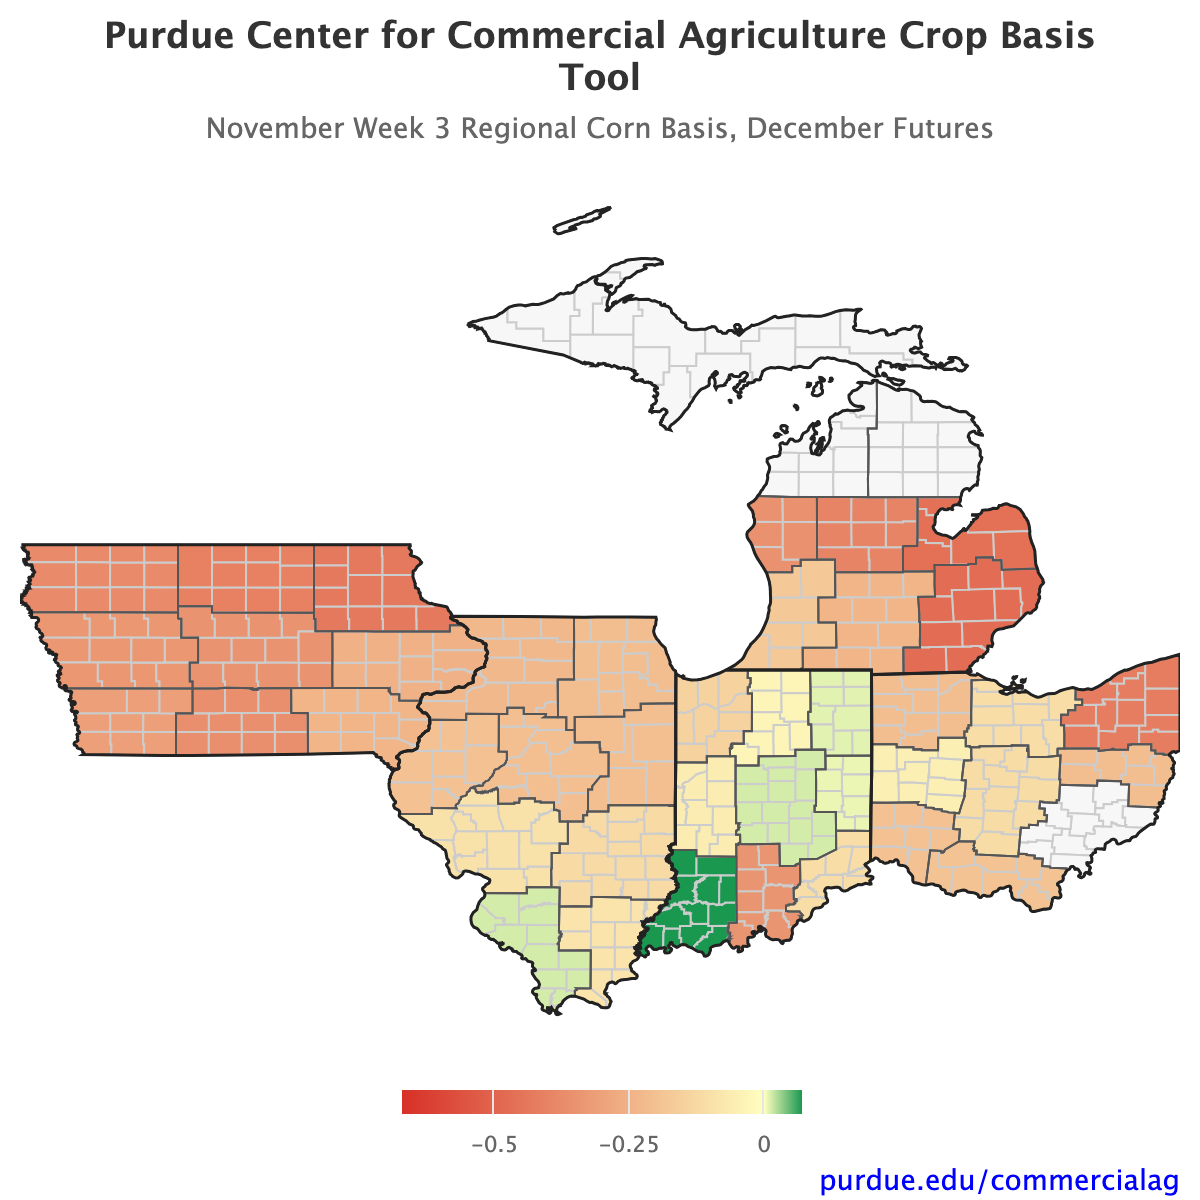
Figure 3. Regional corn basis to December futures, November week 3.
In September, basis was weakest in southern Illinois and Indiana. Following recent gains, Southwest Indiana ($0.07/bu) and Southwest Illinois ($0.01/bu) now rank among the strongest. These local trends may be tied to the Ohio River, where corn basis rose by $0.68/bu to $0.07/bu over the past two months (Figure 4). It is possible that strong basis along the river is tied to export demand. River barges move a large share of U.S. corn exports, although they carry only a small share of all corn shipments (Henderson, Gastelle, and Caffarelli, 2024).
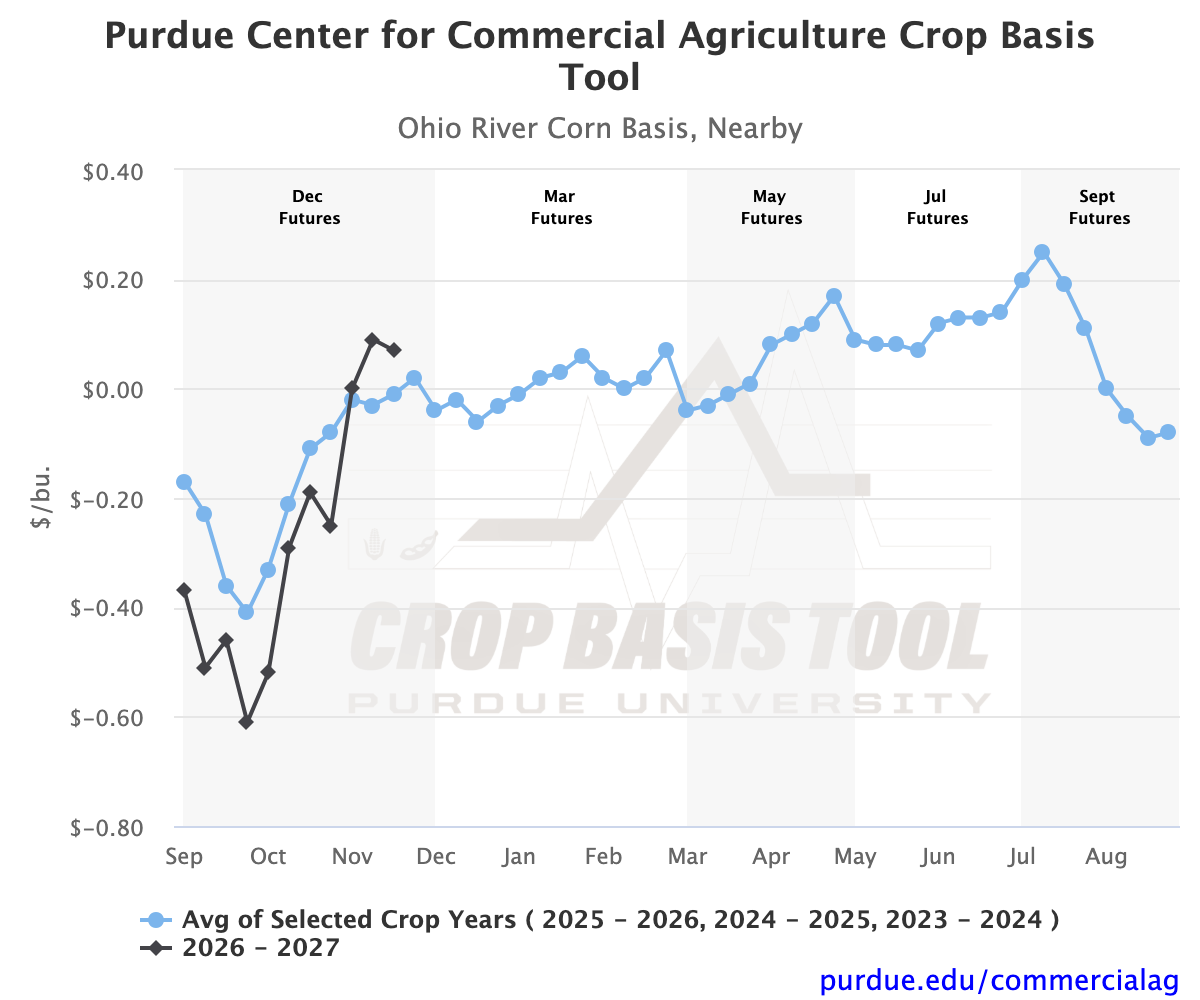
Figure 4. Ohio River corn basis.
Soybean Basis Trends
Soybean basis patterns have resembled corn’s over the past two months. Historical averages suggest soybean basis may bottom out at the end of September, but delayed harvest across the region likely contributed to the delayed seasonal dip. Between the end of September and the end of October, basis fell in half of the crop-reporting districts tracked by the Crop Basis Tool. Basis fell in all nine Iowa districts. For example, basis fell every week in Southwest Iowa, with a cumulative decrease of $0.31/bu to January futures (Figure 5). Consistent with corn, Illinois was the outlier, with basis increasing over the month in each of the state’s nine districts. For example, basis strengthened every week in Southwest Illinois, with a cumulative increase of $0.48/bu to January futures (Figure 6).
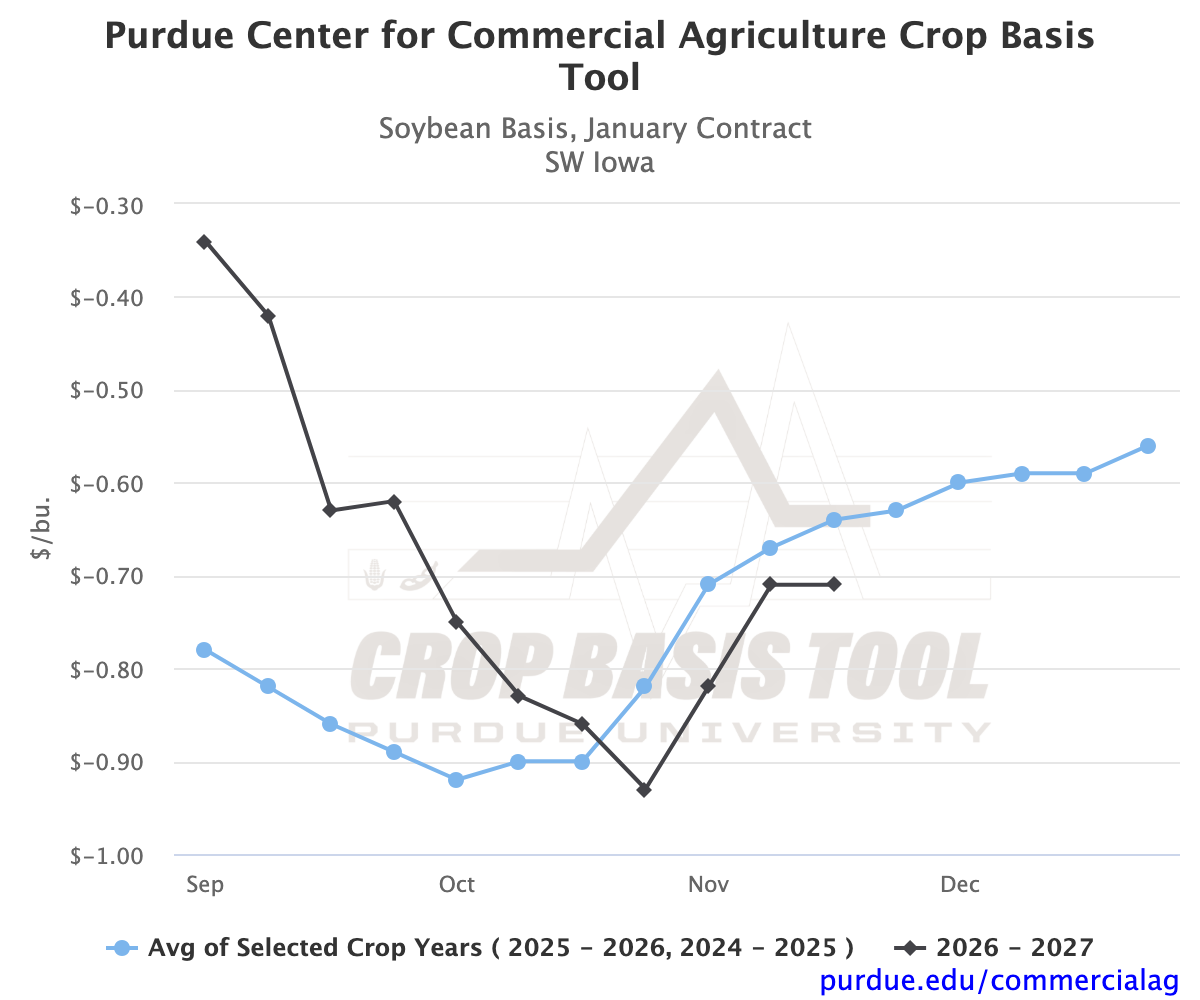
Figure 5. Southwest Iowa soybean basis.
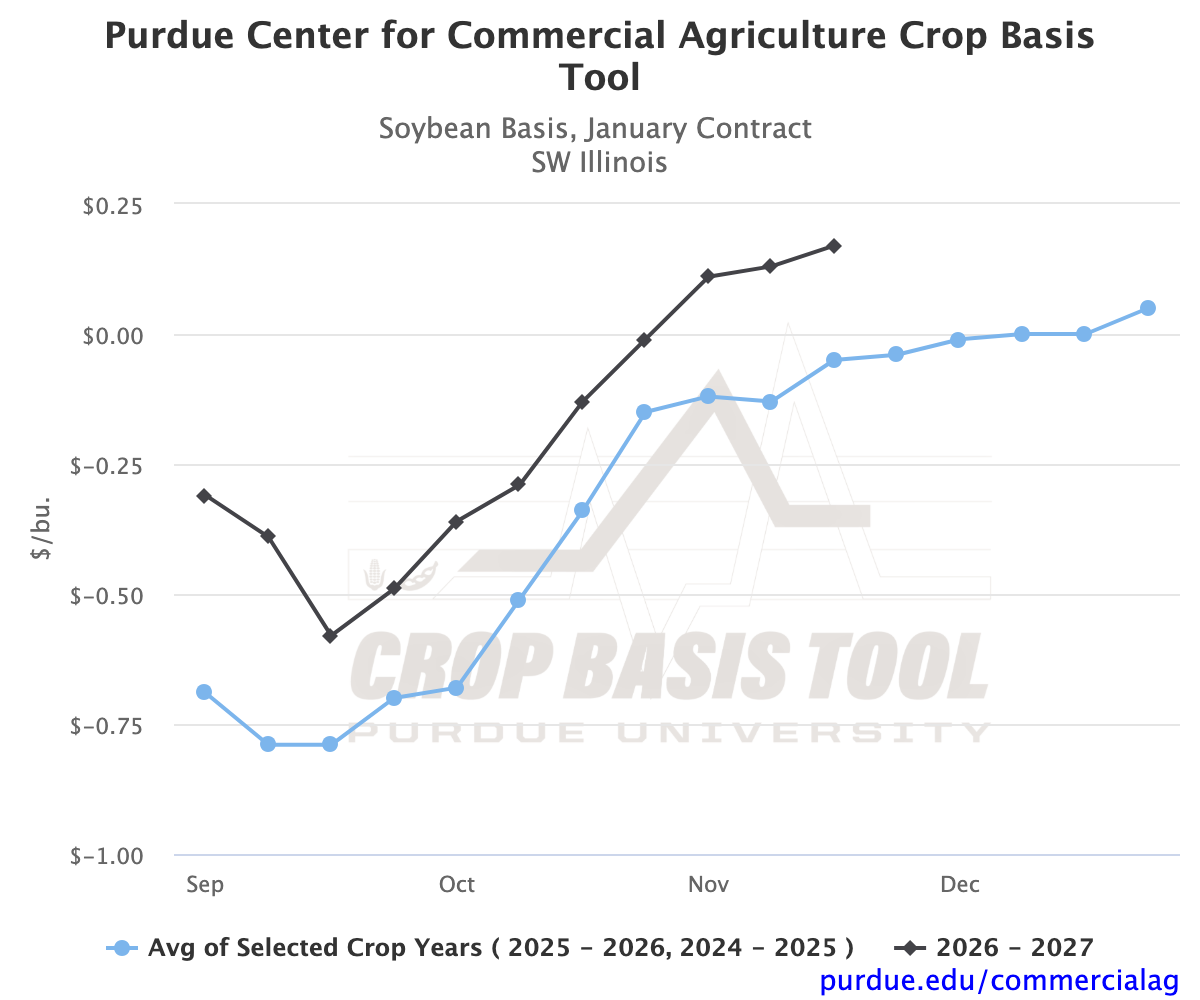
Figure 6. Southwest Illinois soybean basis.
In November, basis rebounded from the harvest dip. Between the end of October and the third week of November, basis increased in all 38 soybean districts. The largest strengthening occurred in Southeast Indiana, where basis rose $0.51/bu (Figure 7). Across Michigan, basis gained the least on average, while East-Central Ohio saw the smallest gains in any individual crop-reporting district ($0.01/bu). Michigan and Iowa were the only states with crop-reporting districts that weakened in basis over the two-month period. Despite the gains across the region, many crop-reporting districts remain below the historical average, including all nine districts in Iowa and seven of eight in Ohio.
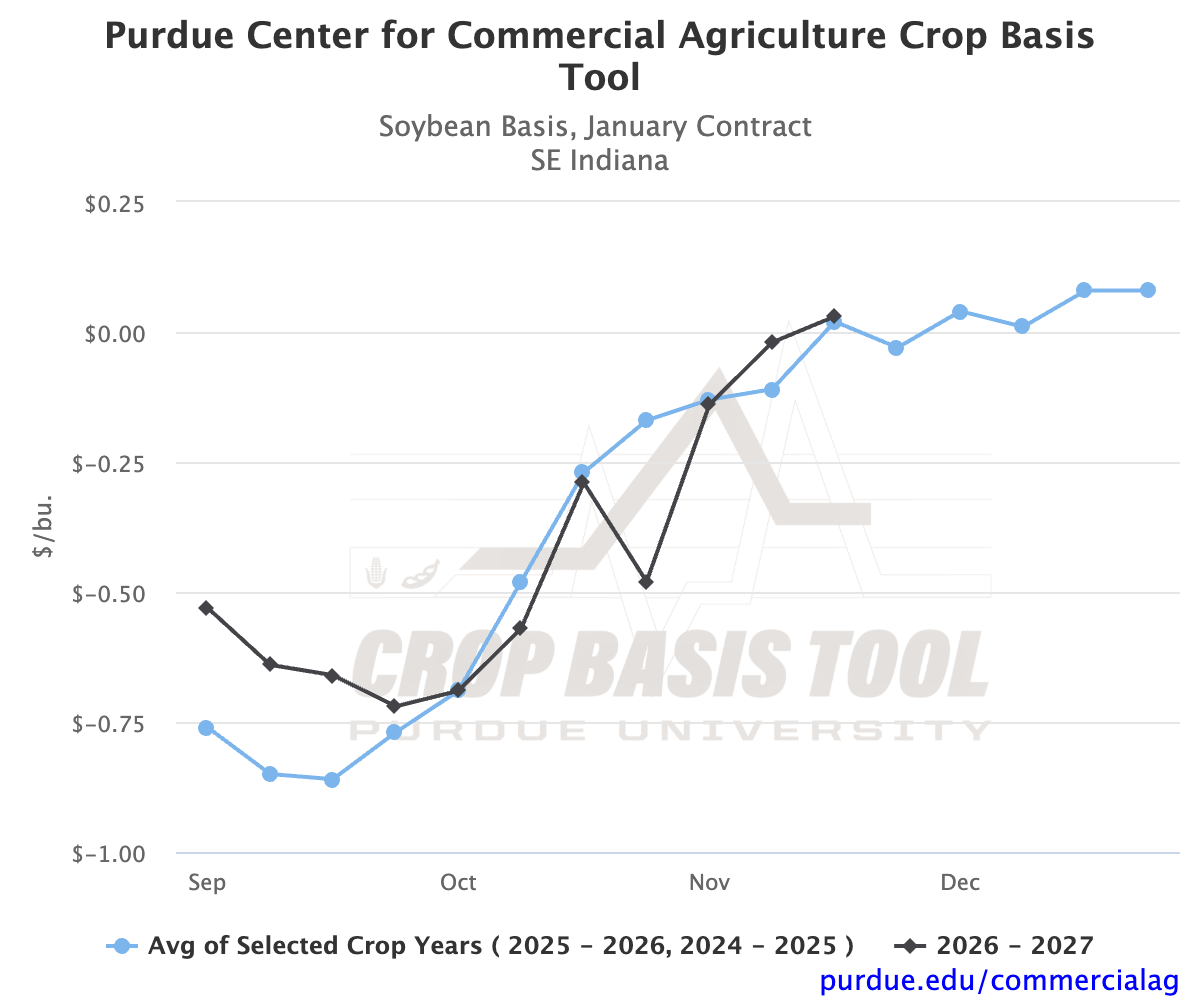
Figure 7. Southeast Indiana soybean basis.
Soybean basis strength in the Eastern Corn Belt is concentrated in the southern parts of Illinois, Indiana, and Ohio (Figure 8). The strongest basis is in Southwest Illinois at $0.17/bu, a record high for this district at this time of year. Basis is also positive in Southeast Indiana at $0.03/bu. Another record is in South-Central Ohio, where basis is -$0.10/bu, the highest for the district this time of year since at least 2004. On the other end, the weakest basis is in Iowa and in Eastern Michigan and Ohio. The average soybean basis across Iowa is -$0.68/bu, while basis in Eastern Michigan and Ohio is below -$0.60/bu.
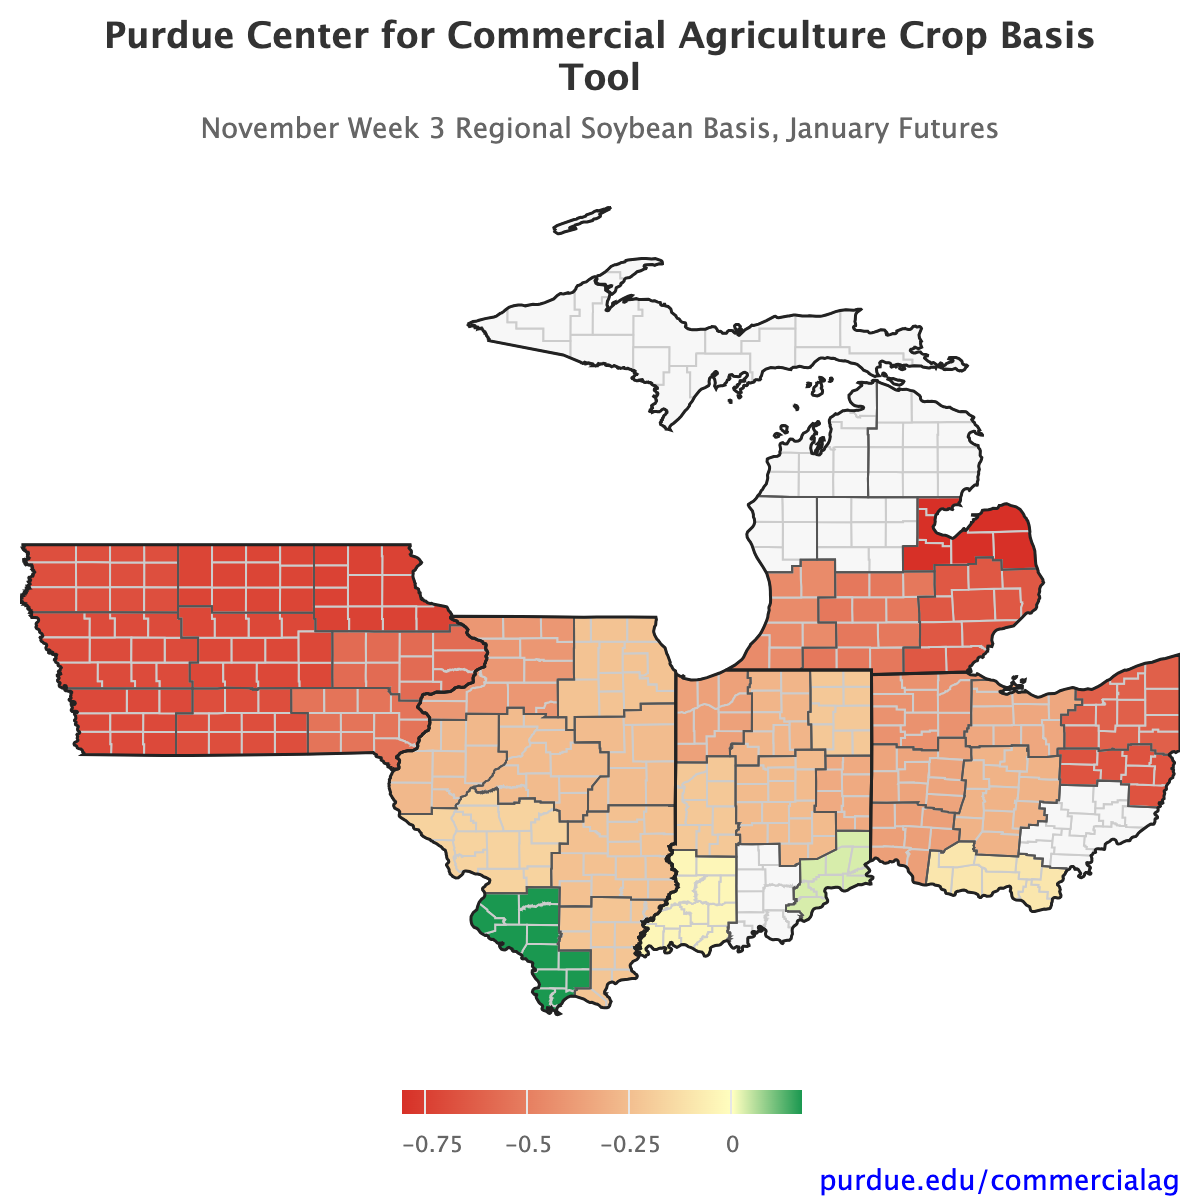
Figure 8. Regional soybean basis to January futures, November week 3.
Iowa soybean processor basis movement is among the largest outliers across tracked bases over the past two months. In the first week of October, basis from soybean processors in the state fell by $0.85/bu (Figure 9). Gains over the past six weeks fell well short of that one-week drop, leaving processor basis $0.62/bu below its September-end level. Despite the drop, the basis level remains in line with the historical trend, as it was more than $0.80/bu above its historical average in late September.
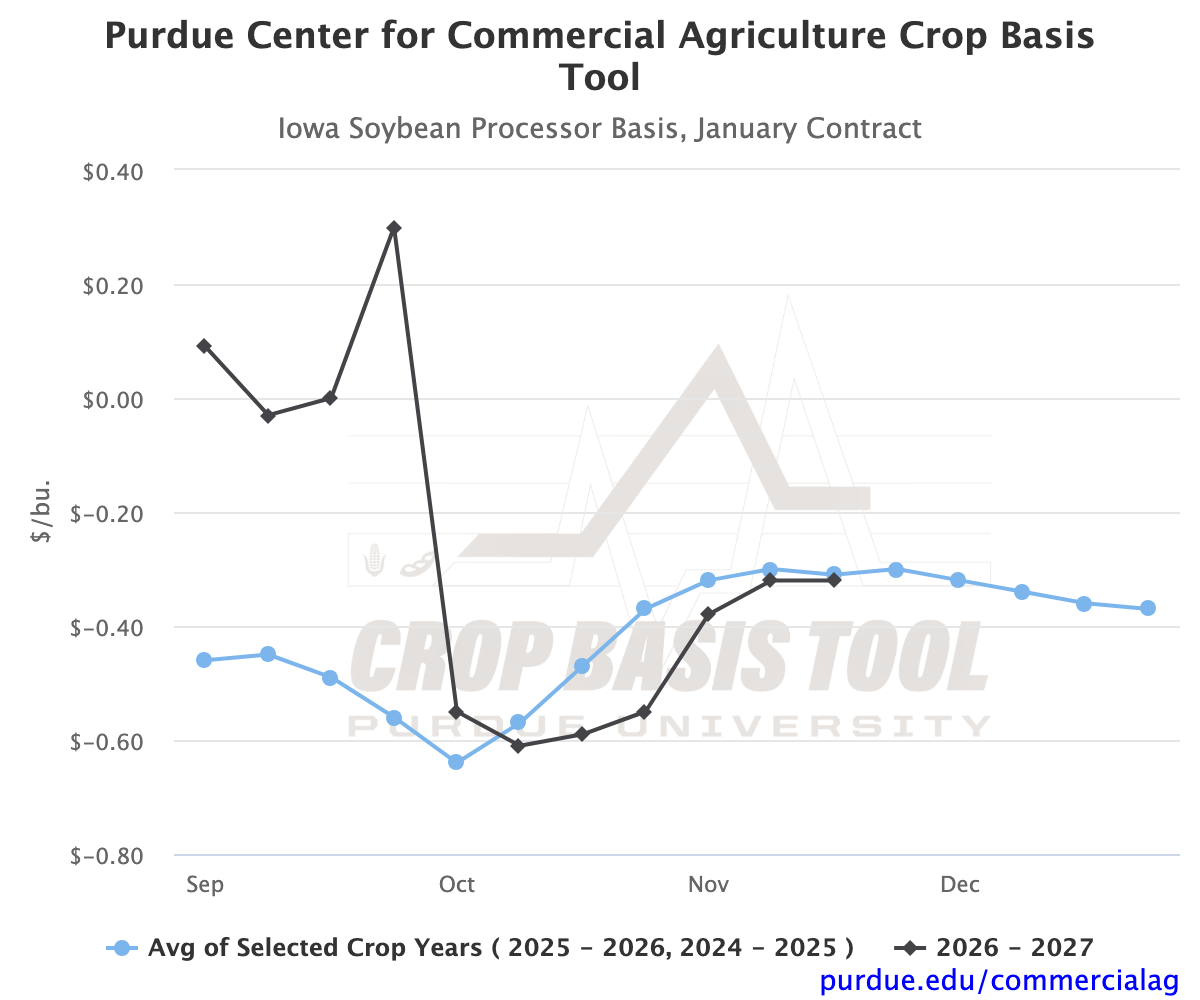
Figure 9. Iowa soybean processor basis.
Looking Ahead
As futures prices have fallen over the past two months, a stronger basis has supported local cash prices across the region to some extent. Looking ahead, the harvest has wrapped up across the region, and grain is in storage. Shifts in basis may be driven by changes in local and national demand for both corn and soybeans. Continued strong pull from ethanol and crush plants can support local basis across the region, and exports may continue to lift basis along the Ohio River. Historical averages point to modest gains over the next month; however, recent volatility, including a $0.30/bu soybean jump in South-Central Ohio over one week, reminds us that conditions can change quickly. To explore your local basis conditions, visit the Purdue Center for Commercial Agriculture’s Crop Basis Tool.
References
Henderson, R., J. Gastelle, and P. Caffarelli. 2024. Transportation of U.S. Grains: A Modal Share Analysis, 1984–2022 Update. U.S. Department of Agriculture, Agricultural Marketing Service. http://dx.doi.org/10.9752/TS049.09-2024
TAGS:
TEAM LINKS:

RELATED RESOURCES
UPCOMING EVENTS
Compare PLC, ARC-CO and ARC-IC before making your 2026 farm program election. Join Purdue’s Michael Langemeier November 16 for a free webinar covering the pros and cons of each option, with time for Q&A.
January 8, 2027
A management programs geared specifically for farmers. Surrounded by farm management, farm policy, agricultural finance and marketing experts, and a group of your peers, the conference will stimulate your thinking about agriculture’s future and how you can position your farm to be successful in the years ahead.