Cash Rents: Pressure is Downward
December 16, 2017
PAER-2017-25
Author: Craig Dobbins, Professor of Agricultural Economics


In order to maintain a viable business, operators have been working to reduce the per bushel cost of production. Reducing cash rents and other crop production cost is often a slow process. The outlook for crop costs and returns indicates operators have been working to lower per bushel production cost since 2013. In 2013, the variable cost per bushel of corn on average quality farmland was $2.83. The projection of for 2018 indicates the variable cost per bushel has declined to $2.39 per bushel. This is about a 16% reduction. Reductions to cash rent have also occurred. In 2013, cash rent per bushel of corn was $1.43. For 2018, our projected per bushel cash rent is $1.13, a reduction of 21% from 2013.
Are these adjustments sufficient? Are cash rents in 2018 likely to reflect the stability indicated by the 2017 Purdue Farmland Value Survey? Table 1 provides estimates of the earnings for a 3,000-acre corn and soybeans farm. The contribution margin represents the difference between gross revenues and total variable cost. Yields for the first three years of estimates are the state average yield report- ed by the National Agriculture Statistics Service, USDA. The 2018 yield is the trend line yield used in the 2018 Purdue Crop Cost & Return Guide. Prices for corn and soybeans in 2015 and 2016 are the marketing year average prices. Price projections for 2017 & 2018 are from the crop guide. Variable costs, operator labor, and machinery overhead are from the crop guide. Cash rent for 2015, 2016 and 2017 are the statewide average for average quality land reported in the Purdue Farmland Value Surveys. The 2018 cash rent is an estimate.
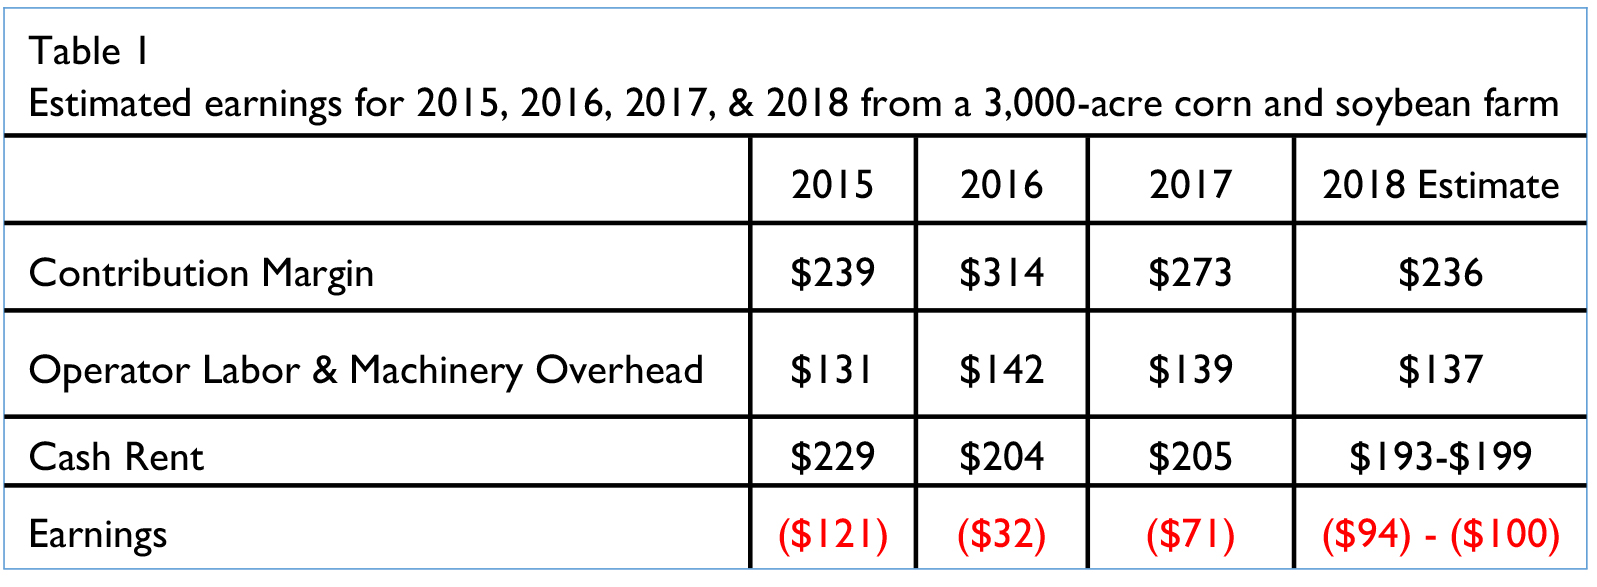
Table 1. Estimated earnings for 2015, 2016, 2017, & 2018 from a 3,000-acre corn and soybean farm
The contribution margin is total gross revenues less variable costs. This margin is the amount of gross revenue remaining to pay the resources of operator labor, machinery, and land or cash rent. The cost estimates for these re- sources indicate an estimate of the payment required to keep these resources in their current use. The negative earnings indicate there is not enough income to compensate these resources at the estimated cost. It also indicates continued pressure to lower per bushel production costs or in- crease revenue. The larger negative values for 2018, indicates this pressure is increasing rather than declining.
The 2018 expected corn and soy- bean contribution margin at $236 per acre is smaller than in 2017. This reduction in margin arises from 2018 trend yields being below 2017 yields and increasing crop protection costs related to weed resistance. An additional consideration when comparing the 2018 contribution margin with 2015 and 2016 is the loss of government support payments after the 2016 crop.
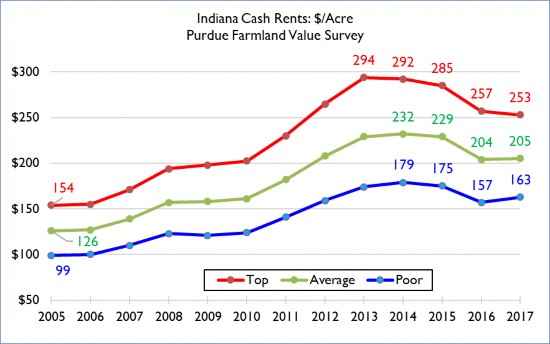
Given the economic pressures at this time, 2018 cash rent is expected to be lower. Periods of declining cash rent are historically rare. The better than expected yields for many producers in 2017 will provide support for stable cash rents, but continued low crop prices indicate producers need to continue all efforts to reduce costs. Anticipated cash rents in 2018 will be 3% to 6% lower than in 2017. Even with this reduction which is al- ready built into numbers in Table 1, estimated earnings associated with rented land will be more negative than in 2017.
Using futures markets to look beyond 2018, the market anticipates corn prices will move towards $4.00 while soybean prices will remain flat. These price movements will generate more revenue for a corn and soybean rotation, but at current production cost, earnings continue to be strongly negative. In other words, looking for ways to reduce the cost of production will need to continue.
The budget numbers presented here do not represent a specific farm. It is always important to know what num- bers represent your situation in order to establish an equa- ble cash rent. In the current economic environment, contri- bution margins (revenues minus direct costs) are small. If cash rent is less than the contribution margin, the differ- ence that remains helps to pay overhead and operator labor costs. Then the loss minimization strategy would be to continue farming the farm.
However, if the cash rent is more than the contribution margin, there is no positive contribution associated with renting the land. With cash rent larger than the contribution margin, the loss minimization strategy is to stop rent- ing the farm. Releasing a rented farm is a difficult deci- sion, but continuing to farm land that will not pay the rent only contributes to lower profitability. Terminating the lease for farms of this type can help reduce operating loss- es and lower financial stress.