The September 2026 CPI and PPI Reports: Energy Drives Energy, Not Grocery Prices
October 21, 2026
PAERPB-2026-16
Ken Foster, Professor of Agricultural Economics and Director, Purdue Farm Policy Study Group; Bernhard Dalheimer, Assistant Professor of Macroeconomics and Trade


Two Reports, One Energy Signal
Energy is the headline of both September reports. The Producer Price Index (PPI) for final demand rose 1.3 percent, the largest advance since March 2022. Final demand goods rose 2.6 percent, the largest increase since the series began in 2009. Over 80 percent of that rise is attributable to energy (final demand energy +10.8 percent), and gasoline alone (+20.3 percent) accounts for half of it. The Consumer Price Index (CPI) for energy rose 5.2 percent for the month, after −1.5 percent in July and +2.1 percent in August. Gasoline, up 9.1 percent, accounted for more than half of the monthly all-items increase, and energy is now up 20.4 percent over 12 months. Energy costs are rising and some energy-sensitive services, too. But food at home is flat. The September PPI food fluctuations are commodity-specific noise rather than gas- or diesel-driven.
- – Core CPI rose 0.3 percent for the month and 2.6 percent over 12 months. Airline fares (+1.2 percent), transportation services (+0.6), used cars (+0.7) and lodging away from home (+2.0) rose, which suggests that energy has spilled into longer-term cost structures of economic activity.
- – PPI diesel fuel rose 21.0 percent. Retail diesel passed $6 a gallon for the first time ever in the second week of September and reached $6.31 on September 16 (Marketplace). Brent crude averaged $114 per barrel in September, $23 above August, with a daily peak of $131 on September 15. EIA’s fourth-quarter forecast is $105 (Short-Term Energy Outlook, October 6).
Food at Home Is Flat; Food Away From Home Is Not
The September CPI shows a three-way divergence. Food at home rose 1.8 percent over 12 months (−0.1 percent in September, and down from 2.2 percent in August), core CPI rose 2.6 percent, and food away from home rose 3.5 percent (+0.2 percent in September).
- – Farm share. Food at home carries a farm share of roughly 24 cents of the dollar; food away from home only about 5.4 cents, with labor and overhead making up nearly all the rest. In contrast, food away from home, including delivered food, reflects larger shares of labor, rents and transport costs, all of which have been up substantially.
- – Labor and rent. Leisure and hospitality hourly earnings were about 3.9 percent above a year earlier in September, against 3.0 percent for all private employees (BLS). We read this as a sticky level effect and not a new acceleration. Commercial rent is a current pressure: the PPI for nonresidential rents is up 5.4 percent over 12 months and 1.0 percent in September alone. These factors likely explain the food at home vs. food away from home dichotomy.
- – Diesel and freight costs are still strongly under pressure because of shortages resulting from the Strait of Hormuz closure. In contrast to food at home, which is exposed to transport costs only on the farm and along distribution to grocery stores, food away from home requires more transportation to and from restaurants and other selling points.
PPI Food: Individual Storylines, Not a Pipeline Signal
Stage 4 intermediate demand rose 1.1 percent in September, ending a run of smaller gains (0.4, 0.4 and 0.6 percent in June through August); it is the largest advance since May. At December 2025 weights, September changes explain about 0.97 of the 1.1 points: trade services about 28 percent, energy about 26 percent (a +18.5 percent construction-fuel spike and +2.0 percent for energy bought by services producers), nonfood and nonenergy goods about 16 percent, food about 10 percent (+3.6 percent in the goods-producer channel, tied to vegetables), and transportation and warehousing and other services about 10 percent each. This is neither an “energy finally broke through” story nor a food story, and it complicates the flat-Stage-4 shorthand without reversing the overall energy headline.
Final demand foods rose 1.2 percent after falling 0.6, 1.0 and 0.3 percent in June through August, leaving the index about 0.6 percent below May, so September is mostly a rebound. CPI food at home fell 0.1 percent in the same month. PPI Table 2 shows gains in fresh and dry vegetables (+41.0 percent), grains (+17.4), oilseeds (+11.4), seafood (+9.0), fresh fruit (+3.7) and beef and veal (+3.3), against a decline in eggs (−31.9). Processed and packaged items were flat to down (bakery +0.2, pasta 0.0, processed fruit and vegetables 0.0, confectionery −0.3, frozen specialty −0.4, dairy −1.1, pork, chicken and turkey −3.7 to −4.8). Broad energy pass-through would show first in packaged goods, and those are not moving. Rough contributions at December 2025 weights, which drift with relative prices, are shown with each item below.
- – Fresh and dry vegetables (+41.0 percent, after −34.9 percent in July; about +1.1 points). The largest item, and probably overstated because the July drop lowered the effective weight. CPI food at home fell 0.1 percent, and CPI lettuce rose 3.9 percent. Trade reports point to a rebound from a summer glut, heat and insect pressure in coastal California, and regional supply gaps. Produce reaches retail within weeks, so this is the fast channel. Fuel and freight are background, not the source of a swing this size.
- – Beef (PPI +3.3 percent, about +0.3 points; CPI −1.0 percent). Retail beef inflation is 3.5 percent over 12 months, down from 11.8 percent in June, with four straight monthly CPI declines, while USDA’s October outlook lowered the 2026 beef production forecast only fractionally, to 24.8 billion pounds (ERS). Imports do not explain the gap. The August 21 proclamation expanded the lean-trimmings quota by 300,000 metric tons over 90 days from September 1, but only 37,486 had entered by September 28 (Beef Magazine estimates 8,054 to 21,936 were incremental), and the American Farm Bureau found 80 percent lean ground beef at 41 stores falling just 2 percent ($7.29 to $7.13) from September 2 to 23. Heavier baseline trimmings imports (up 17.2 percent from 2025 through September 19) are a plausible but unquantified contributor. Cut mix does not explain beef’s recent passivity either (ground beef −0.8, steaks −1.0, roasts −3.6). We flag the wholesale–retail gap rather than forecast it.
- – Seafood (+9.0 percent, about +0.2 points). The Fifth National Climate Assessment finds climate change poses a substantial risk to fisheries (high confidence), and NOAA Fisheries links the Alaska snow crab collapse and declines in Yukon River Chinook and chum salmon to the 2018–2019 marine heat wave, in hedged language (“likely,” “thought,” “preliminary”). ADF&G’s preliminary Blue Sheet data, as compiled by The Run, put the 2026 statewide commercial harvest at about 88.6 million fish through October 19, 74 percent of ADF&G’s 119.9 million-fish commercial-comparable forecast and well below the 197.4 million harvested in 2025 (sockeye reached 85 percent of its forecast, pink 67 percent). The total was already 87.0 million on September 5, so little was added after that.
- – Fresh fruit (+3.7 percent, about +0.1 points). USDA ERS data (via FreshFruitPortal, October 1) show grower prices near last year’s highs and rising seasonally into an August–October peak. Trade reports add tight strawberry supply (Salinas and Watsonville, California) and a seasonal pineapple gap.
- – Also noted: eggs (−31.9 percent, about −0.5 points). The one large downward item largely reverses a summer wholesale rebound: USDA reports New York large eggs at 111¢ per dozen in August and 83¢ in September. The BLS retail price, $2.27, is 63 percent below the March 2025 peak of $6.23, a surge the Congressional Research Service attributes in part to avian influenza. 2026 outcomes are a return to normal trend in egg prices.
- – Also noted: corn and soybeans (grains +17.4 percent, oilseeds +11.4 percent). The pricing date followed the early-September highs: December corn hit a contract and three-year high on September 1 and nearly $5.50 on September 2. Escalating Russian attacks on Ukrainian ports and export infrastructure are causing another drop in grain and oilseed exports from the Black Sea region, pushing prices upwards. At the same time, USDA’s October 9 report raised corn yield to 181.2 bushels per acre (September: 178.5) and production to 16.034 billion bushels, projected to be the second largest crop on record, with projected record soybean yield (53.1) and production (4.562 billion bushels). December corn closed at $4.80 on October 9, 13 percent below the early-September high, and November soybeans at $12.92, about 2 percent below their September 1 close, reflecting harvest seasonal lows and the large USDA production forecast.
Who Bears the Volatility?
If neither prices nor margins moved, unit costs were flat on net, so something offset the rise in energy costs. The data point mainly to cheaper ingredients and inputs (materials for food manufacturing −5.6 percent over 12 months). Risk management may also matter. Processors can hedge input costs (energy, grains, oilseeds, livestock) with futures, options and fixed-price contracts, but most processed foods have no futures market, so output prices are unhedged. Retailers dislike price volatility because relabeling and restocking are costly and shoppers respond adversely to price swings. Moreover, retailers have few risk management tools available. Hedged processors price off a lagged, smoothed cost, which delays pass-through in both directions: a cost increase shows up late, and so does the benefit of cheaper ingredients. Figure 1 is consistent with this damping. Over the period shown, 12-month changes in farm products and in unprocessed foodstuffs and feedstuffs span roughly 12 percentage points, against about 3 to 4 points for processed foods and finished consumer foods. Part of that damping is arithmetic, because farm products are a modest share of the cost of finished foods, and part may be the smoothing described above. These data cannot separate the two. Hedges distribute a shock to counterparties and reprice as contracts roll off, but do not remove the shock forever. We have no data on hedge books or contract terms, so this is a hypothesis, and the October and November data may help us understand where exactly the volatility has been absorbed.
Figure 1
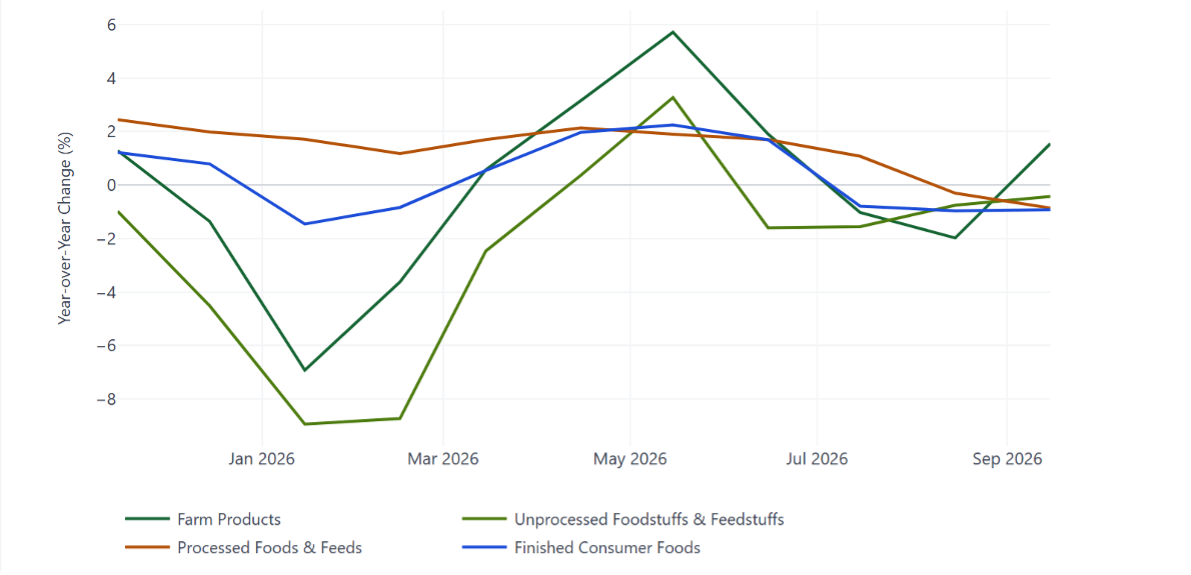
Earlier stages of the food chain show larger swings in year-over-year price changes than later stages. Twelve-month percent change in selected producer price indexes, November 2025 through September 2026: farm products (WPU01), unprocessed foodstuffs and feedstuffs (ID6 21), processed foods and feeds (WPU02) and finished consumer foods (FD 4111). Source: U.S. Bureau of Labor Statistics, Producer Price Indexes, September 2026 (USDL 26-1576, released October 15, 2026).
Looking Ahead: Oil, Fertilizer and the 2027 Crop
Oil-related price pressures are likely to become more serious if the shock prolongs and intensifies. So far it has affected energy and energy-sensitive services rather than the grocery aisle, but hedges and contracts reprice as they roll off. Brief #2026-02 (March 2026) built a central scenario adding 3 to 6 percentage points to food-at-home inflation over 12 to 18 months under a sustained conflict, so at seven months we are only partway through that window. However, to date, food price inflation is running behind what that simple scenario suggested and looks closer to the minimal pass-through storyline.
For farmers, the decisions start now. To date, fertilizer price increases have affected the 2026 crop only minimally because, as earlier briefs noted, most fertilizer for it was already applied or forward priced. That is changing: Corn Belt farmers are entering the period in which they would ordinarily begin buying and applying nitrogen for next year’s corn. DTN’s early-October survey put retail anhydrous ammonia at $977 per ton (+20 percent from a year earlier) and urea at $672 (+12 percent), and the Persian Gulf normally supplies about 40 percent of globally traded urea (NDSU analysis in farmdoc daily). A prolonged Strait of Hormuz conflict would hold fertilizer high into the 2027 crop year, squeeze farm margins and could shift the crop mix, resulting in increased impacts on livestock and poultry feeders and consumer prices.
Two other factors point away from nitrogen-intensive corn and toward oilseeds that can be grown on the same land. EPA’s final Renewable Fuel Standard sets biomass-based diesel at 8.86 billion gallons for 2026 and 8.95 for 2027, supporting soybean oil and soybean demand. And NOAA’s October 8 outlook says a strong-to-very-strong El Niño is likely through January–March 2027 (greater than 83 percent chance), which could cut Southeast Asian palm oil output. Soybean oil is a potential substitute in biodiesel and other uses. USDA had already trimmed Malaysia’s 2026/27 palm oil production estimate in July on El Niño-linked dryness. We will return to these in the November brief as things evolve.
The Bottom Line
September’s data fit the thesis. Energy shows up in energy and in some energy-sensitive services. Food at home is flat, and the large PPI food moves trace to a handful of commodities rather than broad pass-through; packaged goods, where pass-through would show first, are flat to down. Where the energy cost went is not yet clear: cheaper ingredients are the most visible offset, while hedging and contracting and margin absorption may delay the rest. October and November CPI may be the test, and this fall’s fertilizer decisions will begin to shape the 2027 story.
Data Sources
BLS, Consumer Price Index – September 2026 (USDL-26-1574, October 14) and August 2026 (USDL-26-1496, September 11); BLS, Producer Price Indexes – September 2026 (USDL 26-1576, October 15), https://www.bls.gov/ppi/, and PPI FAQs, https://www.bls.gov/ppi/faqs/questions-and-answers.htm; BLS, The Employment Situation – September 2026, https://www.bls.gov/news.release/archives/empsit_10022026.htm; leisure and hospitality average hourly earnings (CEU7000000003, not seasonally adjusted), https://fred.stlouisfed.org/data/CEU7000000003
Energy: EIA, Short-Term Energy Outlook, October 2026, https://www.eia.gov/outlooks/steo/archives/oct26.pdf; Marketplace, September 16, 2026, https://marketplace.org/story/2026/09/16/how-rising-diesel-prices-will-show-up-in-your-grocery-bill; OilPrice.com, October 8, 2026, https://oilprice.com/Latest-Energy-News/World-News/US-Gasoline-Prices-Set-October-Record-Even-as-National-Average-Slips.html
Crops and livestock: USDA NASS, Crop Production, October 2026, https://esmis.nal.usda.gov/sites/default/release-files/796101/crop1026.txt; Farm Progress, October 9, 2026, https://www.farmprogress.com/marketing/usda-yield-shocker-sends-corn-sinking-to-eight-week-low; Pro Farmer, September 1, 2026, https://www.profarmer.com/pro-farmer-max/crops-analysis/crops-analysis-grains-soy-kick-month-high-note; USDA ERS, Livestock, Dairy, and Poultry Outlook, September (LDP-M-387, https://ers.usda.gov/publications/115587) and October 2026 (LDP-M-388, October 16); The Poultry Site, June 17, 2026; Congressional Research Service, IF12949, https://www.everycrsreport.com/reports/IF12949.html
Beef, produce and seafood: American Farm Bureau Federation, September 23, 2026, https://www.fb.org/intel/markets/increased-beef-imports-have-not-lowered-prices-for-consumers; Beef Magazine, https://www.beefmagazine.com/market-news/how-much-additional-beef-actually-entered-the-u-s-in-september-; S&P Global Platts, September 29, 2026; Markon, August 30; Ingardia Bros, September 1; produce market report, September 17 (distributor not named); FreshFruitPortal, October 1; Undercurrent News, September 3 and 18 (paywalled); NOAA Fisheries, https://www.fisheries.noaa.gov/alaska/bycatch/frequent-questions-snow-crab-and-salmon-declines-alaska; Fifth National Climate Assessment, Ch. 10, https://toolkit.climate.gov/NCA5_Ch10_Oceans
The Run, Alaska salmon harvest statistics (compiled from ADF&G’s Preliminary Alaska Commercial Salmon Catch Report, “Blue Sheet”), data through October 19, 2026, https://therun.news/stats
Fertilizer, biofuels and El Niño: DTN, October 14, 2026, https://www.dtnpf.com/agriculture/web/ag/crops/article/2026/10/14/uan32-leads-fertilizer-prices-higher; farmdoc daily, April 29, 2026, https://farmdocdaily.illinois.edu/2026/04/strait-of-hormuz-disruption-scenarios-and-fertilizer-purchasing-risks-for-u-s-crop-producers.html; Farm Bureau Intel, May 5, 2026, https://www.fb.org/intel/markets/epa-sets-record-renewable-fuel-volumes-for-2026-2027; NOAA Climate Prediction Center, October 8, 2026, https://www.cpc.ncep.noaa.gov/products/analysis_monitoring/enso_advisory/ensodisc.shtml; Hellenic Shipping News, July 7, 2026, https://www.hellenicshippingnews.com/?p=1139964
Earlier briefs in this series, including Brief #2026-02, are available at ag.purdue.edu/commercialag.