Pasture Rental Rates Rise in 1989
March 16, 1990
PAER-1990-2
Author: J.H. Atkinson, Professor of Agricultural Economics


In a June 1989 survey conducted by Purdue, the state average cash rent for permanent non-rotation pasture was $32.32 per acre. This was up 16 percent from 1988. Favorable cattle prices and drought-related shortages of hay in 1989 likely were the major factors causing this increase.
The value of permanent pasture was $501 per acre statewide. The cash rent was 6.5 percent of this figure.
The carrying capacity was 1.8 acres per cow. This would imply a cost per cow per year of $58.18, or $6.46 per cow per month based on a nine-month grazing season.
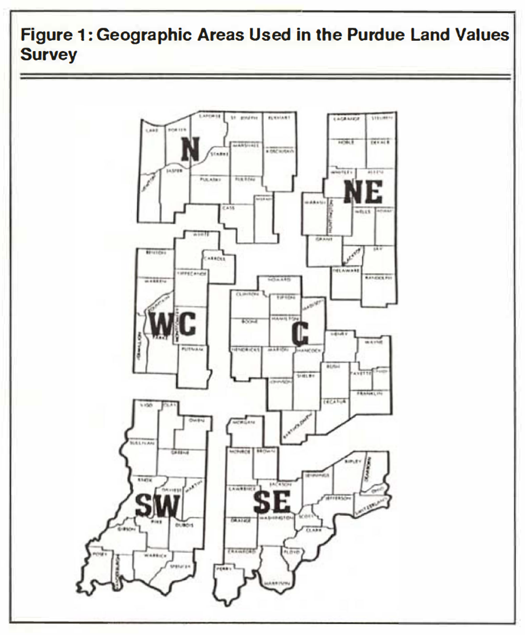
Figure 1: Geographic Areas Used in the Purdue Land Values Survey
By areas (Figure 1), average pasture rent per acre was similar. Except for the southeast, the area averages ranged from $31.22 in the southwest to $34.55 in central Indiana, or about 10 percent from low to high. The average was $29.92 per acre in the southeast (Table 1). As a percentage of pastureland value, the range by area was from 5.9 percent to 6.4 percent except in the north where the estimate was 8.7 percent. Carrying capacity varied from 1.5 acres per cow to 2.3 acres per cow. Rent per cow per year fell mostly in the range of $50 to $60 in the four northern areas and $60 to $70 in the two southern areas.
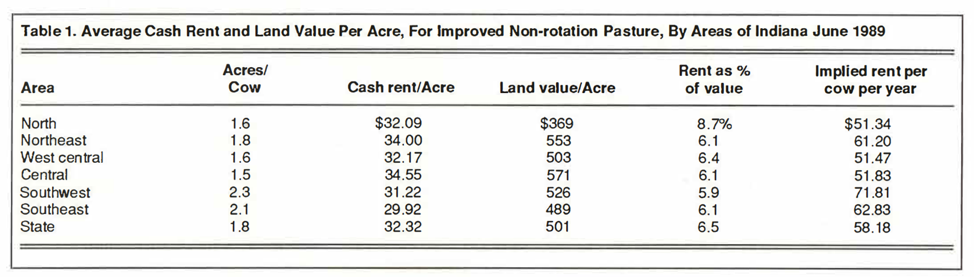
Table 1. Average Cash Rent and Land Value Per Acre, For Improved Non-Rotation Pasture, By Areas of Indiana June 1989
Pastureland values fell within a $100 range, ($489 to $571) in all areas except the north, where this value was only $369. The fact that carrying capacity and cash rent estimates in the north are in line with other areas leads to the conclusion that the land value estimate in that area probably is not reliable. This conclusion is further strengthened by the fact that in four of the six areas the median was $500 and only $25 less in the fifth area, the southwest. Thus, pasture values as reported in the north in 1989 are out of line with all other areas of the state even though carrying capacity and cash rent were similar to other areas. They are also out of line with the 1988 estimates of that area.
In spite of the pasture value estimate concern in the north, the following conclusions arise from the survey:
- Area averages of pasture rental rates in the central and northern parts of the state were from about $32 to $34.50 per acre.
- Rental rates in the two southern areas averaged between about $30 and $31 per acre.
- An average of over two acres per cow was reported in the southern areas, while this figure was from 1.5 to 1.8 in other areas.
- Except for the North, average permanent pasture values per acre were from about $490 to $570, with the lower figure being in the southeast. In much of the state, the round figure of $500 per acre appears reasonable.
- Pasture rent as a percent of land value is around 6 percent except in the north. Cropland rents in 1989 were around 7 to 8 percent of land value.
There is more variation in estimates of pasture rent and carrying capacity than in estimates of com yields and cropland rent. Owners and tenant users of permanent pasture should thus recognize that cash rents and carrying capacity of specific acreages may vary considerably from the averages in this report.