March 3, 2022
Understanding the Corn Market’s Response to War in Ukraine
by James Mintert & Nathanael Thompson
Russia’s invasion of Ukraine in late February disrupted world supplies of several key agricultural commodities, including corn. Some readers were likely surprised to learn that Ukraine is an important supplier of corn to the world. A bit of background is in order since it’s only in recent years that corn production in Ukraine increased to the point where shifts in Ukrainian production and exports began to impact corn prices.
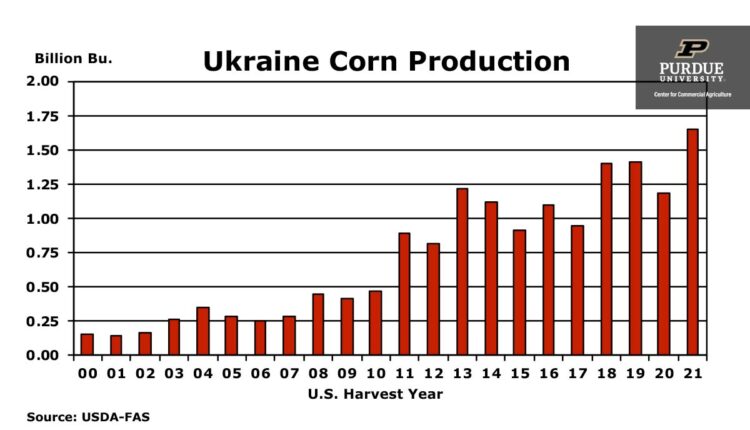
In the early 2000’s corn acreage in Ukraine was quite small, ranging from about 3 million to just over 4 million acres. That started to change as the first decade of the 21st century came to a close and by 2010 corn Ukrainian corn producers were harvesting over 6 million acres of corn. Corn acreage continued to climb in recent years, approaching 8 million acres in 2021, more than doubling in two decades.
At the same time that corn acreage was increasing, Ukrainian corn yields began to increase. National average yields that ranged from a little less than 50 bushels per acre to the high 60’s in the early 2000’s first eclipsed the 100 bushels per acre barrier in 2011. USDA’s Foreign Agricultural Service estimated 2021’s average yield at 126 bushels per acre, 2.6 times the average yield in 2000, setting a new record. The combination of larger acreage and higher yields pushed Ukrainian corn production up from just 151 million bushels in 2000 to an estimated 1.653 billion bushels in 2021.
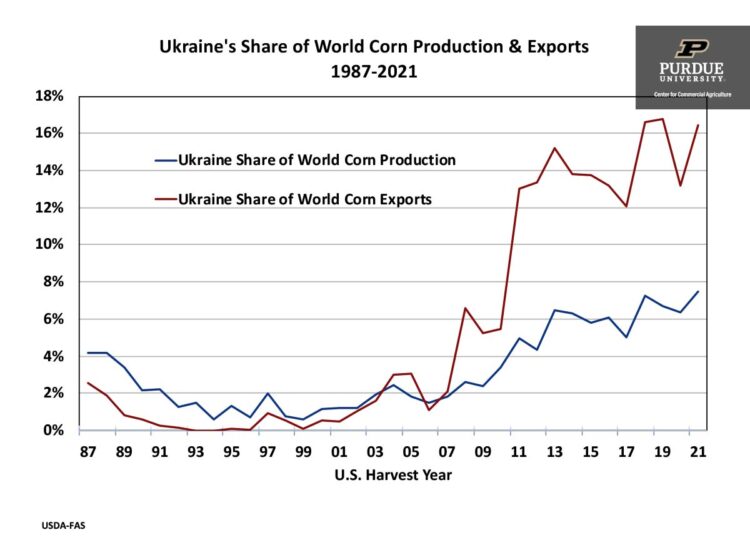
As corn production increased, Ukraine’s exportable surplus increased rapidly, and the percentage of Ukraine’s production exported rose from 10% in 2000 to over 80% in recent years. As a result, Ukraine changed from providing less than 1% of the world’s corn exports in 2000 to nearly 17% in recent years. Losing access to Ukraine’s corn exports significantly altered the world supply/demand balance. Not only has it tightened world corn supplies at a time when concerns have been arising regarding South American corn production because of adverse weather in Argentina and Brazil, but it also shifted the pattern of the world’s corn trade.
With Ukraine’s Black Sea ports closed for the foreseeable future, some export sales that were expected to originate from Black Sea ports needed to be filled from other sources. Exporters looking for corn to fill prior sales commitments have been shifting the origination from Black Sea ports to the U.S., resulting in exporters scrambling to fill barges on U.S. waterways. The result has been a shift in U.S. corn basis patterns as well as a strong inversion in Chicago Board of Trade corn futures prices.
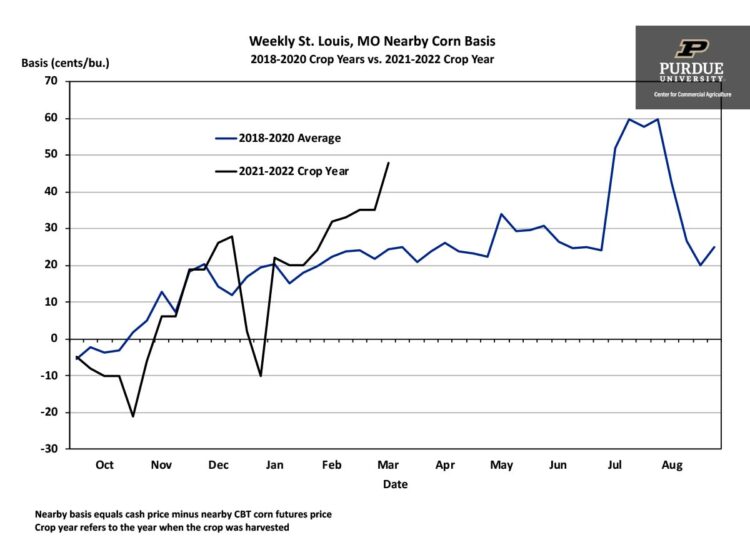
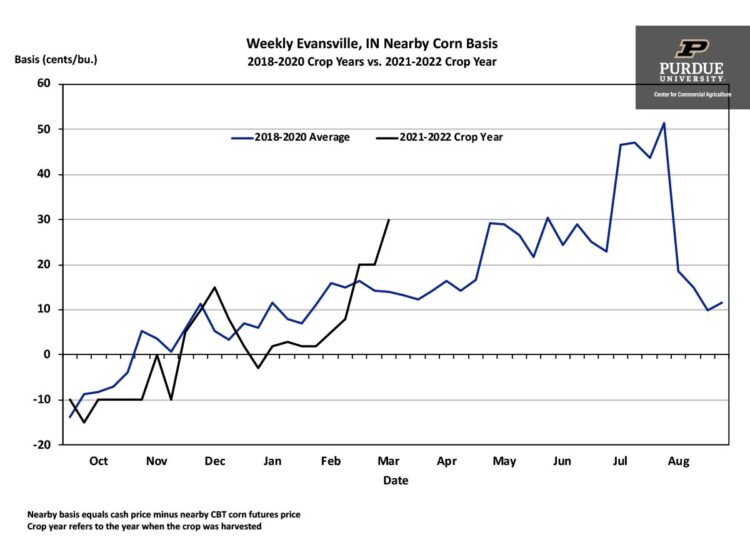
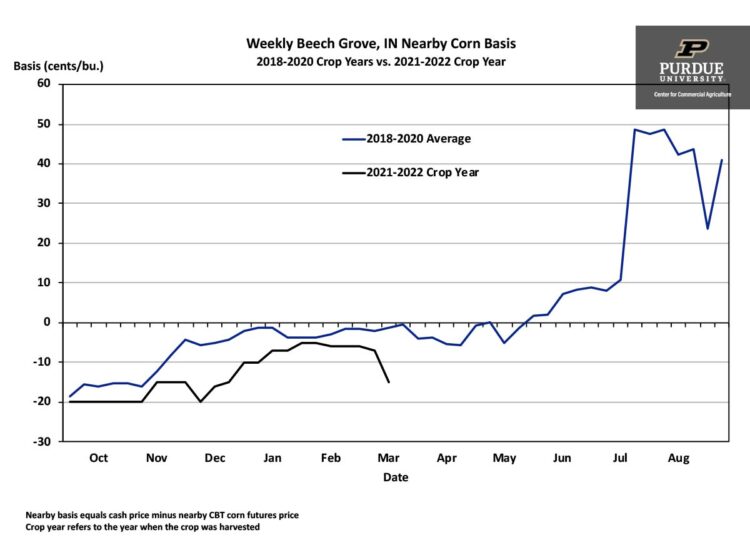
Corn basis levels at river terminals rose sharply in recent days in response to exporters’ needs. For example, nearby corn basis on the Mississippi at St. Louis, Missouri ranged from +$0.20 to +$0.24/bushel during January. Nearby basis started to strengthen in February ranging from +$0.32 to +$0.35/bushel before jumping to +$0.48/bushel the first week of March. Nearby corn basis at Evansville, Indiana on the Ohio river was relatively flat during January and the first half of February, ranging from +$0.02 to +$0.08/bushel before climbing to +$0.30/bushel in early March. The strengthening corn basis at river terminals stands in sharp contrast to what’s been taking place at inland terminals not well suited to help fill short-term export needs. For example, nearby corn basis at Beech Grove, Indiana near Indianapolis weakened, dipping $0.08 to -$0.15 in early March compared to -$0.07/bushel the last week of February.
In addition to shifting basis patterns, evolving trade disruptions have altered corn futures price spreads. Typically, deferred futures contract prices within a crop year trade at a premium to nearby futures contract prices to provide an incentive for some inventory holders to continue storing a portion of the crop until the next harvest. The premium of the deferred contract over nearby futures prices is referred to as the carry since it provides an incentive to carry forward some inventories. However, in years when crop supplies are tight, or there is a production shortfall, futures prices sometimes become inverted with nearby futures prices trading at a premium to deferred prices. The inversion provides a market signal that supplies are more highly valued now than in the future. And that is exactly what has happened in the corn futures market.
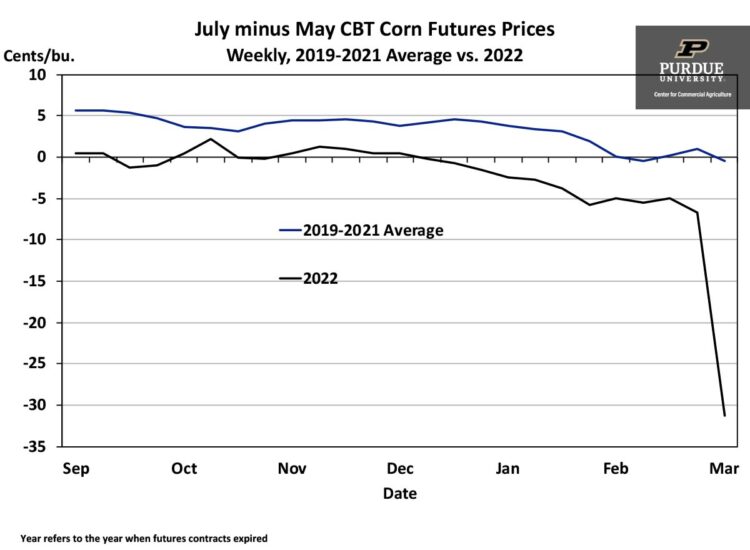
Looking at how the spread between July and May CBT corn futures (July futures price minus May future price) has shifted makes clear that the corn futures market is signaling that corn is needed sooner rather than later in the crop year. The July Minus May CBT Corn Futures Prices chart illustrates the average relationship between these two futures contracts prices for contracts that expired in 2019, 2020 and 2021 vs. what’s been taking place for the contracts that will expire in 2022. July usually trades at a premium to the May contract as indicated by the three-year average. Going back to the beginning of the 2021 crop year in September, the premium of July over May was unusually small and actually inverted in December. The inversion widened modestly in February as crop production problems in South America unfolded and then jumped by $0.25/bushel following Russia’s invasion of Ukraine.
How should corn producers respond to the current market situation? Producers in locales where corn basis is unusually strong should consider moving corn at these favorable basis levels. Basis levels can be secured using either basis contracts or cash sales. Basis contracts leave producers open to changes in futures prices whereas cash sales effectively lock in both the basis and futures price simultaneously. Recognize that futures prices will be very volatile for the remainder of this crop year as the market continues to absorb the implications of shifting world trade patterns, possible production shortfalls in South America and spring planting decisions and progress in the U.S.
TAGS:
TEAM LINKS:
RELATED RESOURCES
UPCOMING EVENTS
December 1 & 8, 2025
Join Purdue Extension for a two-part workshop designed to help you gain a clearer understanding of tax planning essentials. The first session on December 1 will focus on the fundamentals of farm taxes, with particular emphasis on strategies that can be used in a low net income year. The second session on December 8 will focus on key tax strategies and will allow plenty of time for questions. Registration cost is only $20.
Read MoreDecember 15, 2025
This program provides in-depth coverage of agricultural and farm tax issues. In addition to covering timely tax issues, we will cover disaster tax issues, depreciation and expensing farm assets, retirement planning for farms, and tax planning in low-income years. This year’s webinar will be co-taught by a team from Ohio State and Purdue Universities.
Read MoreJanuary 27 or 28, 2026
Farm Shield is more than a conference, it’s a commitment to helping agricultural families build resilience and plan for a secure future. Don’t miss this opportunity to protect your legacy!
Read More