November 1, 2022
Feed Cost Indices for Laying Hens in 2023
by: Michael Langemeier


This article discusses recent trends in feed costs for laying hens. A ration consisting of corn, soybean meal, dry distillers’ grain, soybean oil, and supplements was used to create the feed cost indices. Corn prices represent averages for Indiana as reported by USDA-NASS. Soybean meal and distillers’ grain prices were obtained from Feed Outlook, published monthly by USDA-ERS. Information from Agricultural Prices, a monthly USDA-NASS publication, was used to compute soybean oil and supplement prices. Future prices for corn and soybean meal in early November were used to project feed cost indices through 2023.
Figures 1 and 2 report monthly corn and soybean meal prices from January 2007 to September 2022. The period starting in 2007 is often thought to be a new price regime. Corn price averaged $4.65 per bushel from 2007 to the current month. Soybean meal price averaged $357 per ton from 2007 to the current month. Recent corn and soybean meal prices are around $7.00 per bushel and $475 per ton, respectively. Though expected to drop in 2023, corn and soybean prices will remain substantially above the long-run averages.
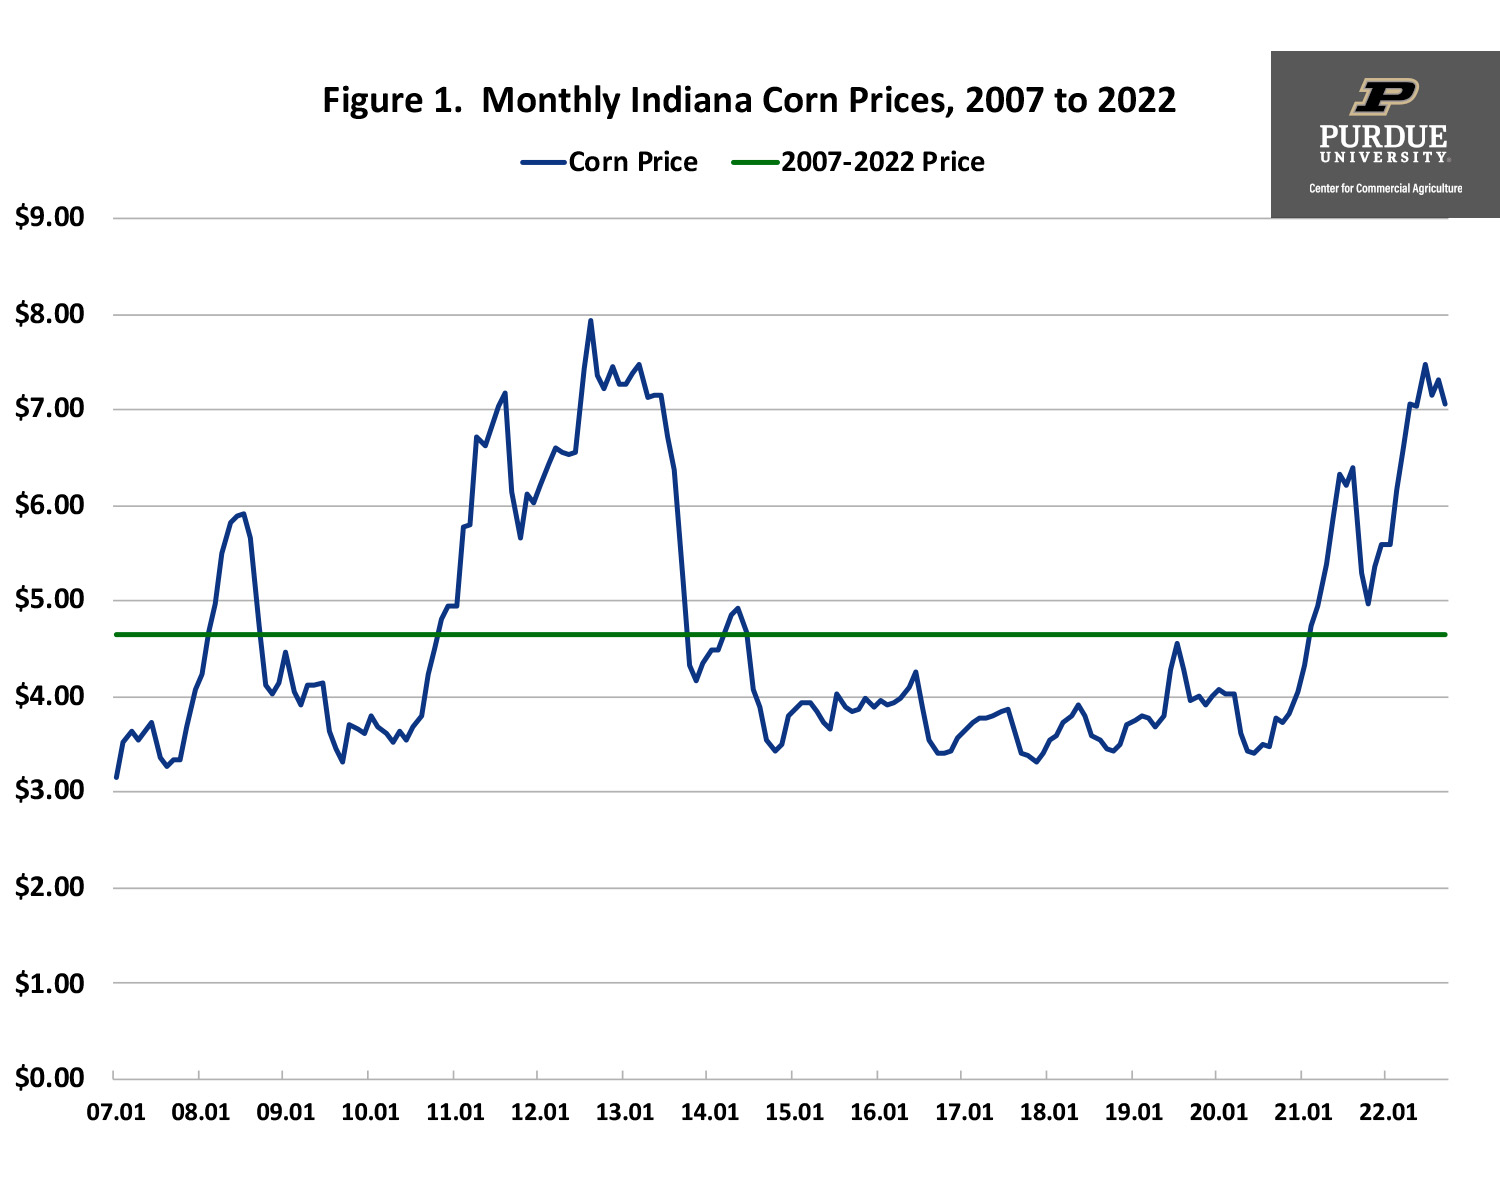
Figure 1. Monthly Indiana Corn Prices, 2007 to 2022
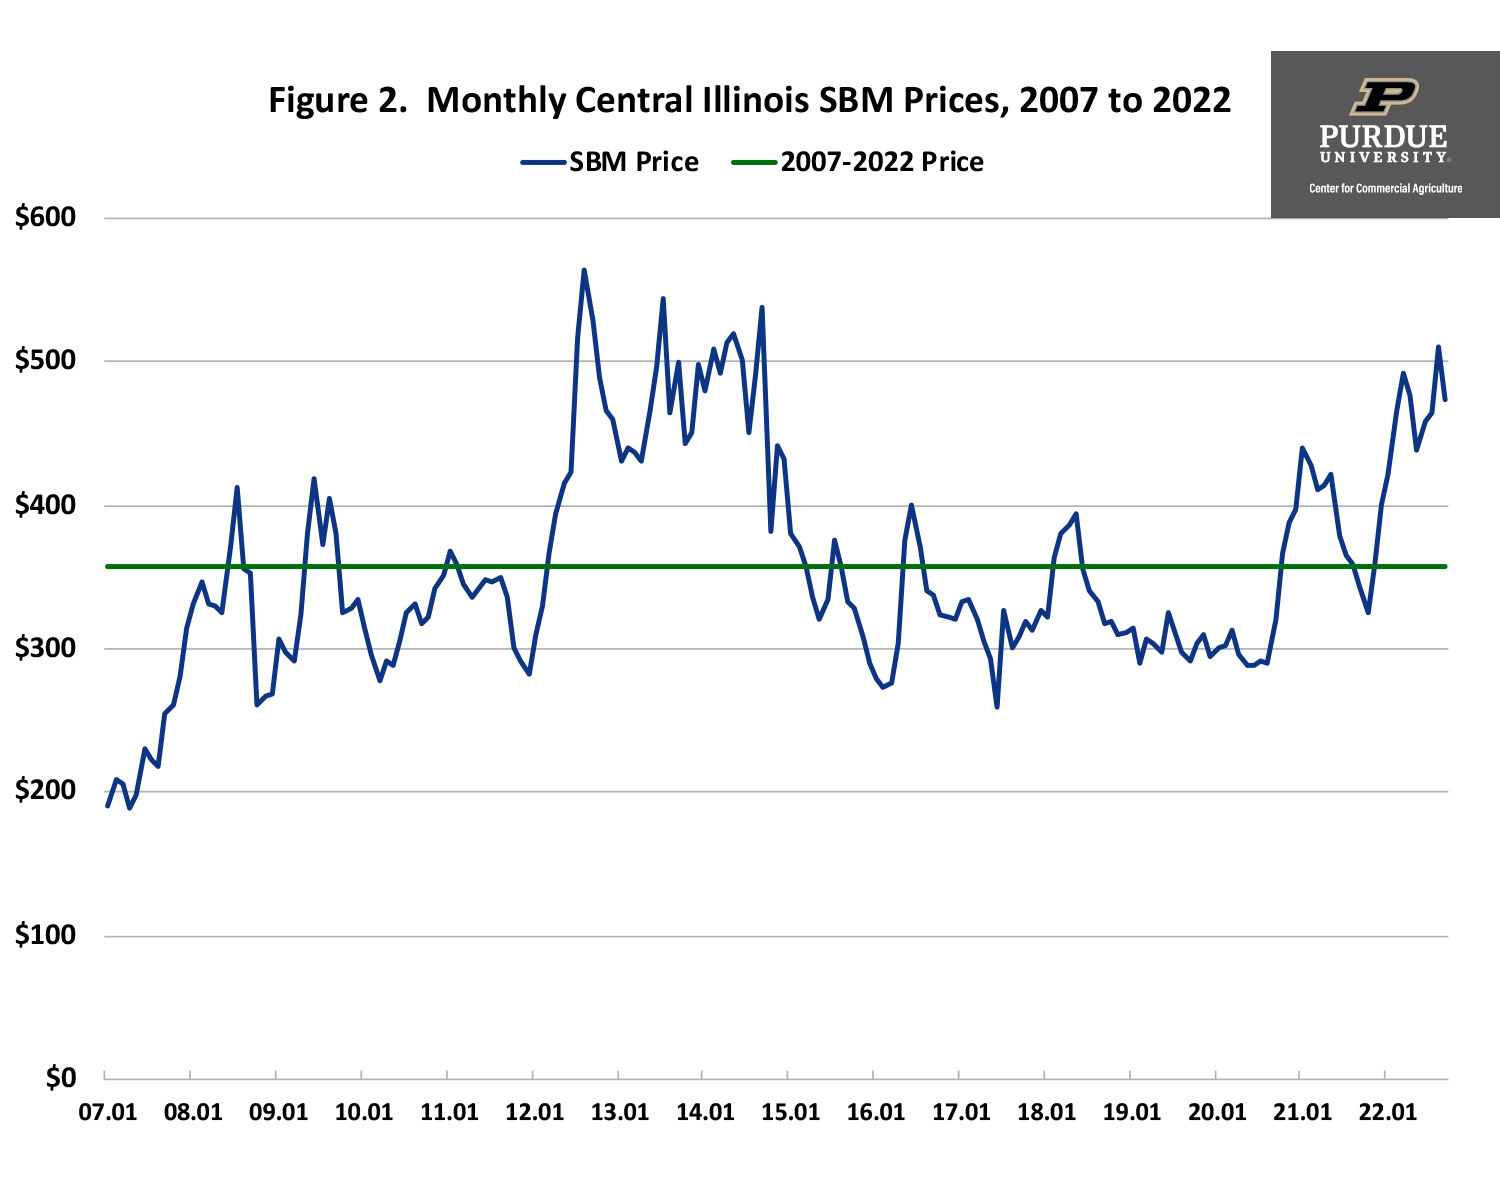
Figure 2. Monthly Central Illinois SBM Prices, 2007 to 2022
Figure 3 presents monthly feed cost indices for laying hens from January 2007 to October 2022. The latest full year of indices, 2021, has an index of 100 so all indices outside of this year are expressed in relative terms. The average index from 2007 to the current month was 87.3. The projected index for 2022 is 122.2. The feed cost index is expected to range from 118 to 120 in the first two quarters of 2023, from 115 to 118 in the third quarter, and from 110 to 112 in the fourth quarter.
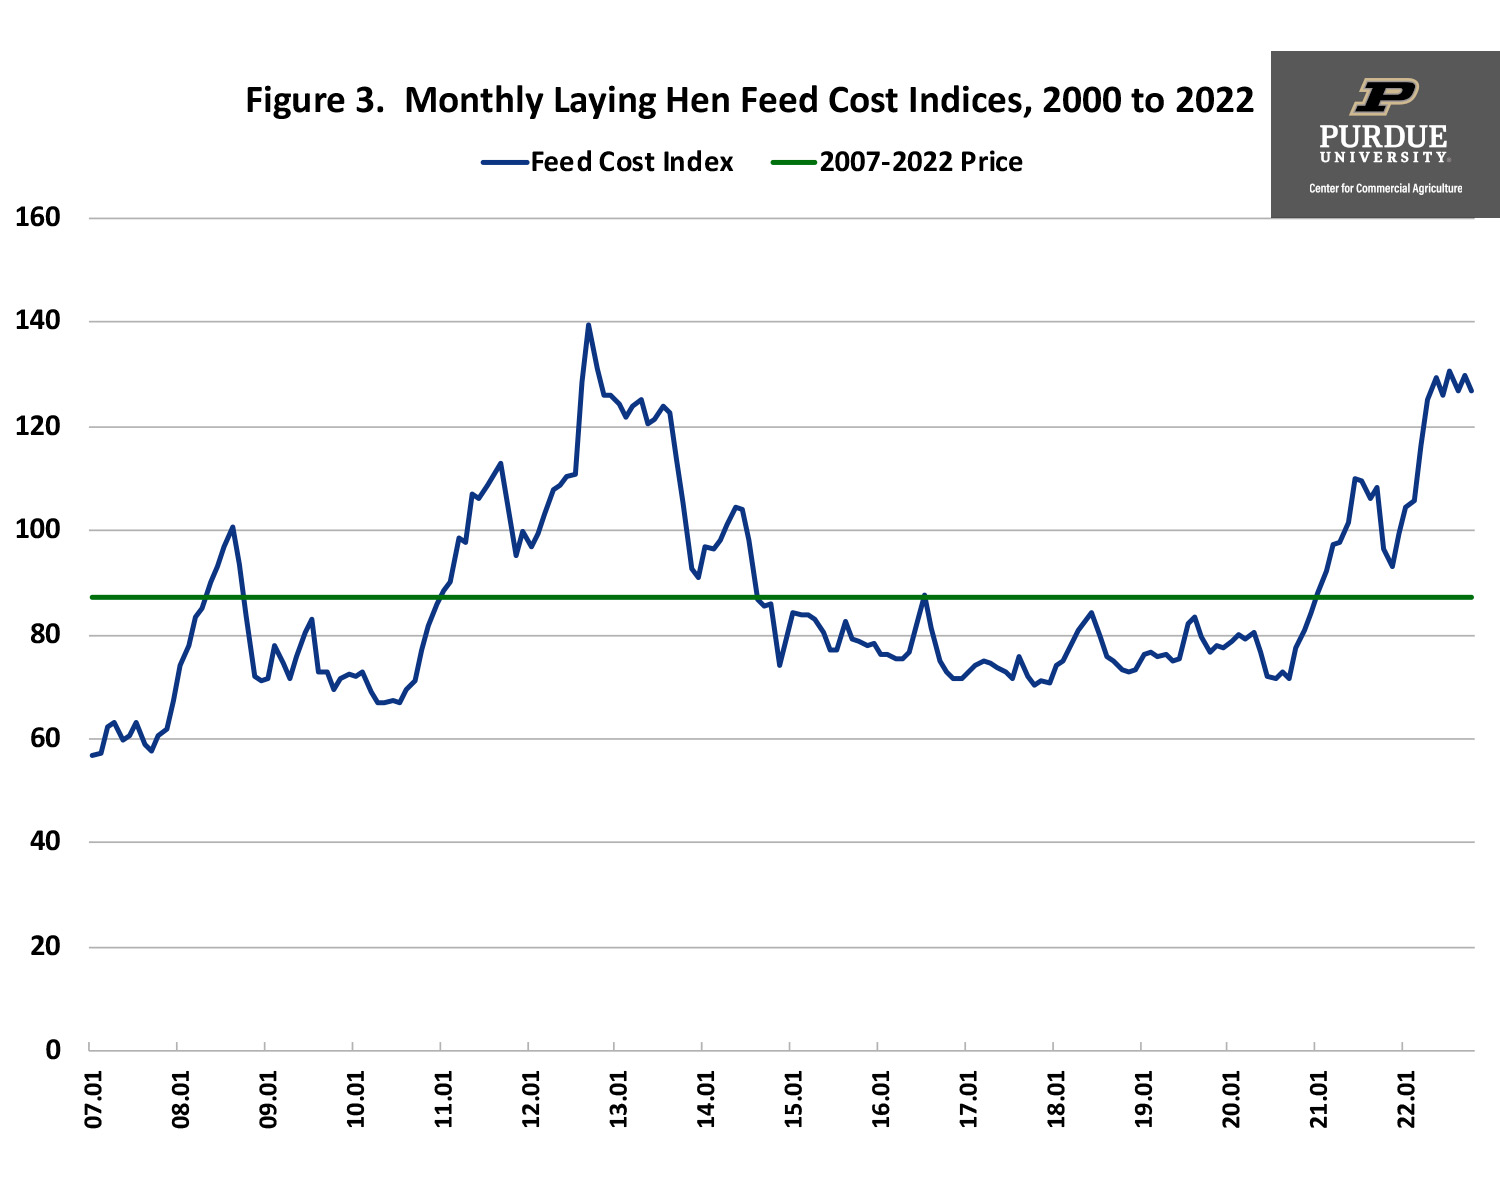
Figure 3. Monthly Laying Hen Feed Cost Indices, 2000 to 2022
Annual feed cost indices for laying hens are presented in figure 4. The projections for 2022 and 2023 (red bars) used corn and soybean meal futures prices in early November. The projected feed cost index for 2023 is 116.3 which is 4.8 percent below the average index for 2022, but 16.3 percent above the index for 2021. Of course, there is a lot of uncertainty regarding 2023 feed prices. If corn prices remained at the current levels, the average feed cost index for 2023 would be 5 to 10 percent higher than the current projected feed cost index (i.e., 116.3).
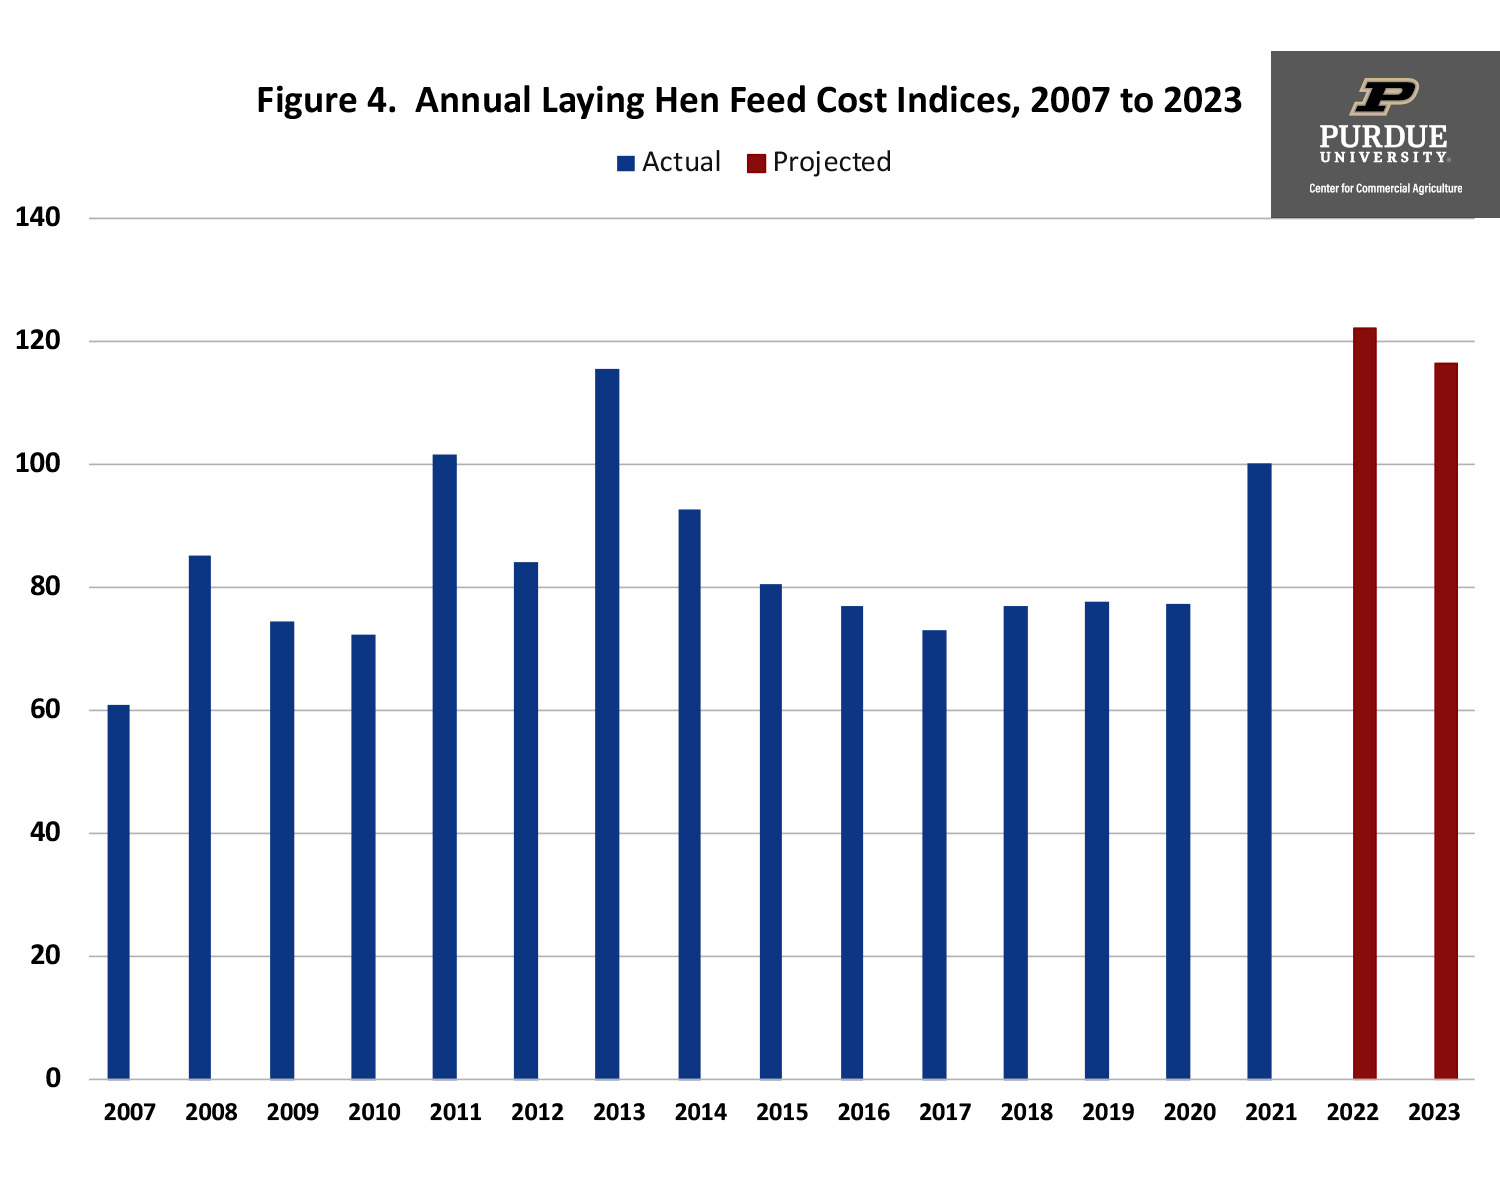
Figure 4. Annual Laying Hen Feed Cost Indices, 2007 to 2023
This article discussed recent trends in feed costs for laying hens. Current projections suggest that feed costs for 2023 will be slightly lower than those experienced in 2022. Feed costs are expected to be higher in the first one-half of the 2023 than the in the second half of 2023. Information related to feed costs for other livestock species can be found on the web site for the Center for Commercial Agriculture (purdue.edu/commercialag).
TAGS:
TEAM LINKS:

RELATED RESOURCES
UPCOMING EVENTS
Join educators from across the Midwest to build skills for communicating soil health concepts on Nov. 4-5, 2026. In the field, we’ll evaluate the relationship between soil health and water management focusing on irrigation and edge of field practices. The in-service will have both classroom and on farm demonstrations.
The Land of Opportunity: A Conference for Farmland Owners will be held at two locations on October 5 and October 6, providing farmland owners with valuable information and resources to help them make informed decisions about their land. The conference will feature keynote presentations, educational breakout sessions, and networking opportunities designed specifically for those who own, manage, or have an interest in farmland.