February 13, 2026
What Lower Corn Prices Mean for 2026 Swine Feed Costs
by Michael Langemeier
![]()
![]()
![]()
![]()
![]()
Indiana corn prices in 2025 averaged $4.45 per bushel. The most recent WASDE report and the futures market indicate that corn prices could remain low for the foreseeable future. Using the farmdoc price distribution tool in early February, corn prices for the July 2026 futures contract at the 25th percentile, the 50th percentile, and the 75th percentile were $4.11, $4.41, and $4.73, respectively. The $4.11 price ($4.73 price) indicates that there is a 25 percent chance that the corn futures price will be below $4.11 (above $4.73) per bushel at the expiration of the July contract. Obviously, low expected corn prices will translate into relatively low feed costs. This article examines trends in feed costs as well as the impact of corn and soybean meal prices on feed costs for farrow-to-finish and swine finishing operations.
It is important to note that the swine finishing enterprise represented in this article assumes the finishing of an early-weaned pig. The rations for the farrow-to-finish and swine finishing enterprises consist of corn, soybean meal, dry distillers’ grain, and supplements. Corn prices represent averages for Indiana as reported by USDA-NASS. Soybean meal and distillers’ grain prices are obtained from Feed Outlook, published monthly by USDA-ERS. Information from Agricultural Prices, a monthly USDA-NASS publication, was used to compute supplement prices. Late January futures prices for corn and soybean meal were used to project feed indices for 2026. Feed cost indices are reported on a closeout month rather than a placement month basis.
Corn and Soybean Meal Prices
Figures 1 and 2 report monthly corn and soybean meal prices from January 2007 to December 2025. Corn prices averaged $4.71 per bushel from 2007 to the current month. Soybean meal price averaged $360 per ton from 2007 to the current month. Current corn and soybean meal prices are below the long-run averages. Futures prices suggest that corn and soybean meal prices are likely to remain below their long-run averages well into next year. The impact of these corn and soybean meal projections on feed costs is discussed below.
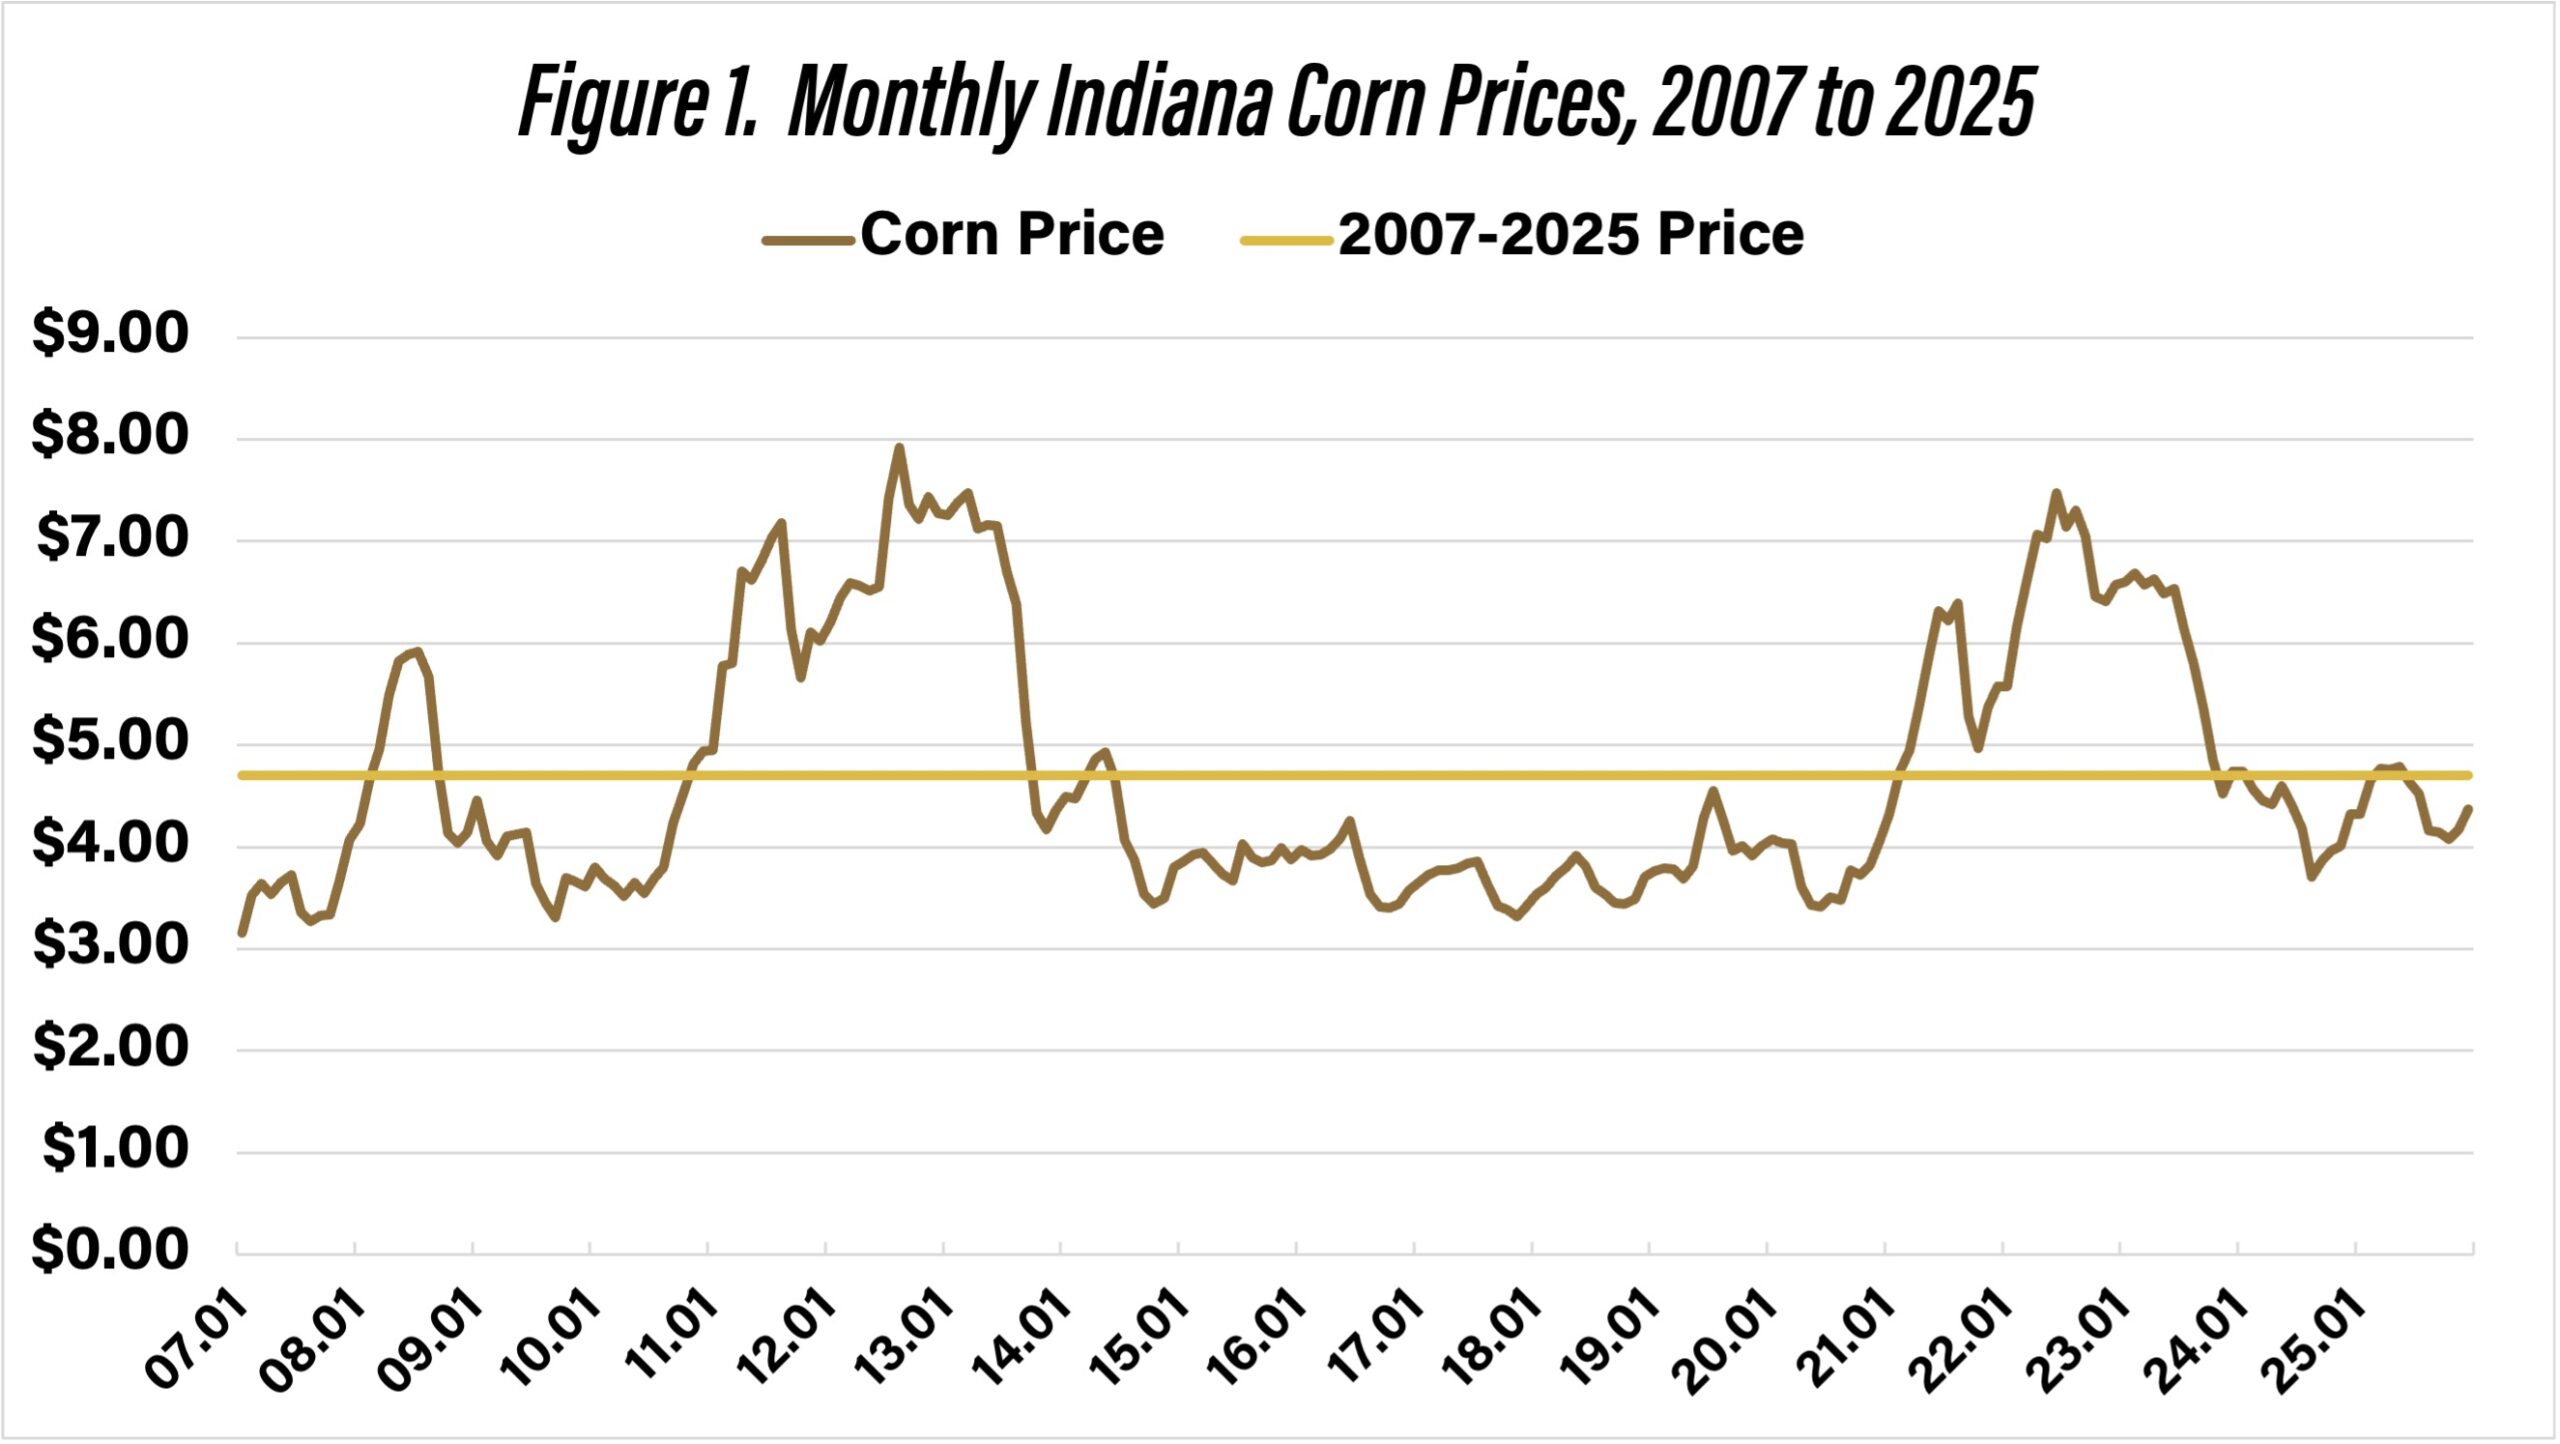
Figure 1. Monthly Indiana Corn Prices, 2007 to 2025
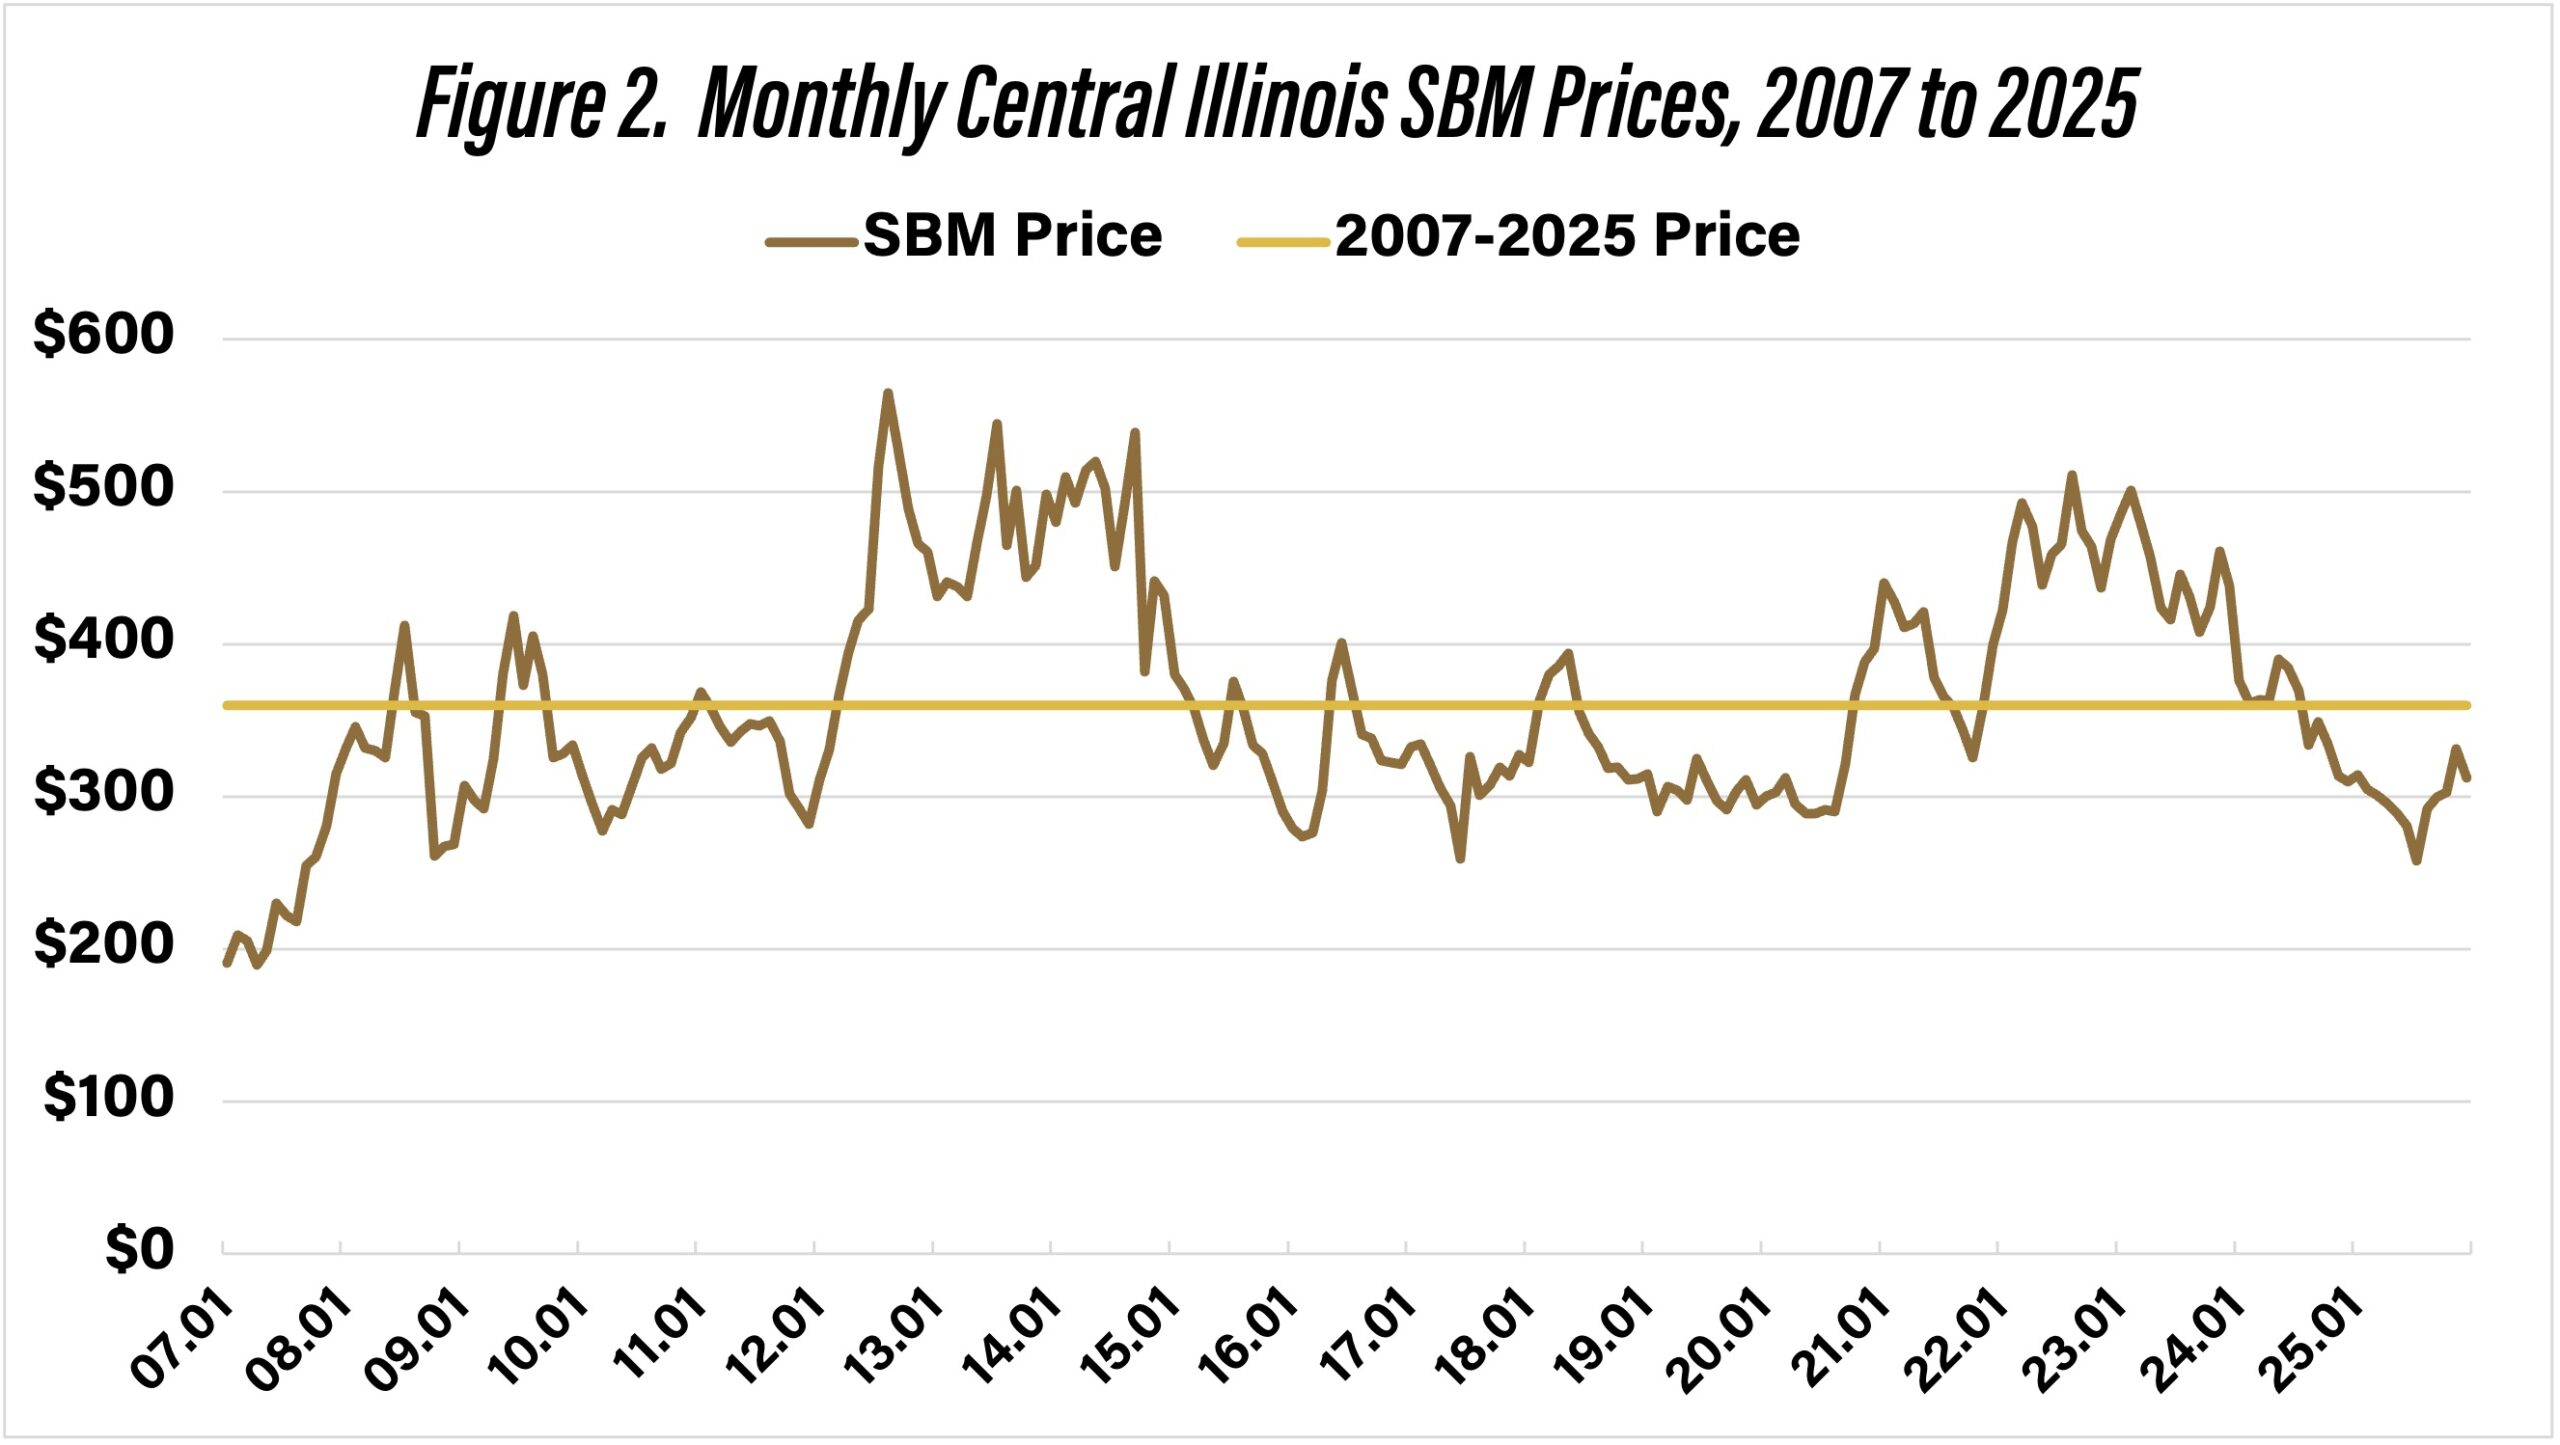
Figure 2. Monthly Central Illinois SBM Prices, 2007 to 2025
Farrow-to-Finish Enterprise
Figure 3 presents monthly farrow-to-finish feed cost indices from January 2007 to January 2026. The latest year, 2025, has an index of 100 so all indices outside of this year are expressed in relative terms. The average feed cost index since 2007 is 106.4. The projected feed cost indices for the first and second quarters of 2026 are 97.7 and 98.8, respectively. The feed cost index is projected to increase from 98.8 in the second quarter to approximately 99 in the third and fourth quarters.
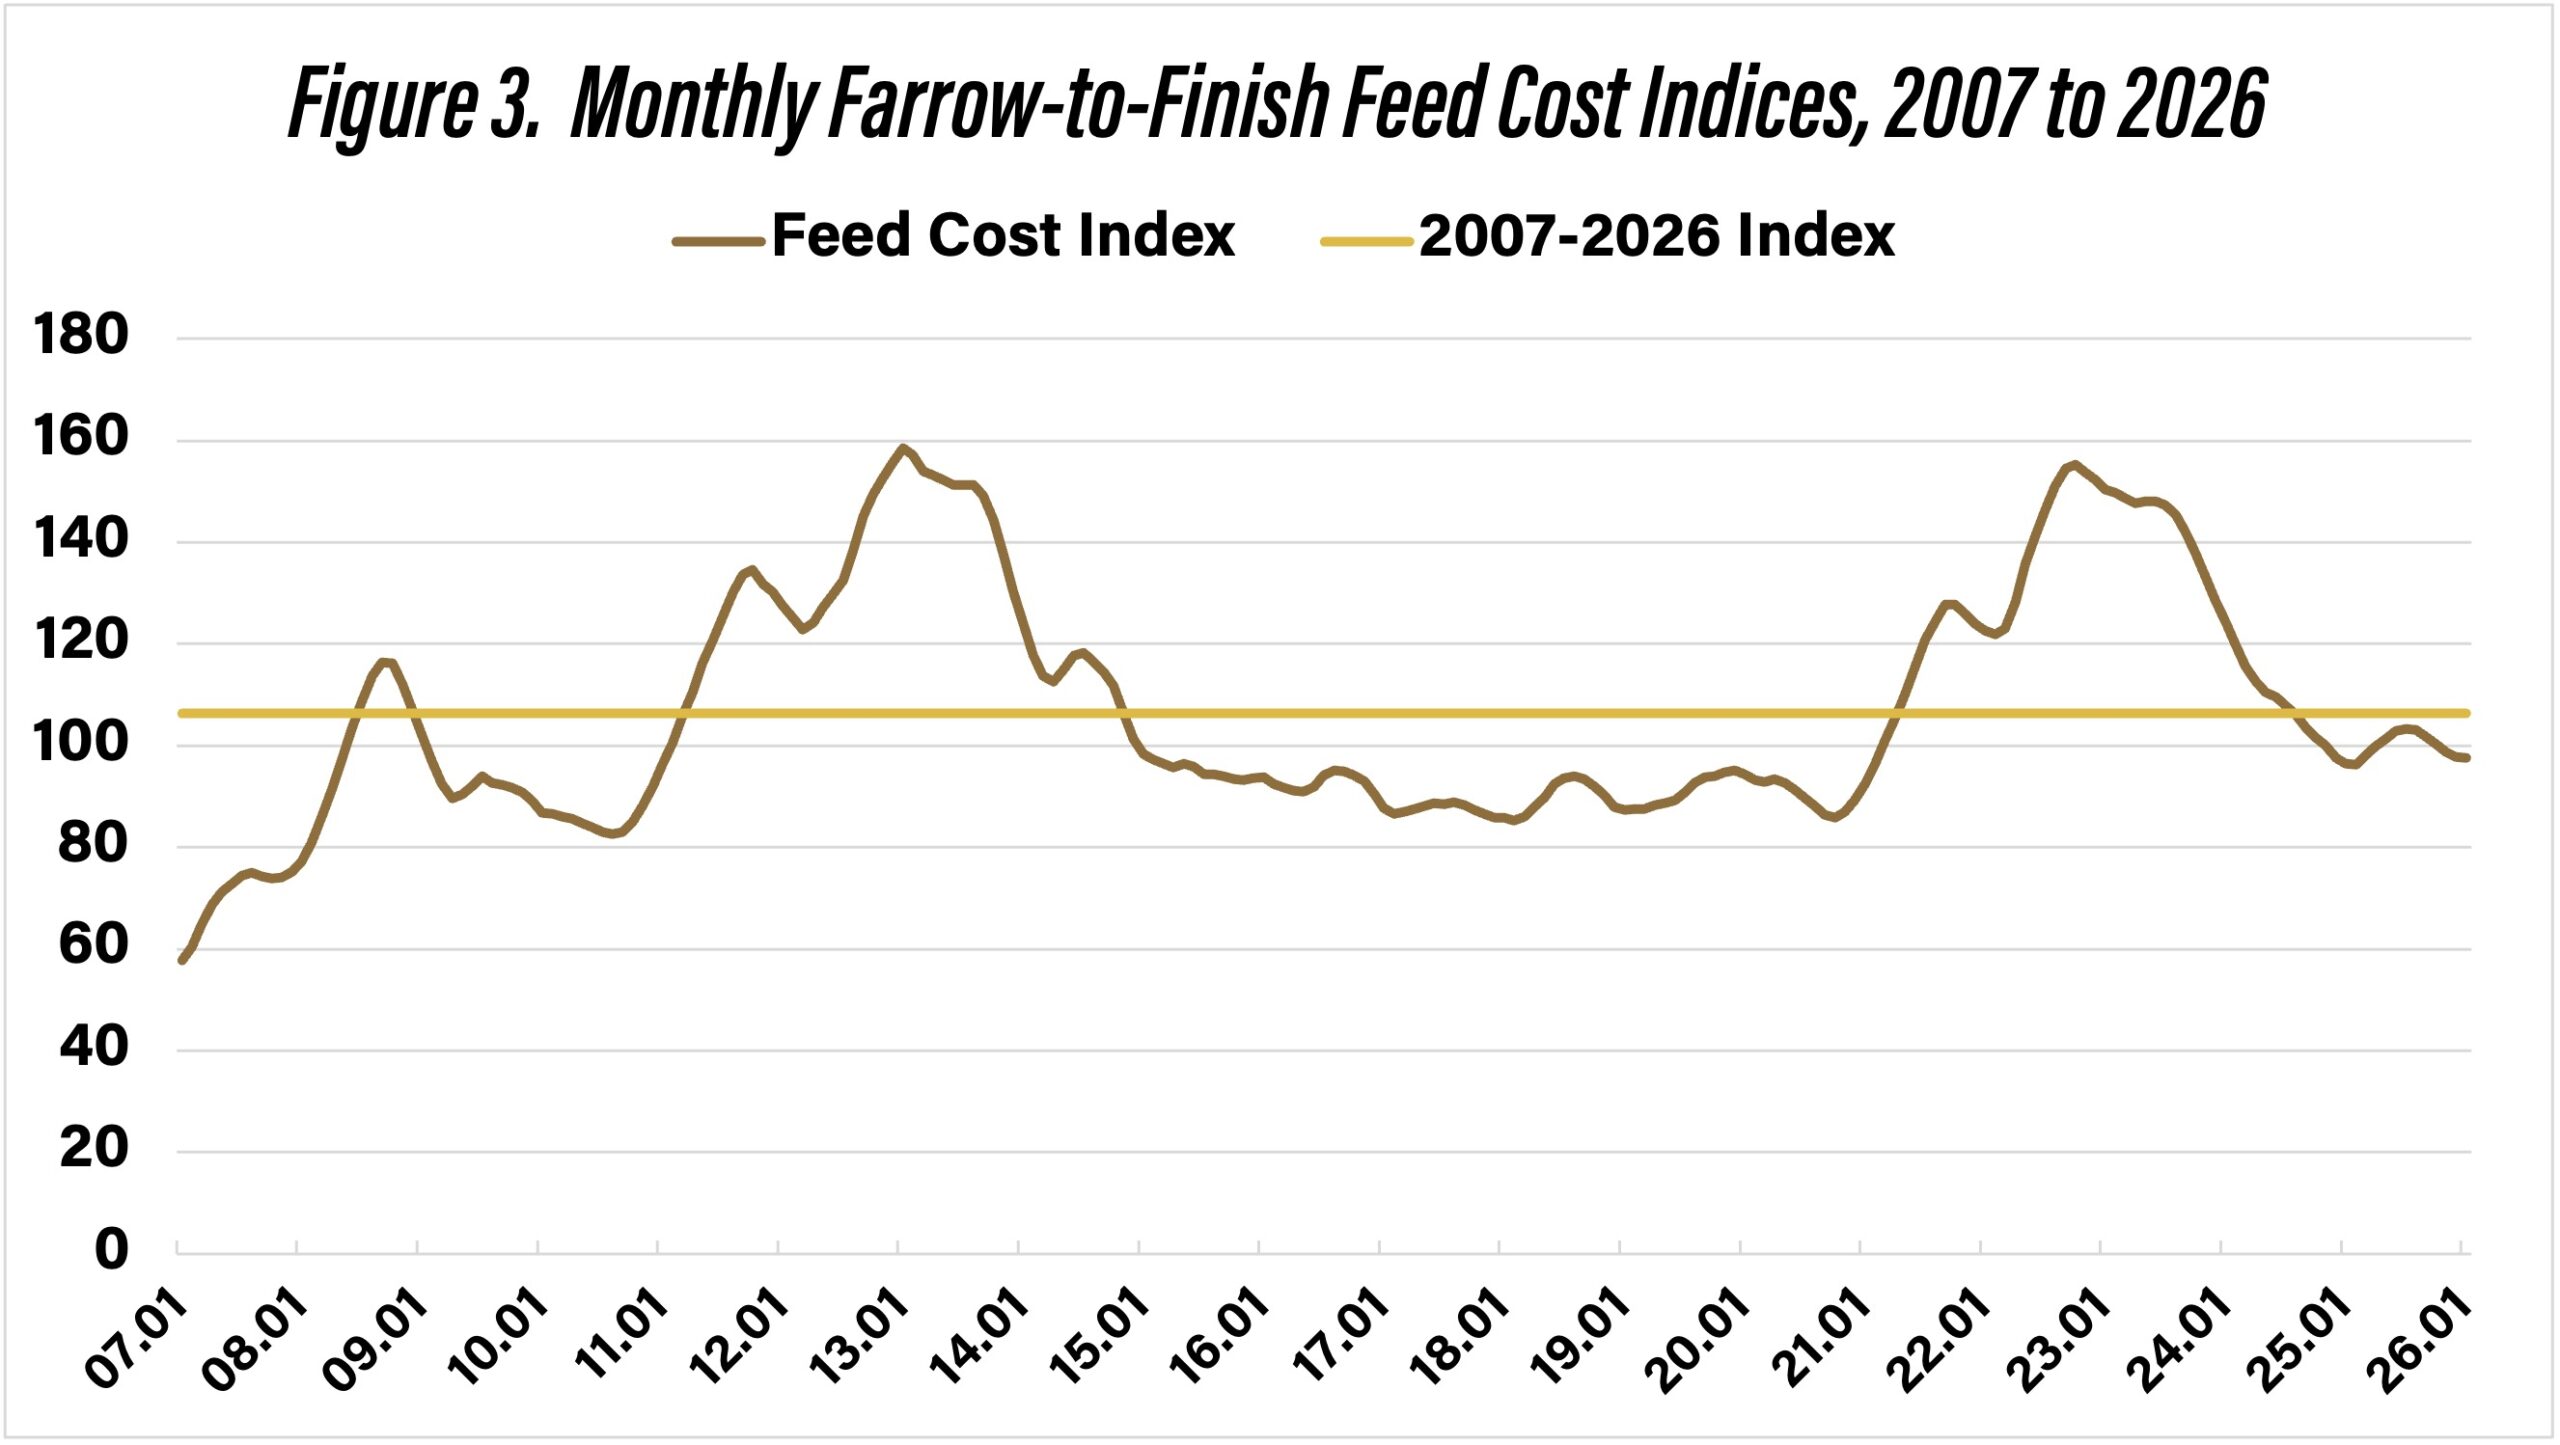
Figure 3. Monthly Farrow-to-Finish Feed Cost Indices, 2007 to 2026
Annual farrow-to-finish feed cost indices are presented in figure 4. The projection for 2026 used corn and soybean meal futures prices in late January. The projected feed cost index for 2026 is 98.8, which indicates that feed costs in 2026 are expected to be 1.2% below those experienced in 2025.
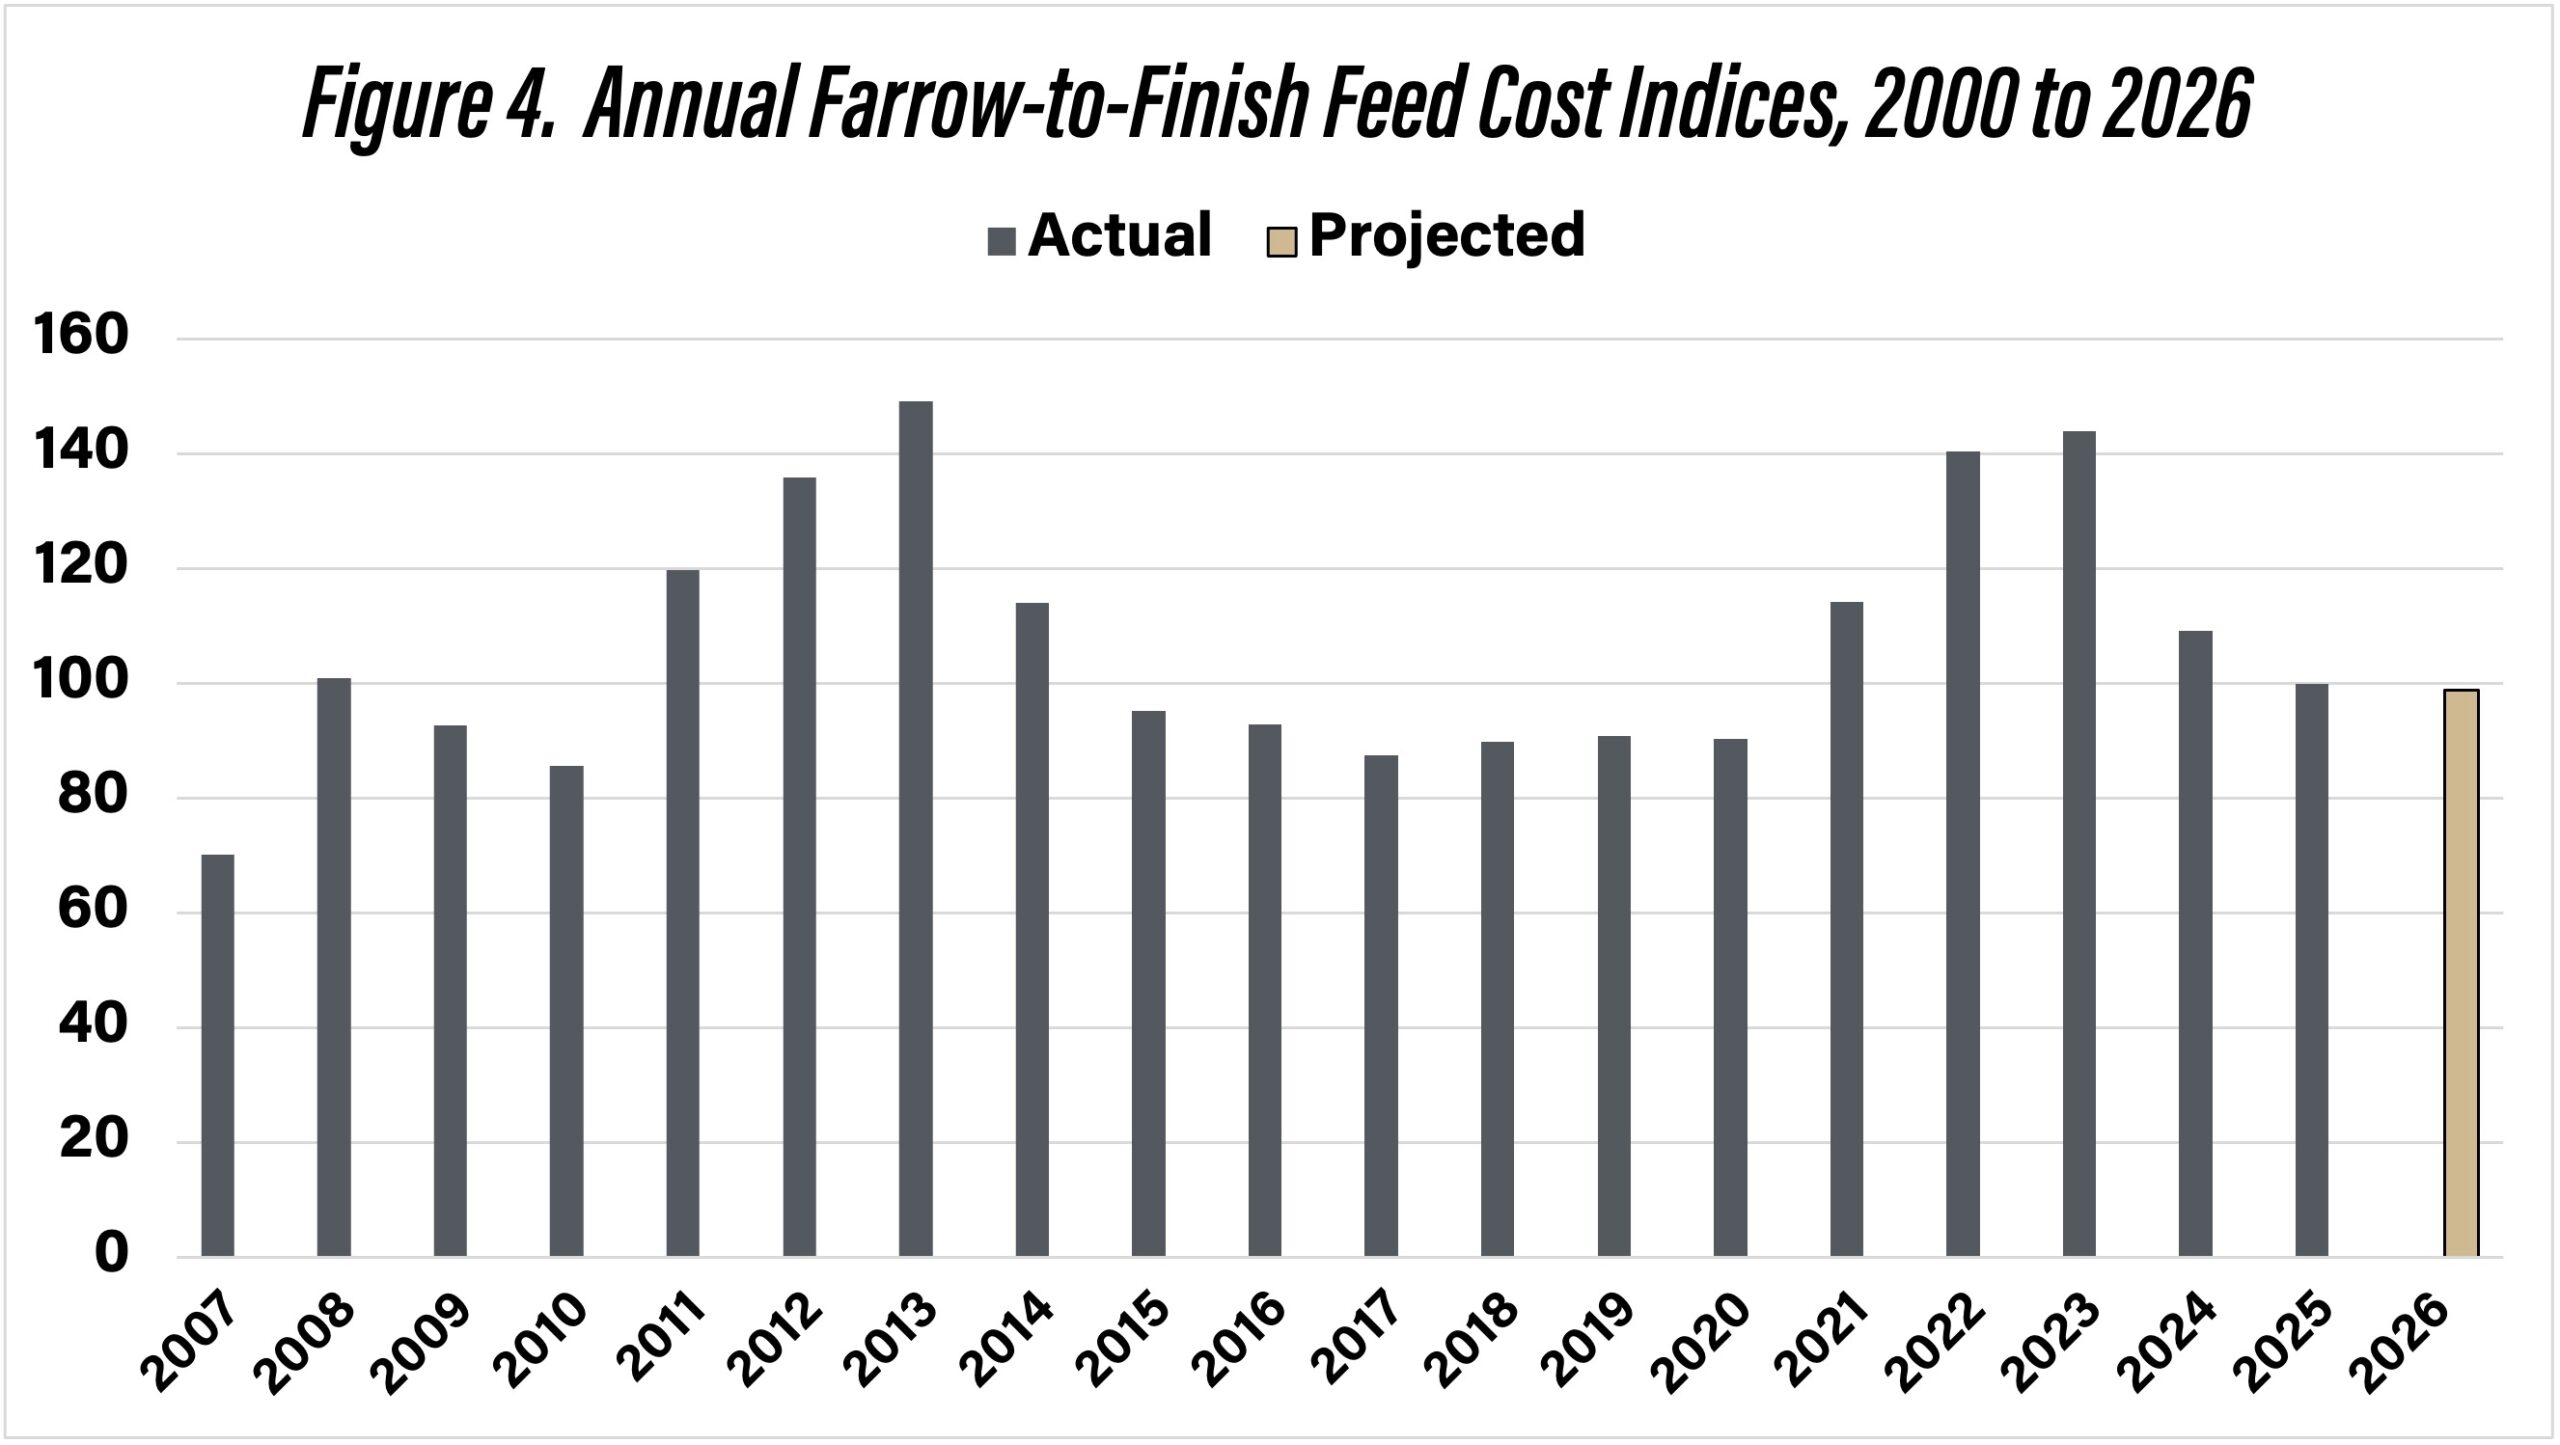
Figure 4. Annual Farrow-to-Finish Feed Cost Indices, 2000 to 2026
Swine Finishing Enterprise
Figure 5 illustrates monthly swine finishing feed cost indices for the January 2007 to January 2026 period. The latest year, 2025, has an index of 100 so all indices outside of this year are expressed in relative terms. The average index for the period beginning in 2007 is 104.6. The average index for the first and second quarters of 2026 is projected to be 98.4 and 99.3, respectively. The index for the third and fourth quarters is expected to increase slightly to 100. Annual swine finishing feed cost indices are presented in figure 6. The projection for 2026 used corn and soybean meal futures prices in early February. The expected index for 2026 is 99.3, thus, feed costs in 2026 are expected to be very similar to those experienced in 2025.
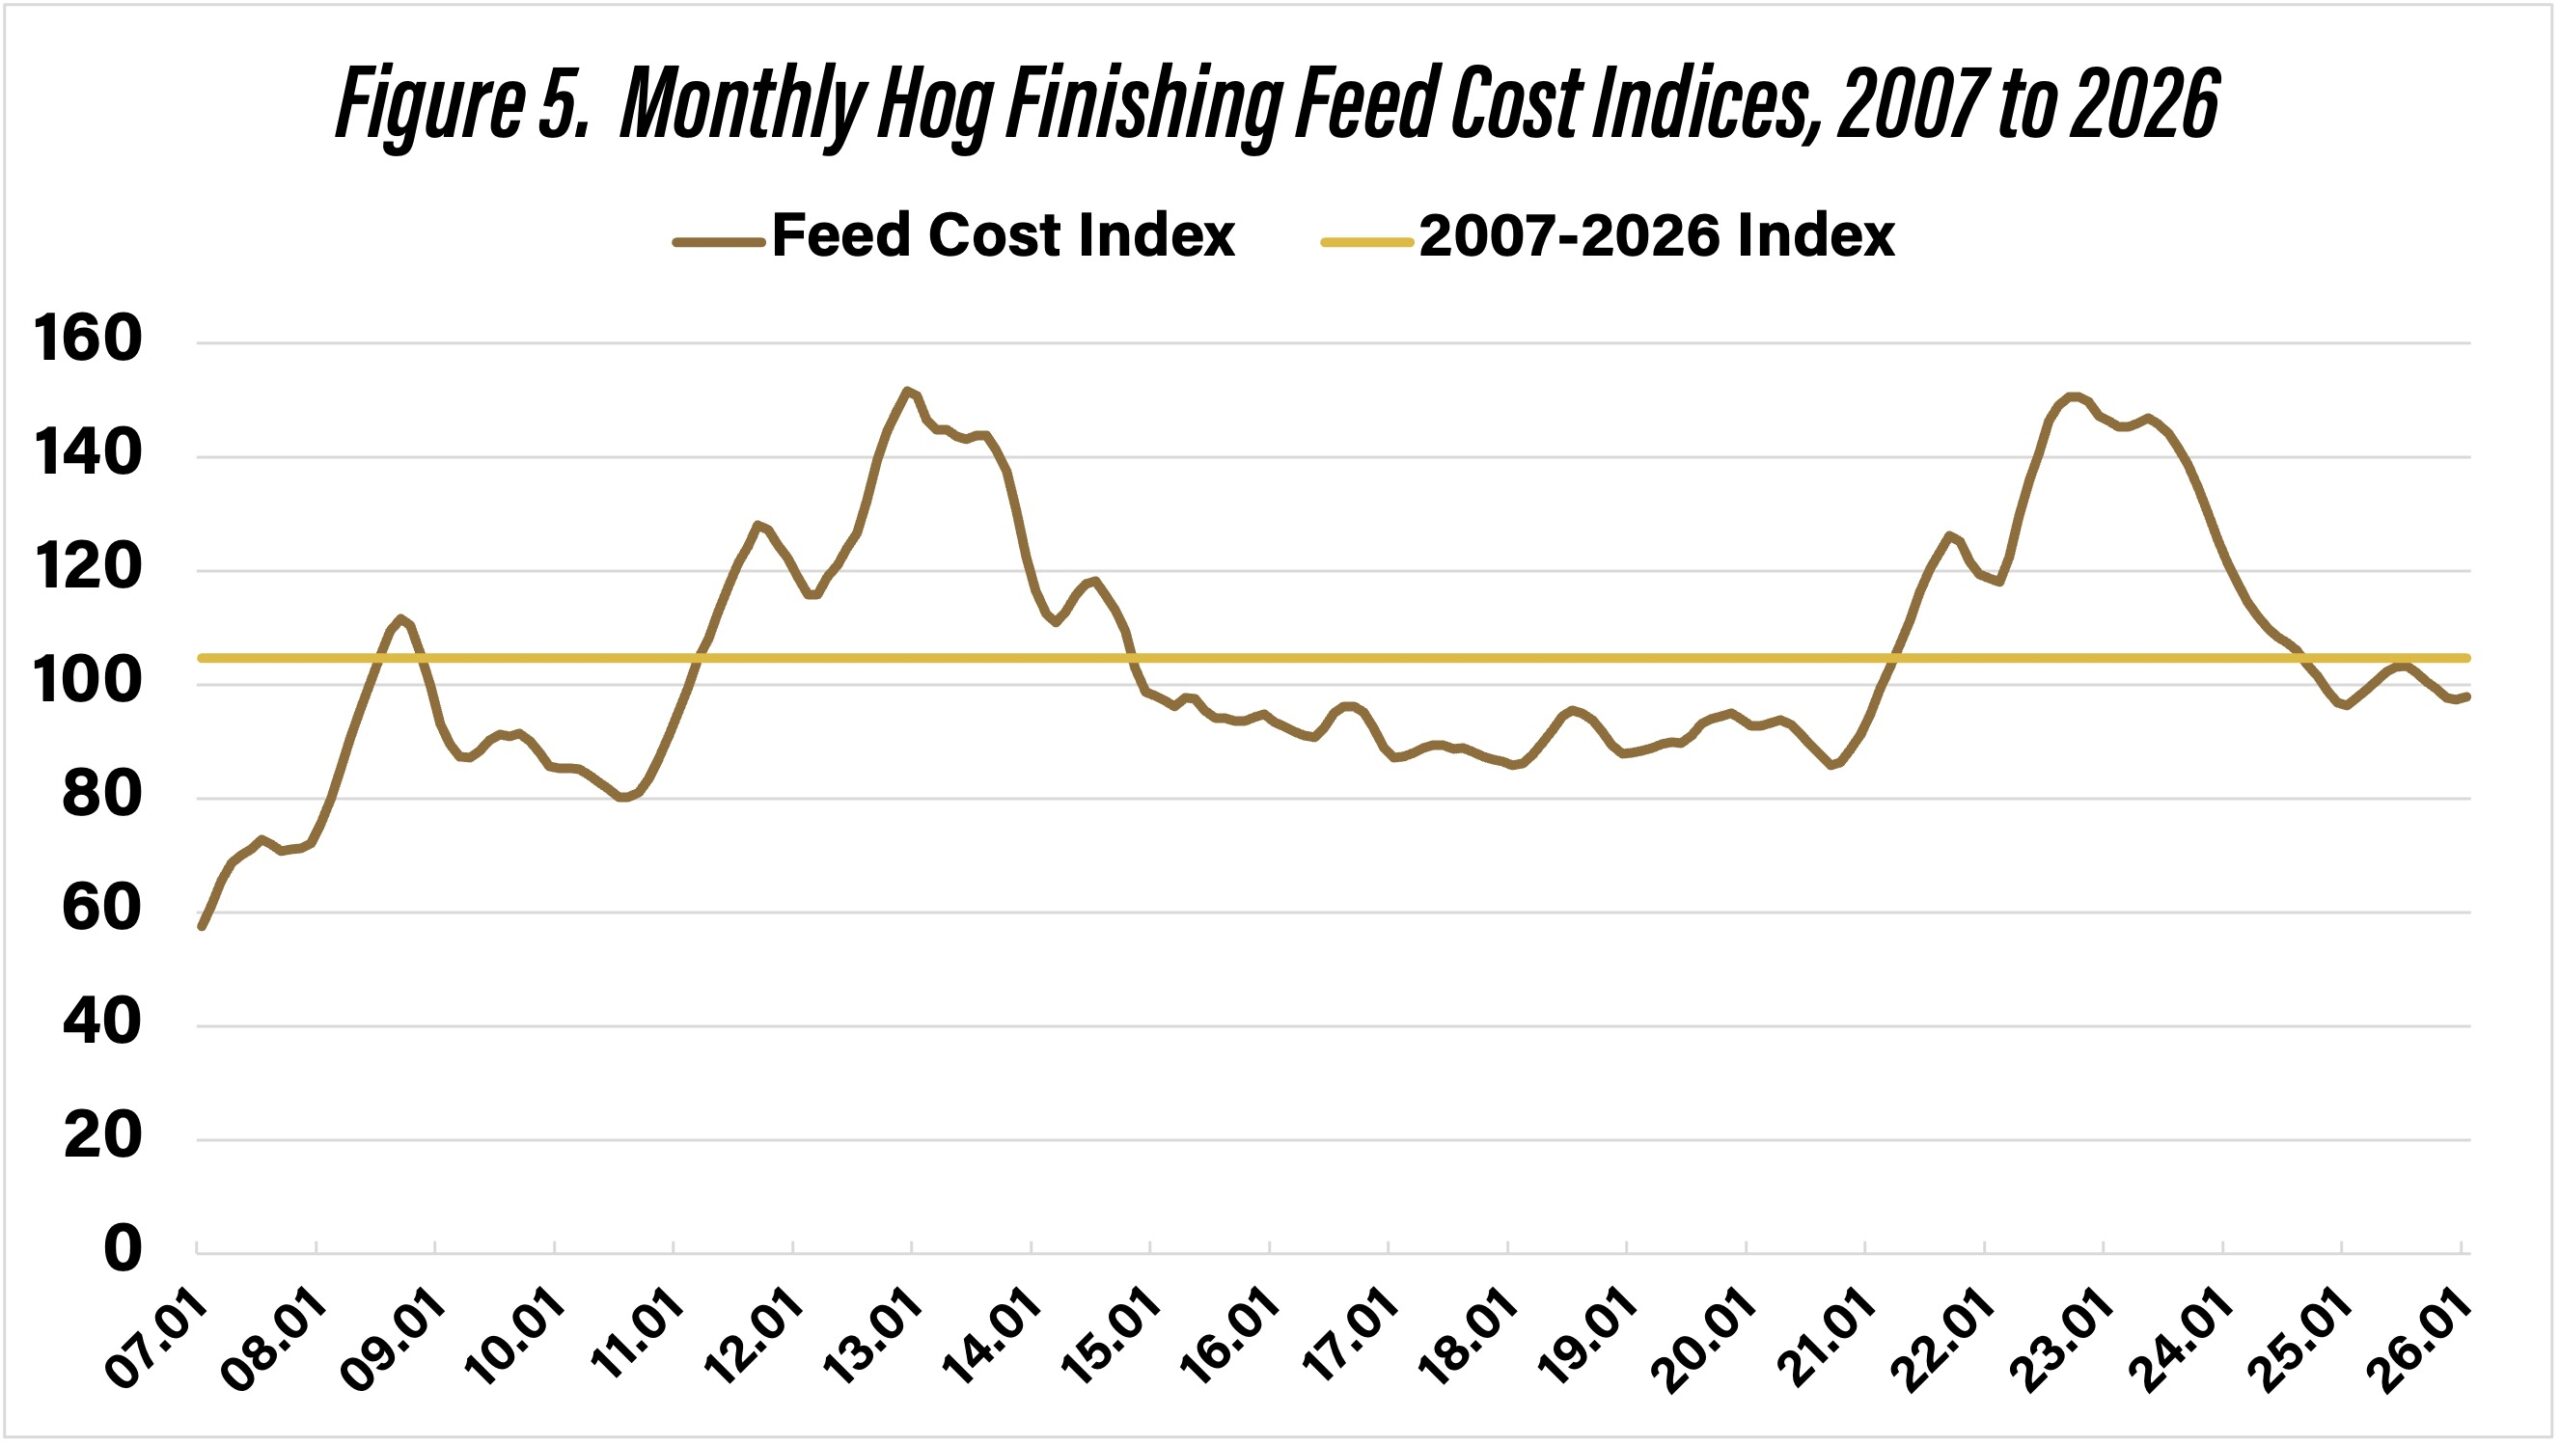
Figure 5. Monthly Hog Finishing Feed Cost Indices, 2007 to 2026
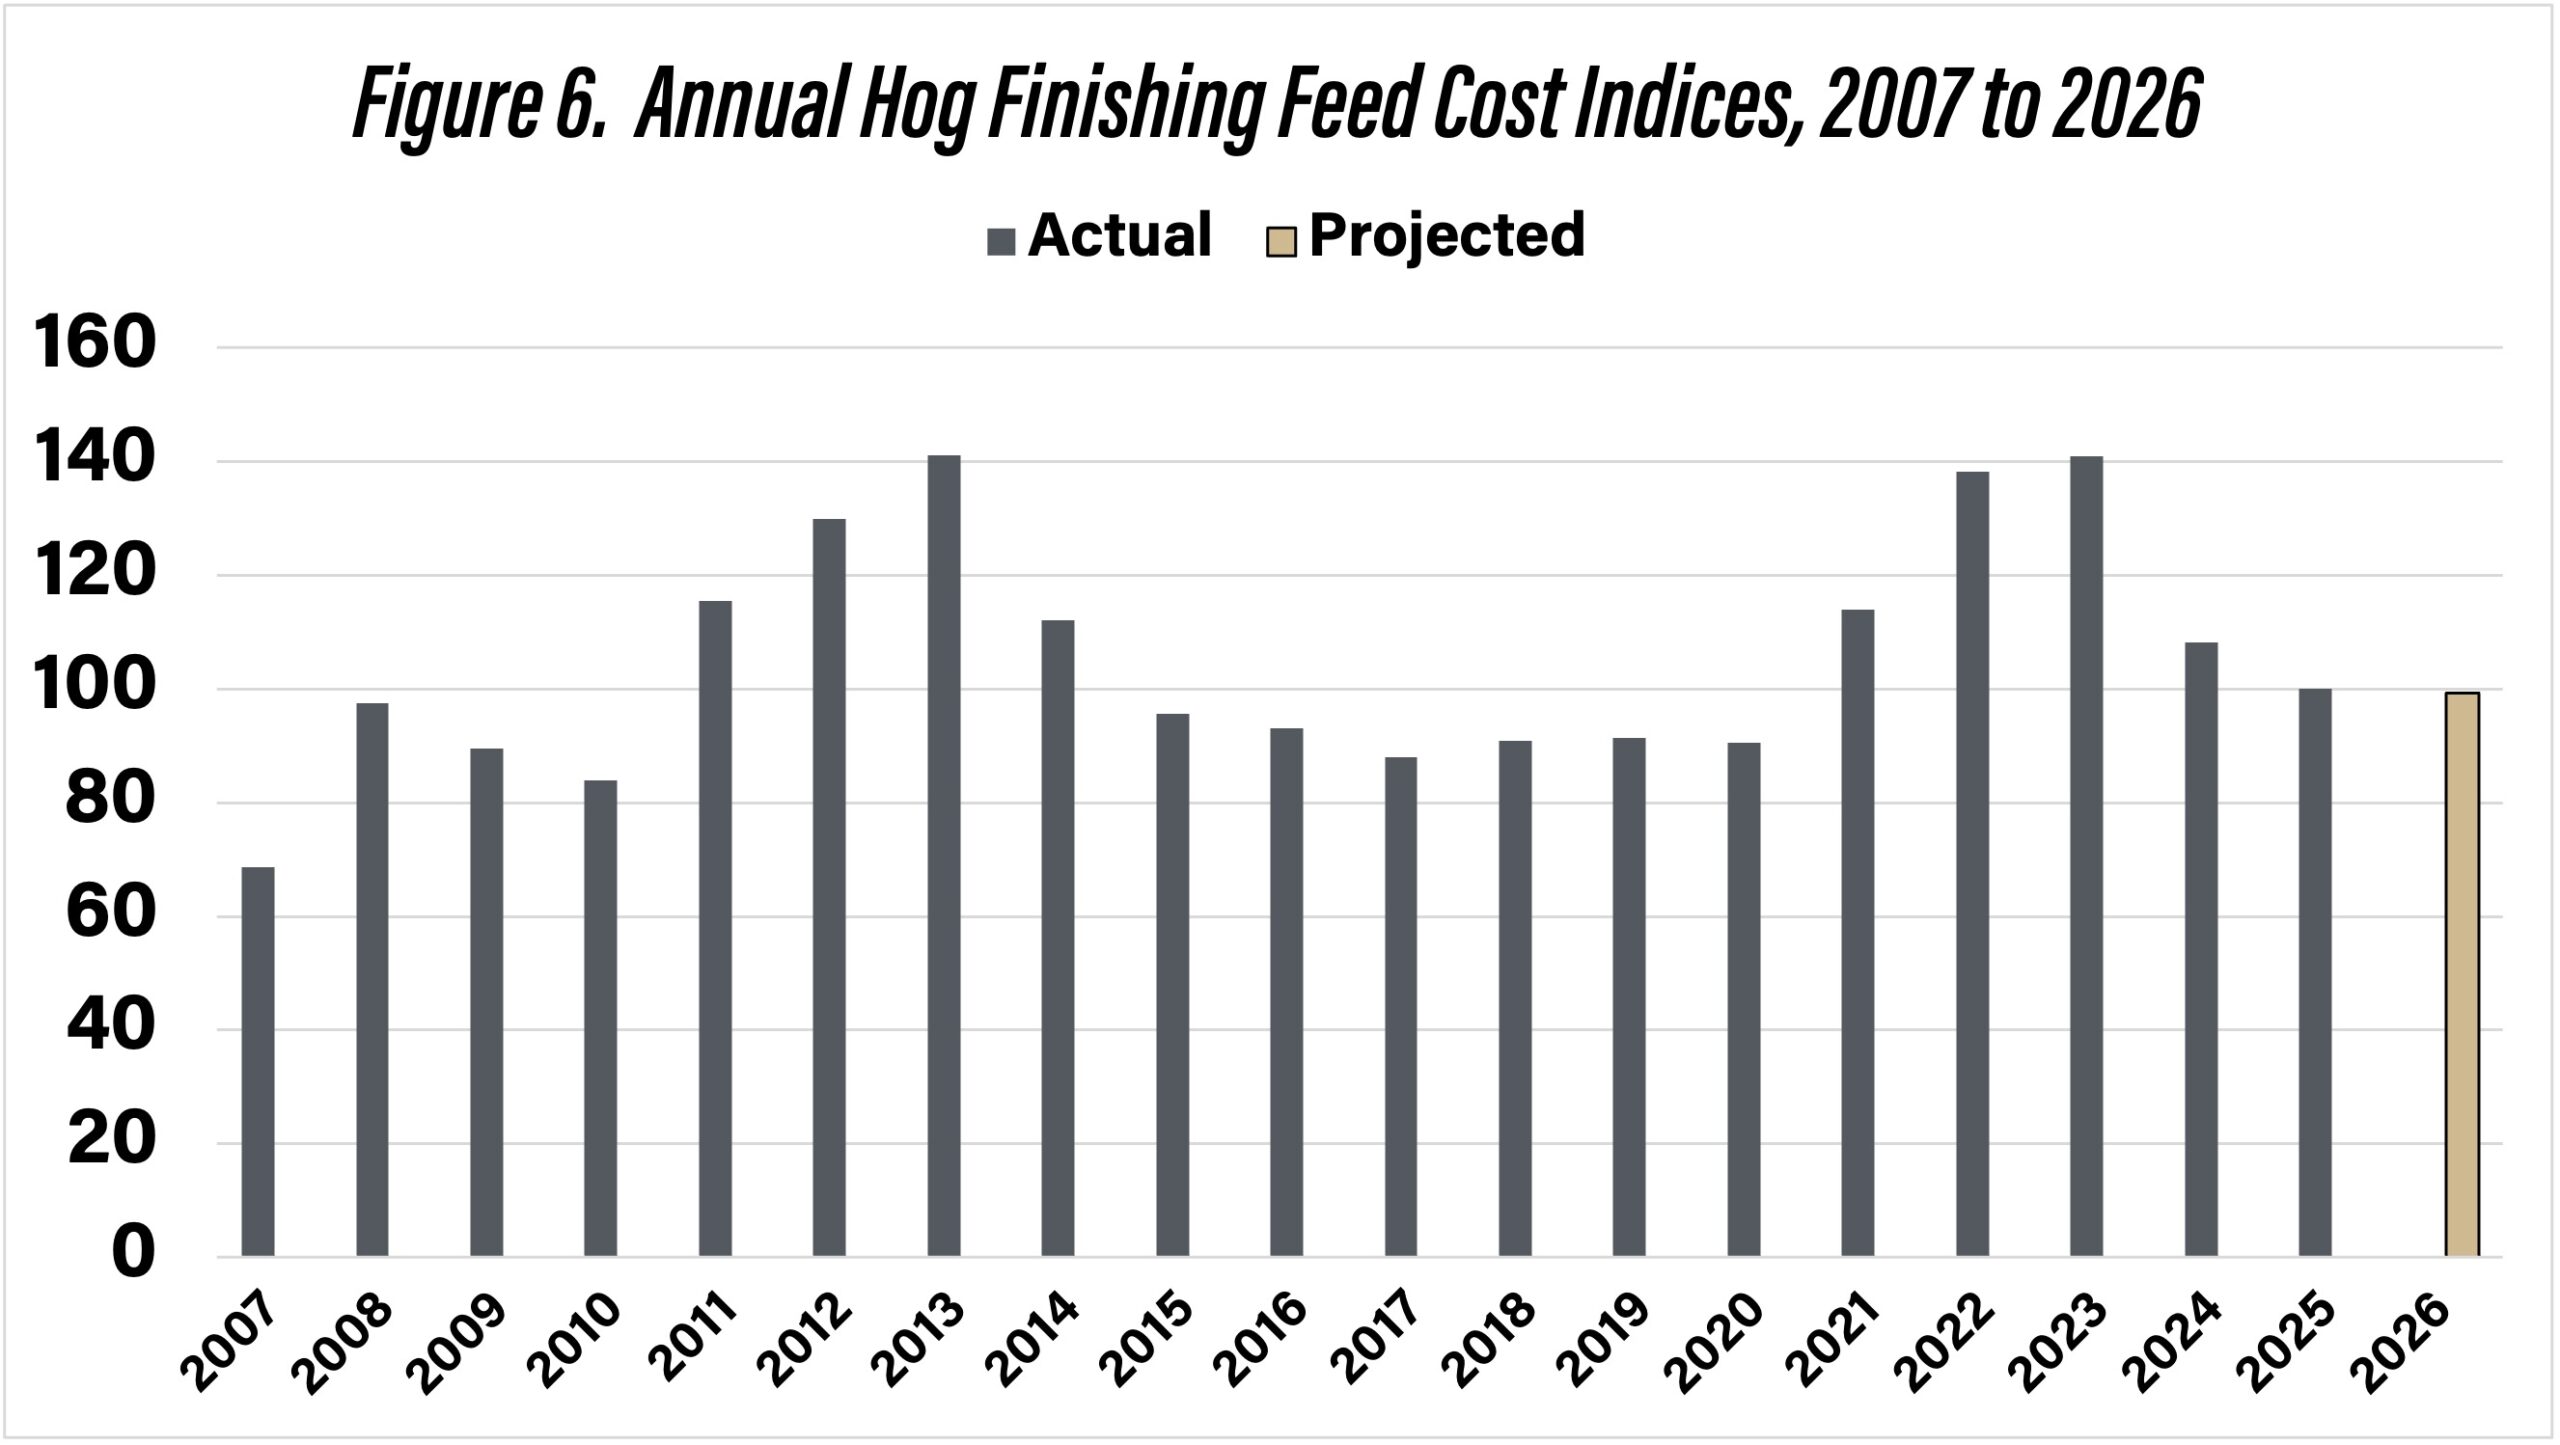
Figure 6. Annual Hog Finishing Feed Cost Indices, 2007 to 2026
Feed costs are sensitive to changes in corn and soybean meal prices. Regression analysis was used to examine the relationship between swine finishing feed cost, and corn and soybean meal prices during the January 2007 to December 2025 period. Results are as follows: each 0.10 per bushel increase in corn prices increases feed cost per cwt. by $0.43, and each $10 per ton increase in soybean meal prices increases feed cost per cwt. by $0.37.
Current feed cost is approximately $34 per cwt. Table 1 presents feed cost per cwt. for a range of likely corn and soybean prices in 2026. Corn prices range from $3.50 to $4.50 per bushel and soybean meal prices range from $275 to $375 in the table. At the lower range of prices, feed cost per cwt. would be approximately $28. At the higher range of prices, feed cost per cwt. would be approximately $36.
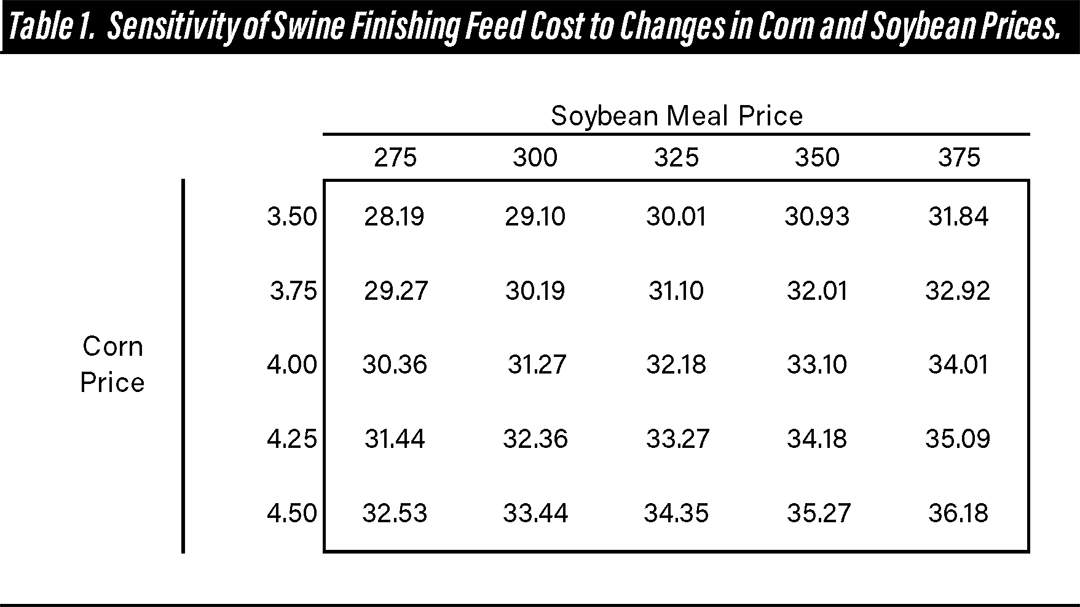
Table 1. Sensitivity of Swine Finishing Feed Cost to Changes in Corn and Soybean Prices.
Conclusions
This article discussed recent trends in feed costs for farrow-to-finish and swine finishing enterprises and provided projections for 2026. Average feed costs in 2025 were approximately 9% lower than feed costs in 2024 and 44% lower than feed costs in 2023. Feed costs in 2026 are expected to be like those experienced in 2025. Current projections use corn prices ranging from $4.25 to $4.50 per bushel, and soybean meal prices ranging from $275 to $325 per ton. Corn and soybean prices will be impacted by weather conditions around the world as well as other supply and demand factors. Given the volatility of feed ingredient prices, this article also examined the impact of changes in corn and soybean meal prices on swine finishing feed cost. Each $0.10 per bushel change in corn price, changes feed cost by $0.43 per cwt. Similarly, each $10 per ton change in soybean meal price, changes feed cost by $0.37 per cwt.
References
farmdoc Price Distribution Tool, University of Illinois, accessed on February 11, 2026.
USDA-NASS. Quick Stats, accessed on February 2, 2026.
![]()
![]()
![]()
![]()
![]()
TAGS:
TEAM LINKS:

RELATED RESOURCES
Sorry, we couldn't find any closely related posts. Please try a different search.
UPCOMING EVENTS
We are taking a short break, but please plan to join us at one of our future programs that is a little farther in the future.