July 24, 2026
Impact of Leverage on Rates of Return of Crop Farms
by Michael Langemeier


Increasing financial leverage will increase expected returns as long the marginal returns from the use of loans exceed the cost of borrowing. In favorable economic times, higher leverage can improve financial performance and stimulate farm growth. However, in unfavorable economic times, leverage can cause business performance to deteriorate rapidly. Thus, higher leverage may increase expected returns and financial risk. Given this risk/return relationship, what is the optimal level of farm debt? This is a very difficult question to answer. The answer depends on numerous factors including current liquidity and solvency positions, repayment capacity, length of repayment period and interest rate, stability of income, skill and experience of each operator, age and health of operators, and operator’s risk aversion level (Langemeier, 2020).
This article examines changes in net worth and rates of return for farms with a debt to asset ratio below 0.40 and for farms with a debt to asset ratio above 0.40, updating information contained in Langemeier (2025b). Annual FINBIN data from 2007 to 2025 for crop farms were utilized. In addition to comparing rates of return between the two leverage categories, the impact of the higher interest rates experienced since 2022 will be discussed.
Changes in Net Worth and Rates of Return
As discussed in Langemeier (2025a), there are three major changes that contribute to an increase or decrease in net worth: change in retained earnings, change in contributed capital, and change in market valuation. The change in retained earnings measures the amount of net income in a particular year that is kept in the business. The change in capital contributions accounts for gifts, debts forgiven, and capital contributions and distributions. The change in market valuation subtracts the change in deferred liabilities from the change in the market value of capital assets. Deferred liabilities represent an amount that is owed if an asset is sold.
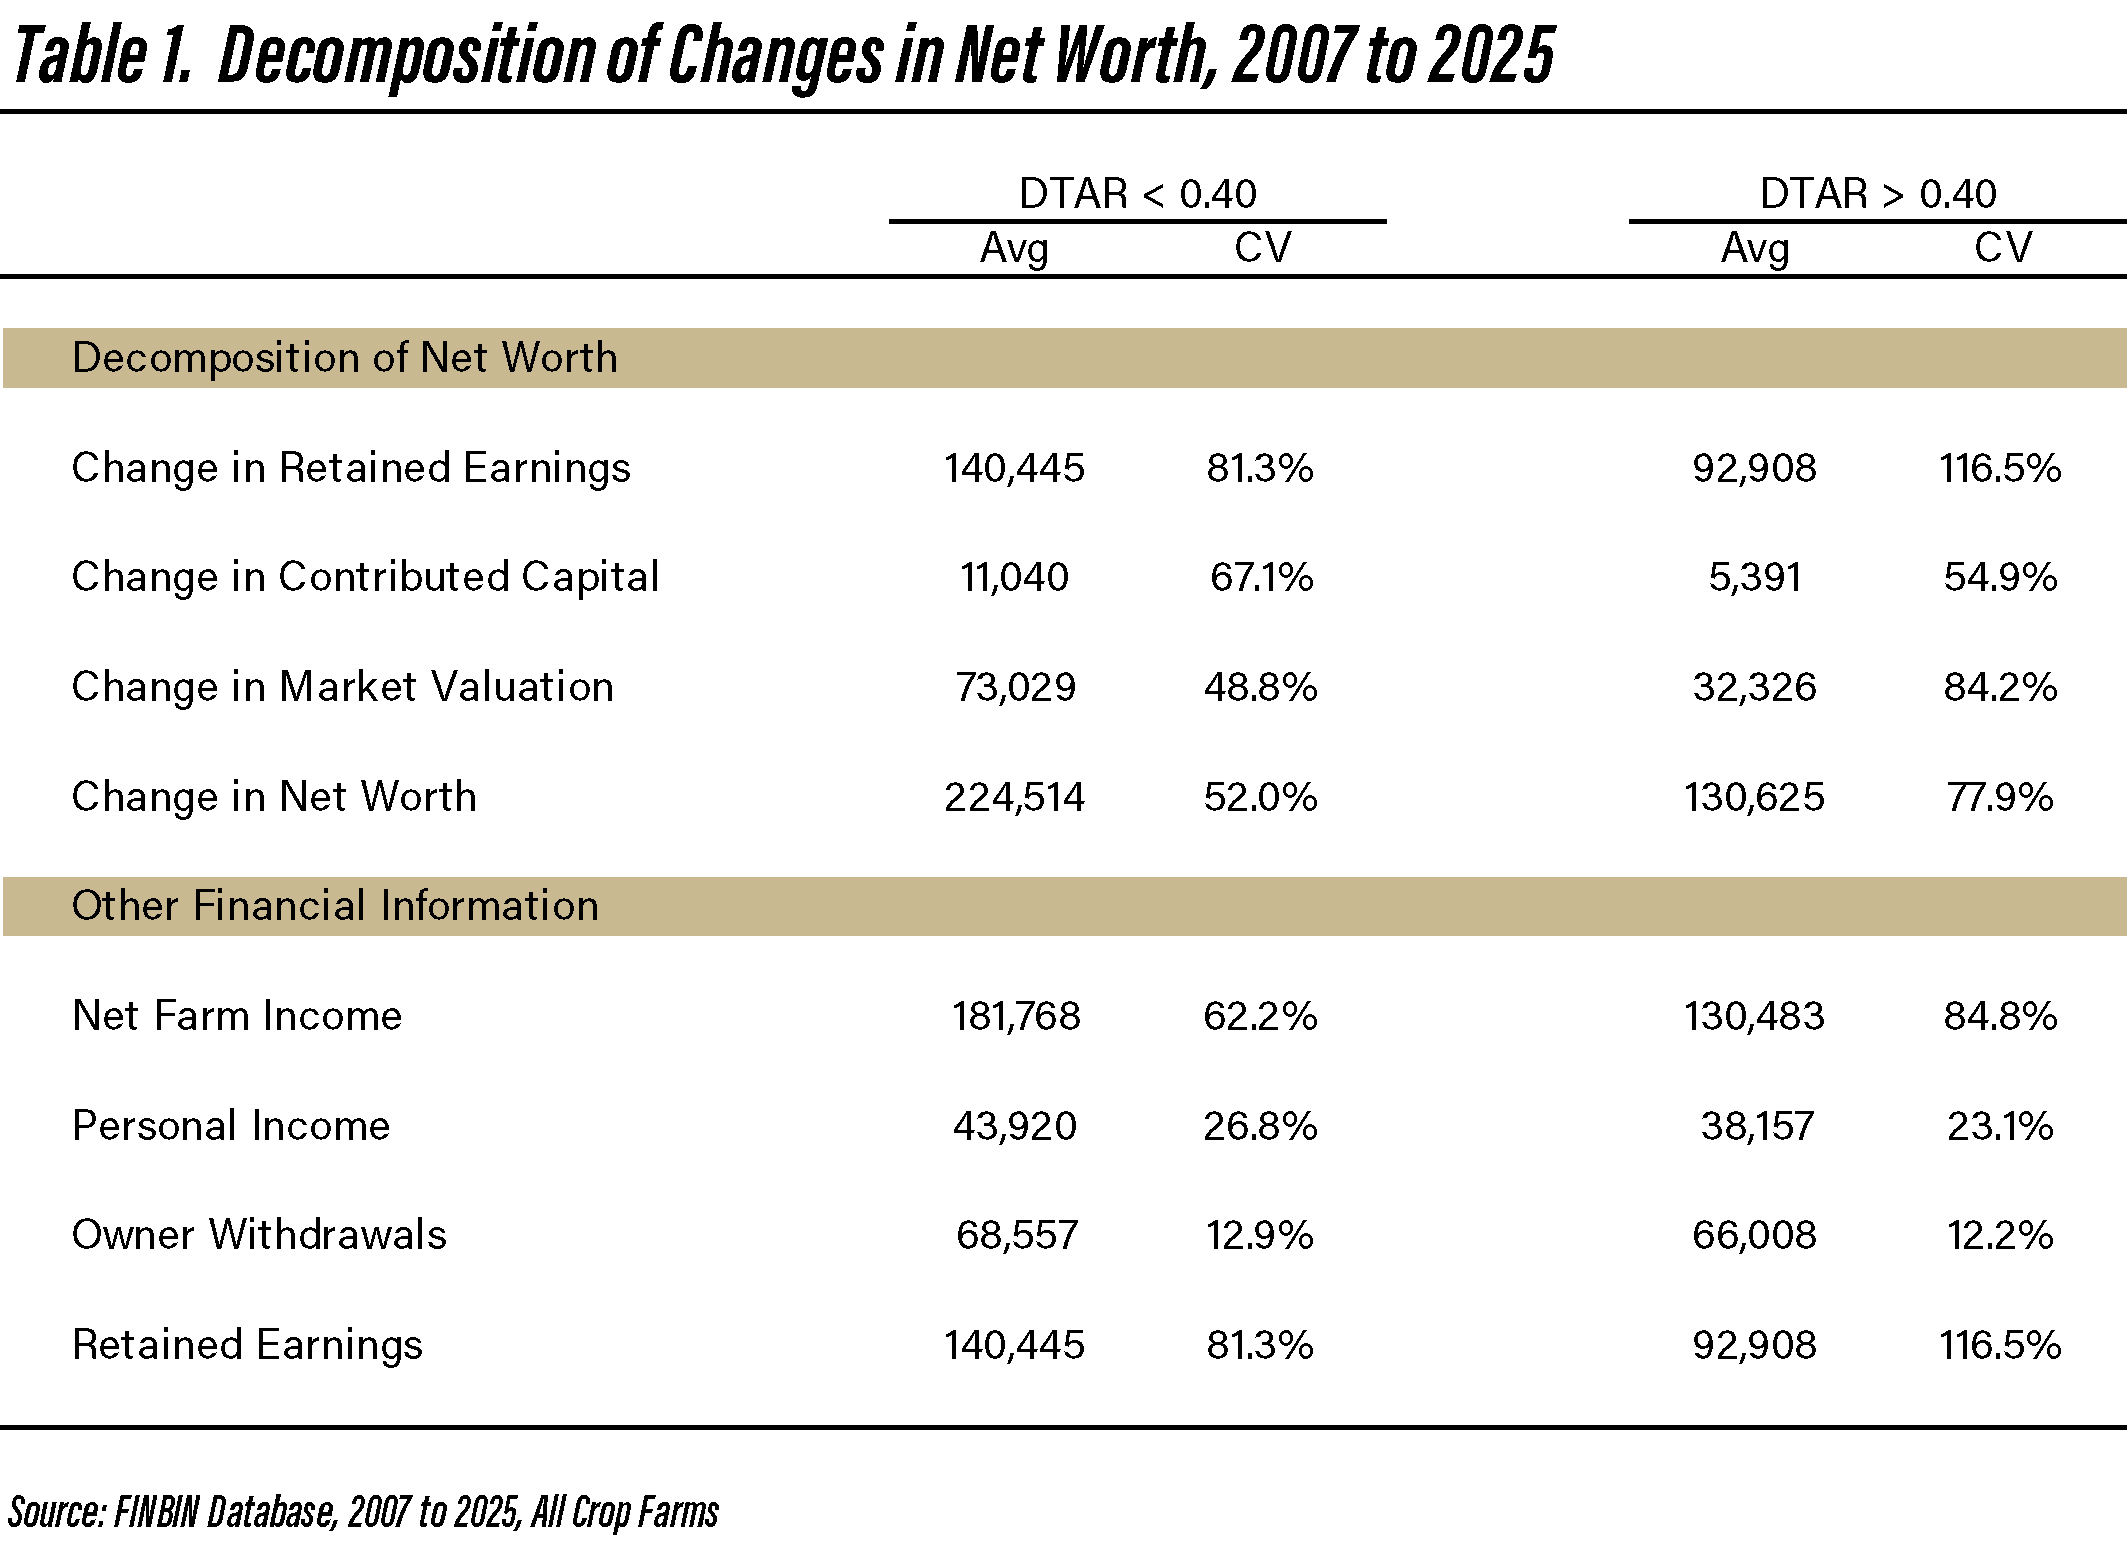
Table 1. Decomposition of Changes in Net Worth, 2007 to 2025
Table 1 contains the average and coefficient of variation (standard deviation divided by average) for the change in net worth and its component over the time period for farms with a relatively low debt to asset ratio (debt to asset ratio less than 0.40) and for farms with a relatively high debt to asset ratio (debt to asset ratio greater than 0.40). The retained earnings computation included both net farm income and personal income. Approximately 63 percent of the change in net worth for the low debt farms can be attributed to retained earnings. For the high debt farms, approximately 71 percent can be attributed to retained earnings. The low and high debt farms were similar in size, but the low debt farms owned a relatively higher proportion of their total acres (30% versus 20%). As expected, the coefficients of variation for the change in retained earnings and the change in net worth were larger for the high debt farms. These relationships illustrate the positive relationship between leverage and financial risk.
In addition to changes in net worth, table 1 contains summary statistics for net farm income, personal income, and owner withdrawals. Personal income and owner withdrawals were substantially less variable than net farm income or retained earnings. Net farm income for the high debt farms was relatively more variable. The ratio of retained earnings to net farm income was approximately 0.77 for the low debt farms and 0.71 for the high debt farms, which indicates that the low debt farms retained a higher percentage of their net farm income. On average, net farm income represented approximately 23 percent of gross farm income for the low debt farms and approximately 15 percent of gross farm income for the high debt farms. The net farm income ratio measures financial efficiency thus, the low debt farms were more financially efficient than the high debt farms.
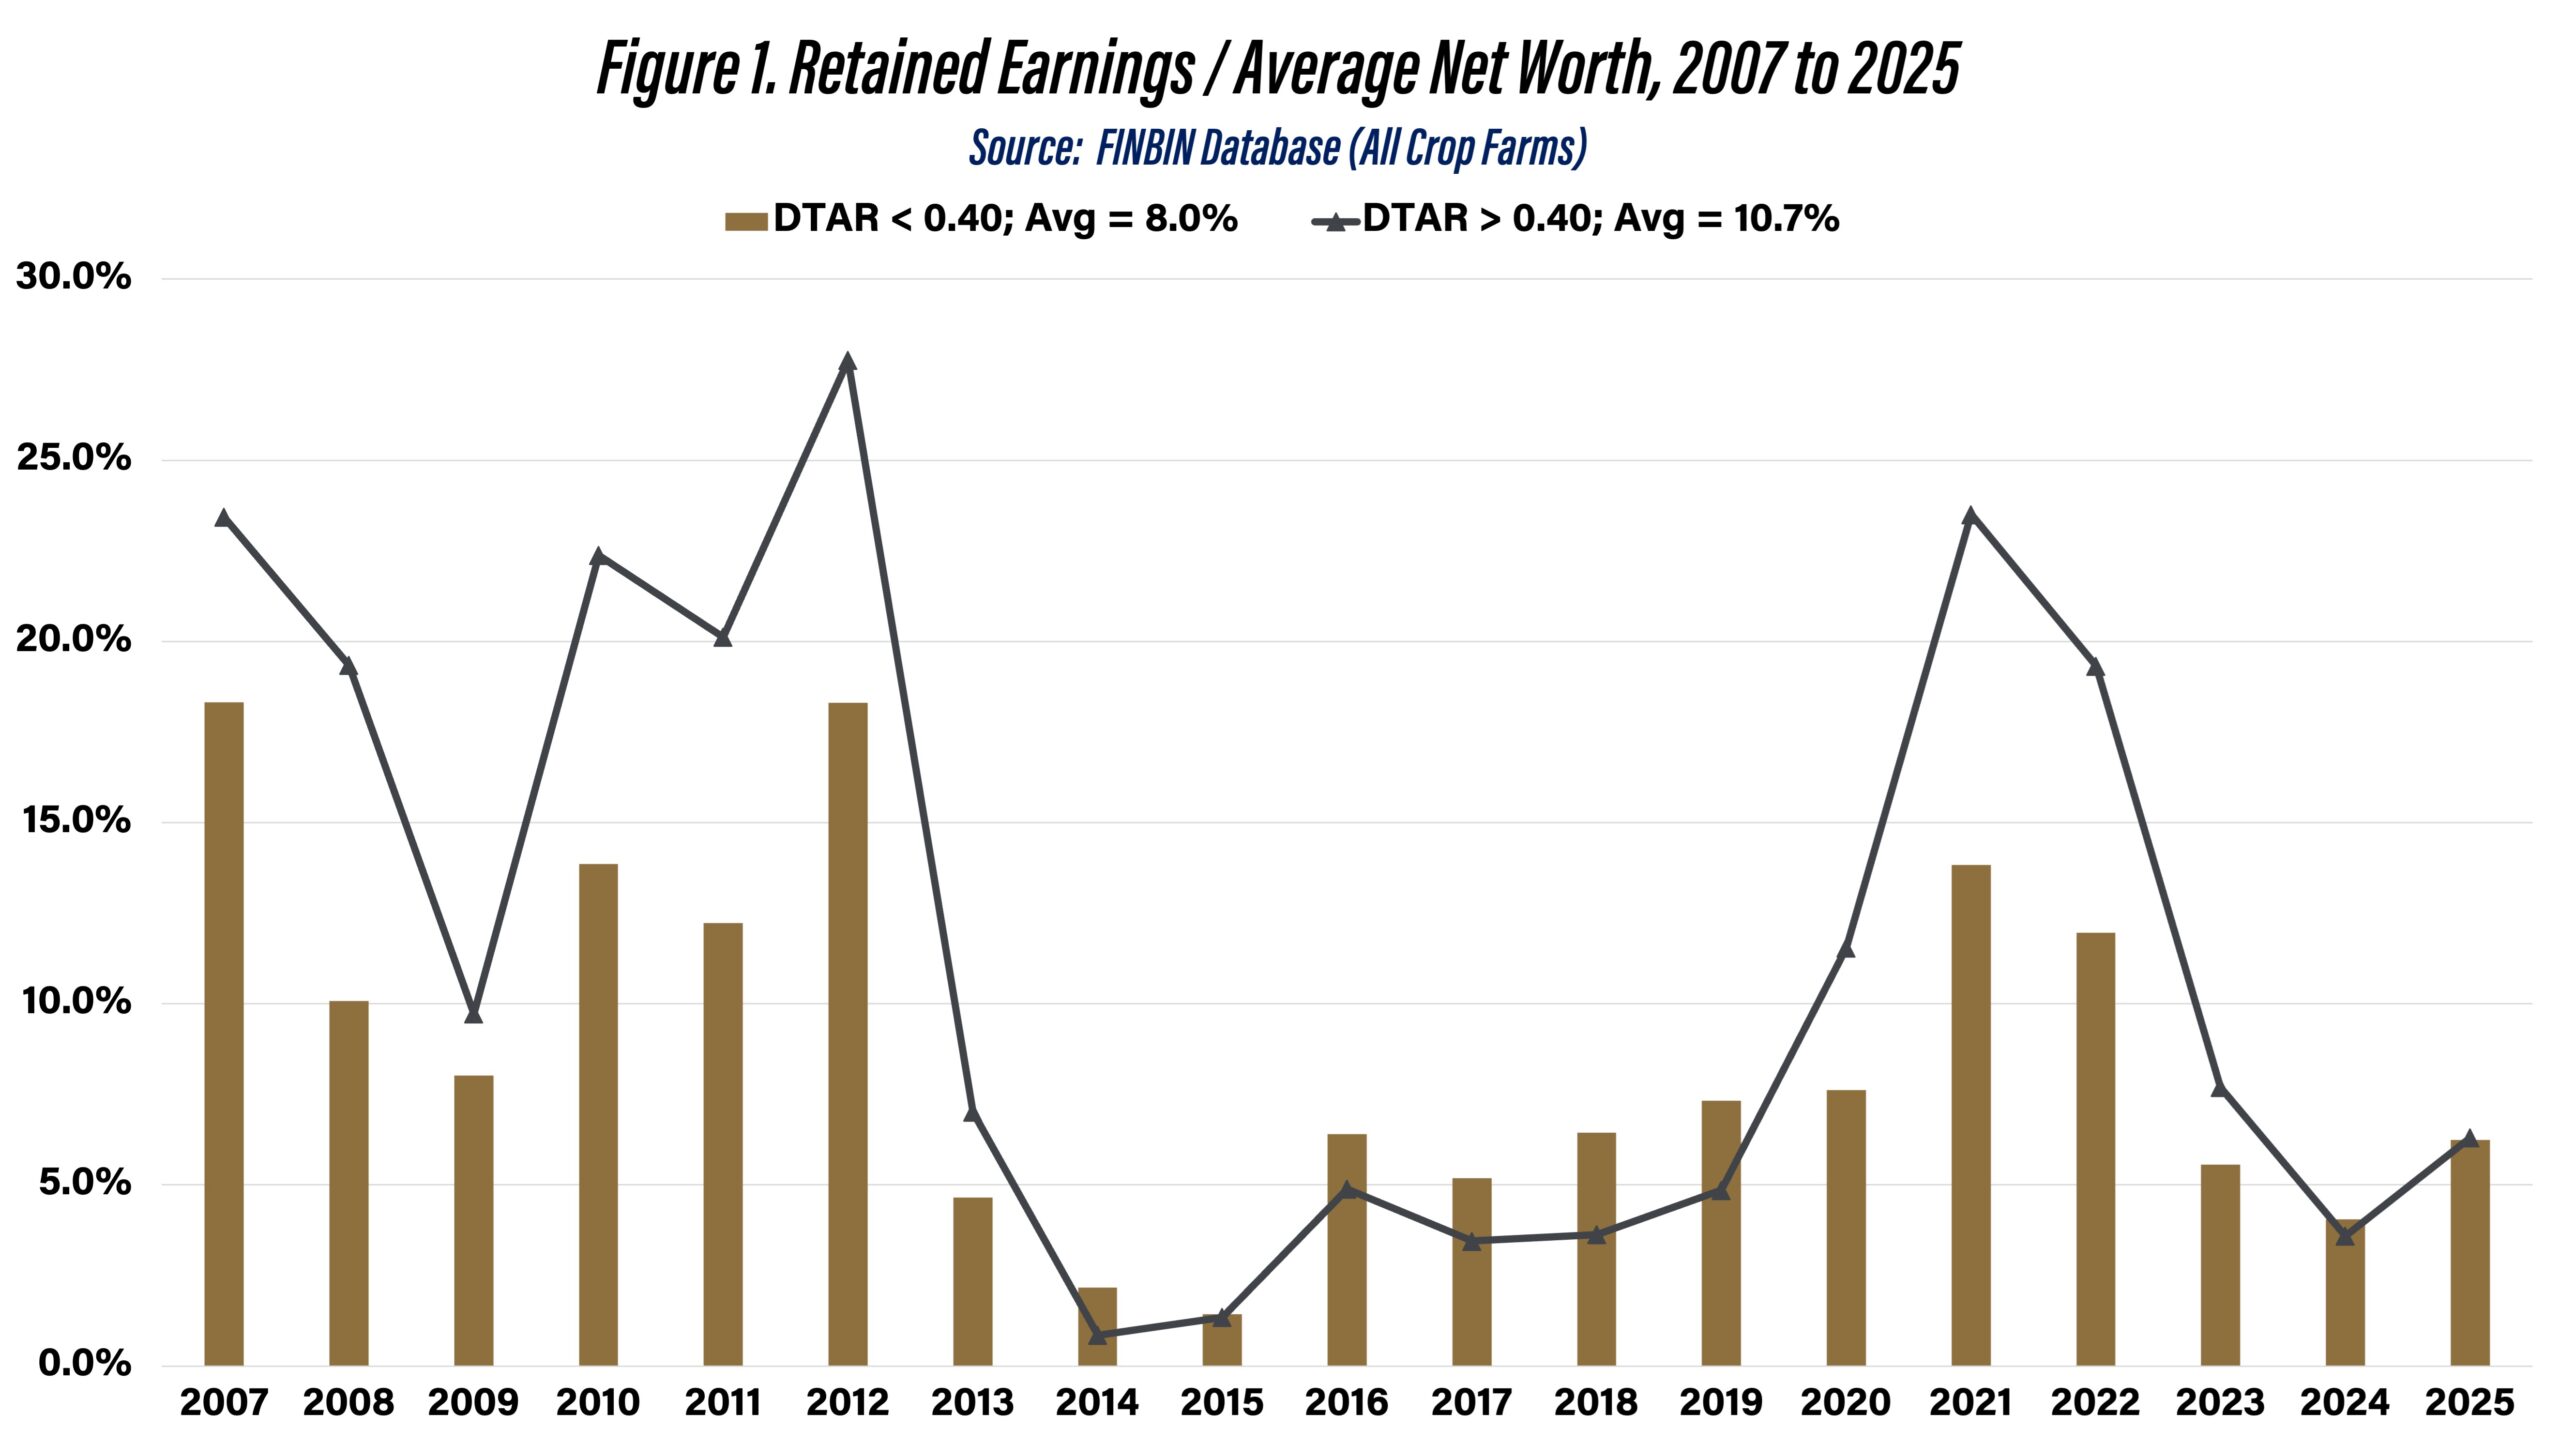
Figure 1. Retained Earnings / Average Net Worth, 2007 to 2025
Figure 1 illustrates retained earnings as a percentage of average net worth for both farm categories. Obviously, there is a lot of variability in this measure for each group of farms. However, the variability is higher for the high debt to asset ratio farms. The average performance measure for the high debt farms at 10.7 percent is higher than the average performance measure for the low debt farms (8.0 percent). As noted above, leverage improves financial performance in a good economic environment. The relationship between the average performance measures points to the strong financial performance exhibited by farms since 2007. Relatively low interest rates experienced during most of the study period contributed to the relatively strong performance of the high debt farms.
To further compare the variability in financial performance for the two categories of farms, it is useful to compare the standard deviation and coefficient of variation (standard deviation divided by the average) in retained earnings as a percentage of net worth for low and high debt farms. The standard deviation of financial performance for the low debt farms was 5.0% and the coefficient of variation was coefficient was 0.632. In contrast, the standard deviation for the high debt farms was 9.1% and the coefficient of variation was 0.850 for the high debt farms. Using Figure 1, financial performance for the high debt farms was relatively higher from 2007 to 2013 and from 2020 to 2023, and relatively lower from 2014 to 2019 and in 2024 and 2025.
Historical and Projected Interest Rates
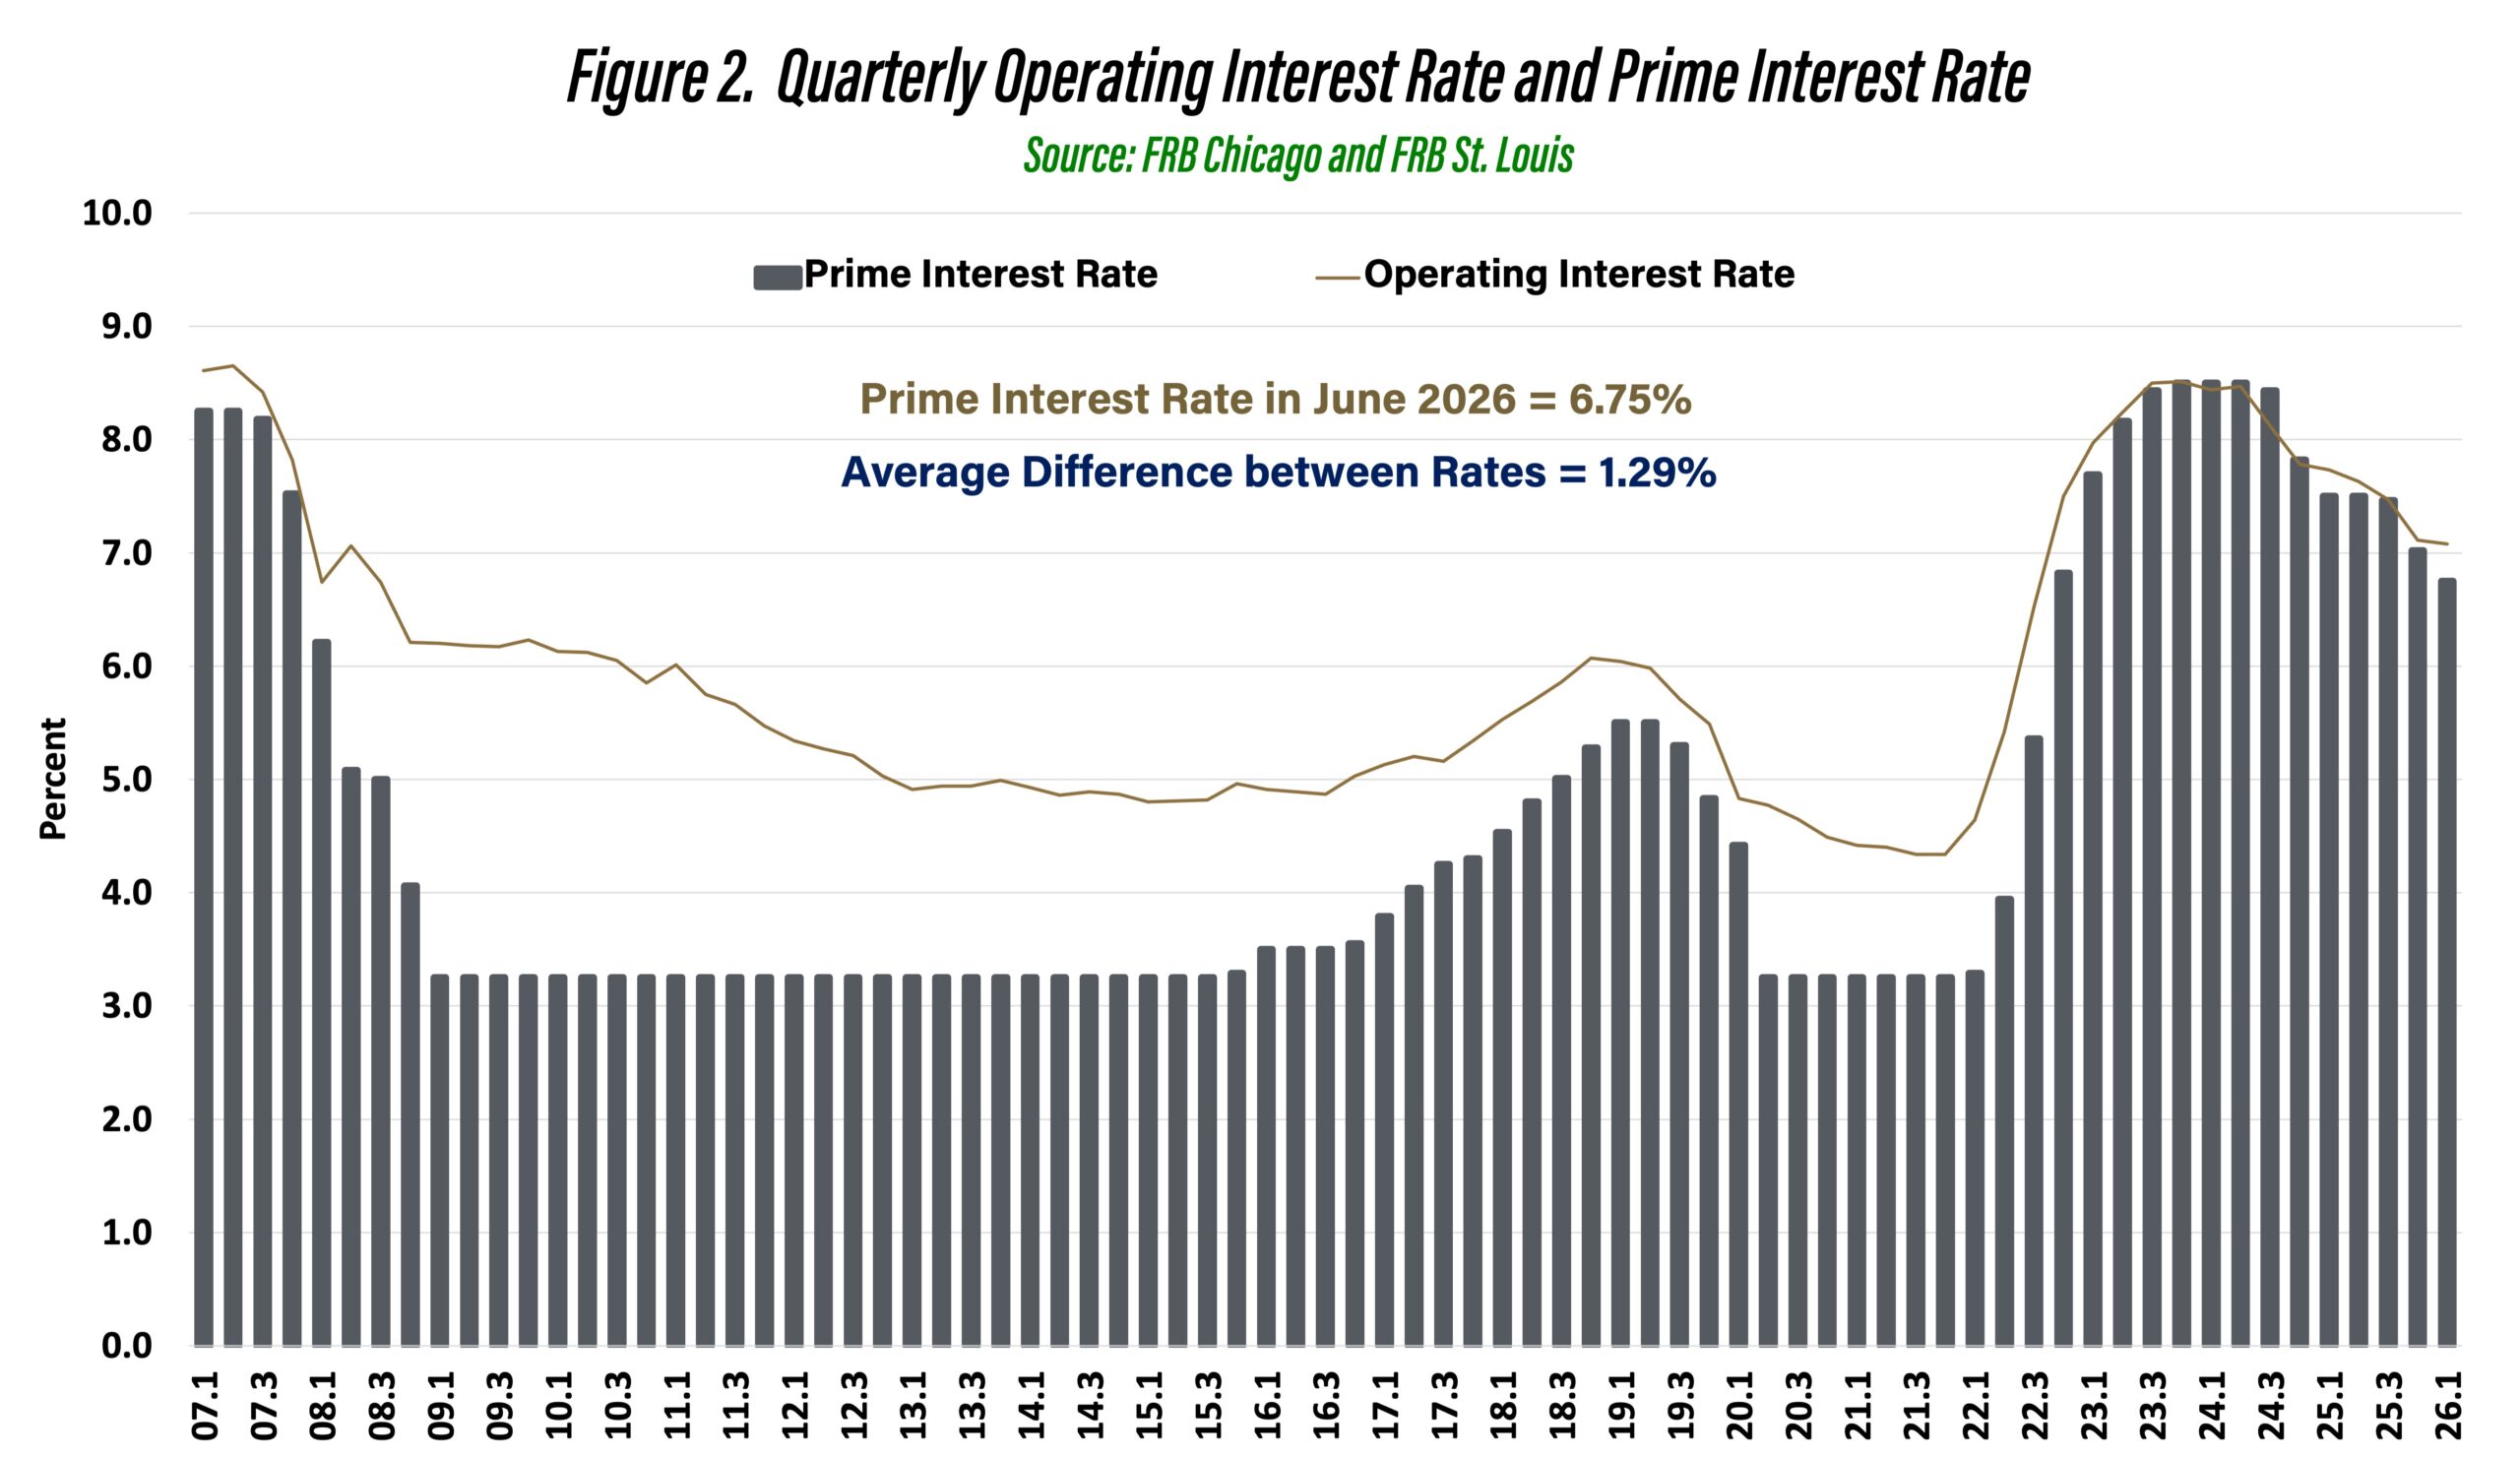
Figure 2. Quarterly Operating Interest Rate and Prime Interest Rate
Interest rates were historically low from 2008 to 2022. Figure 2 illustrates the quarterly agricultural interest rate for operating loans as reported by the Federal Reserve Bank of Chicago as well as the quarterly prime interest rate (Federal Reserve Bank of St. Louis). The agricultural interest rate dropped from 8.38 percent in 2007 to 6.69 percent in 2008. The drop in the prime interest rate was even sharper (8.05 percent to 5.09 percent). These two interest rates did not climb back above 8 percent until 2023. In 2023 and 2024, the annual operating and prime interest rates were approximately 8.25 percent. In 2025, the two interest rates dropped to 7.5 percent.
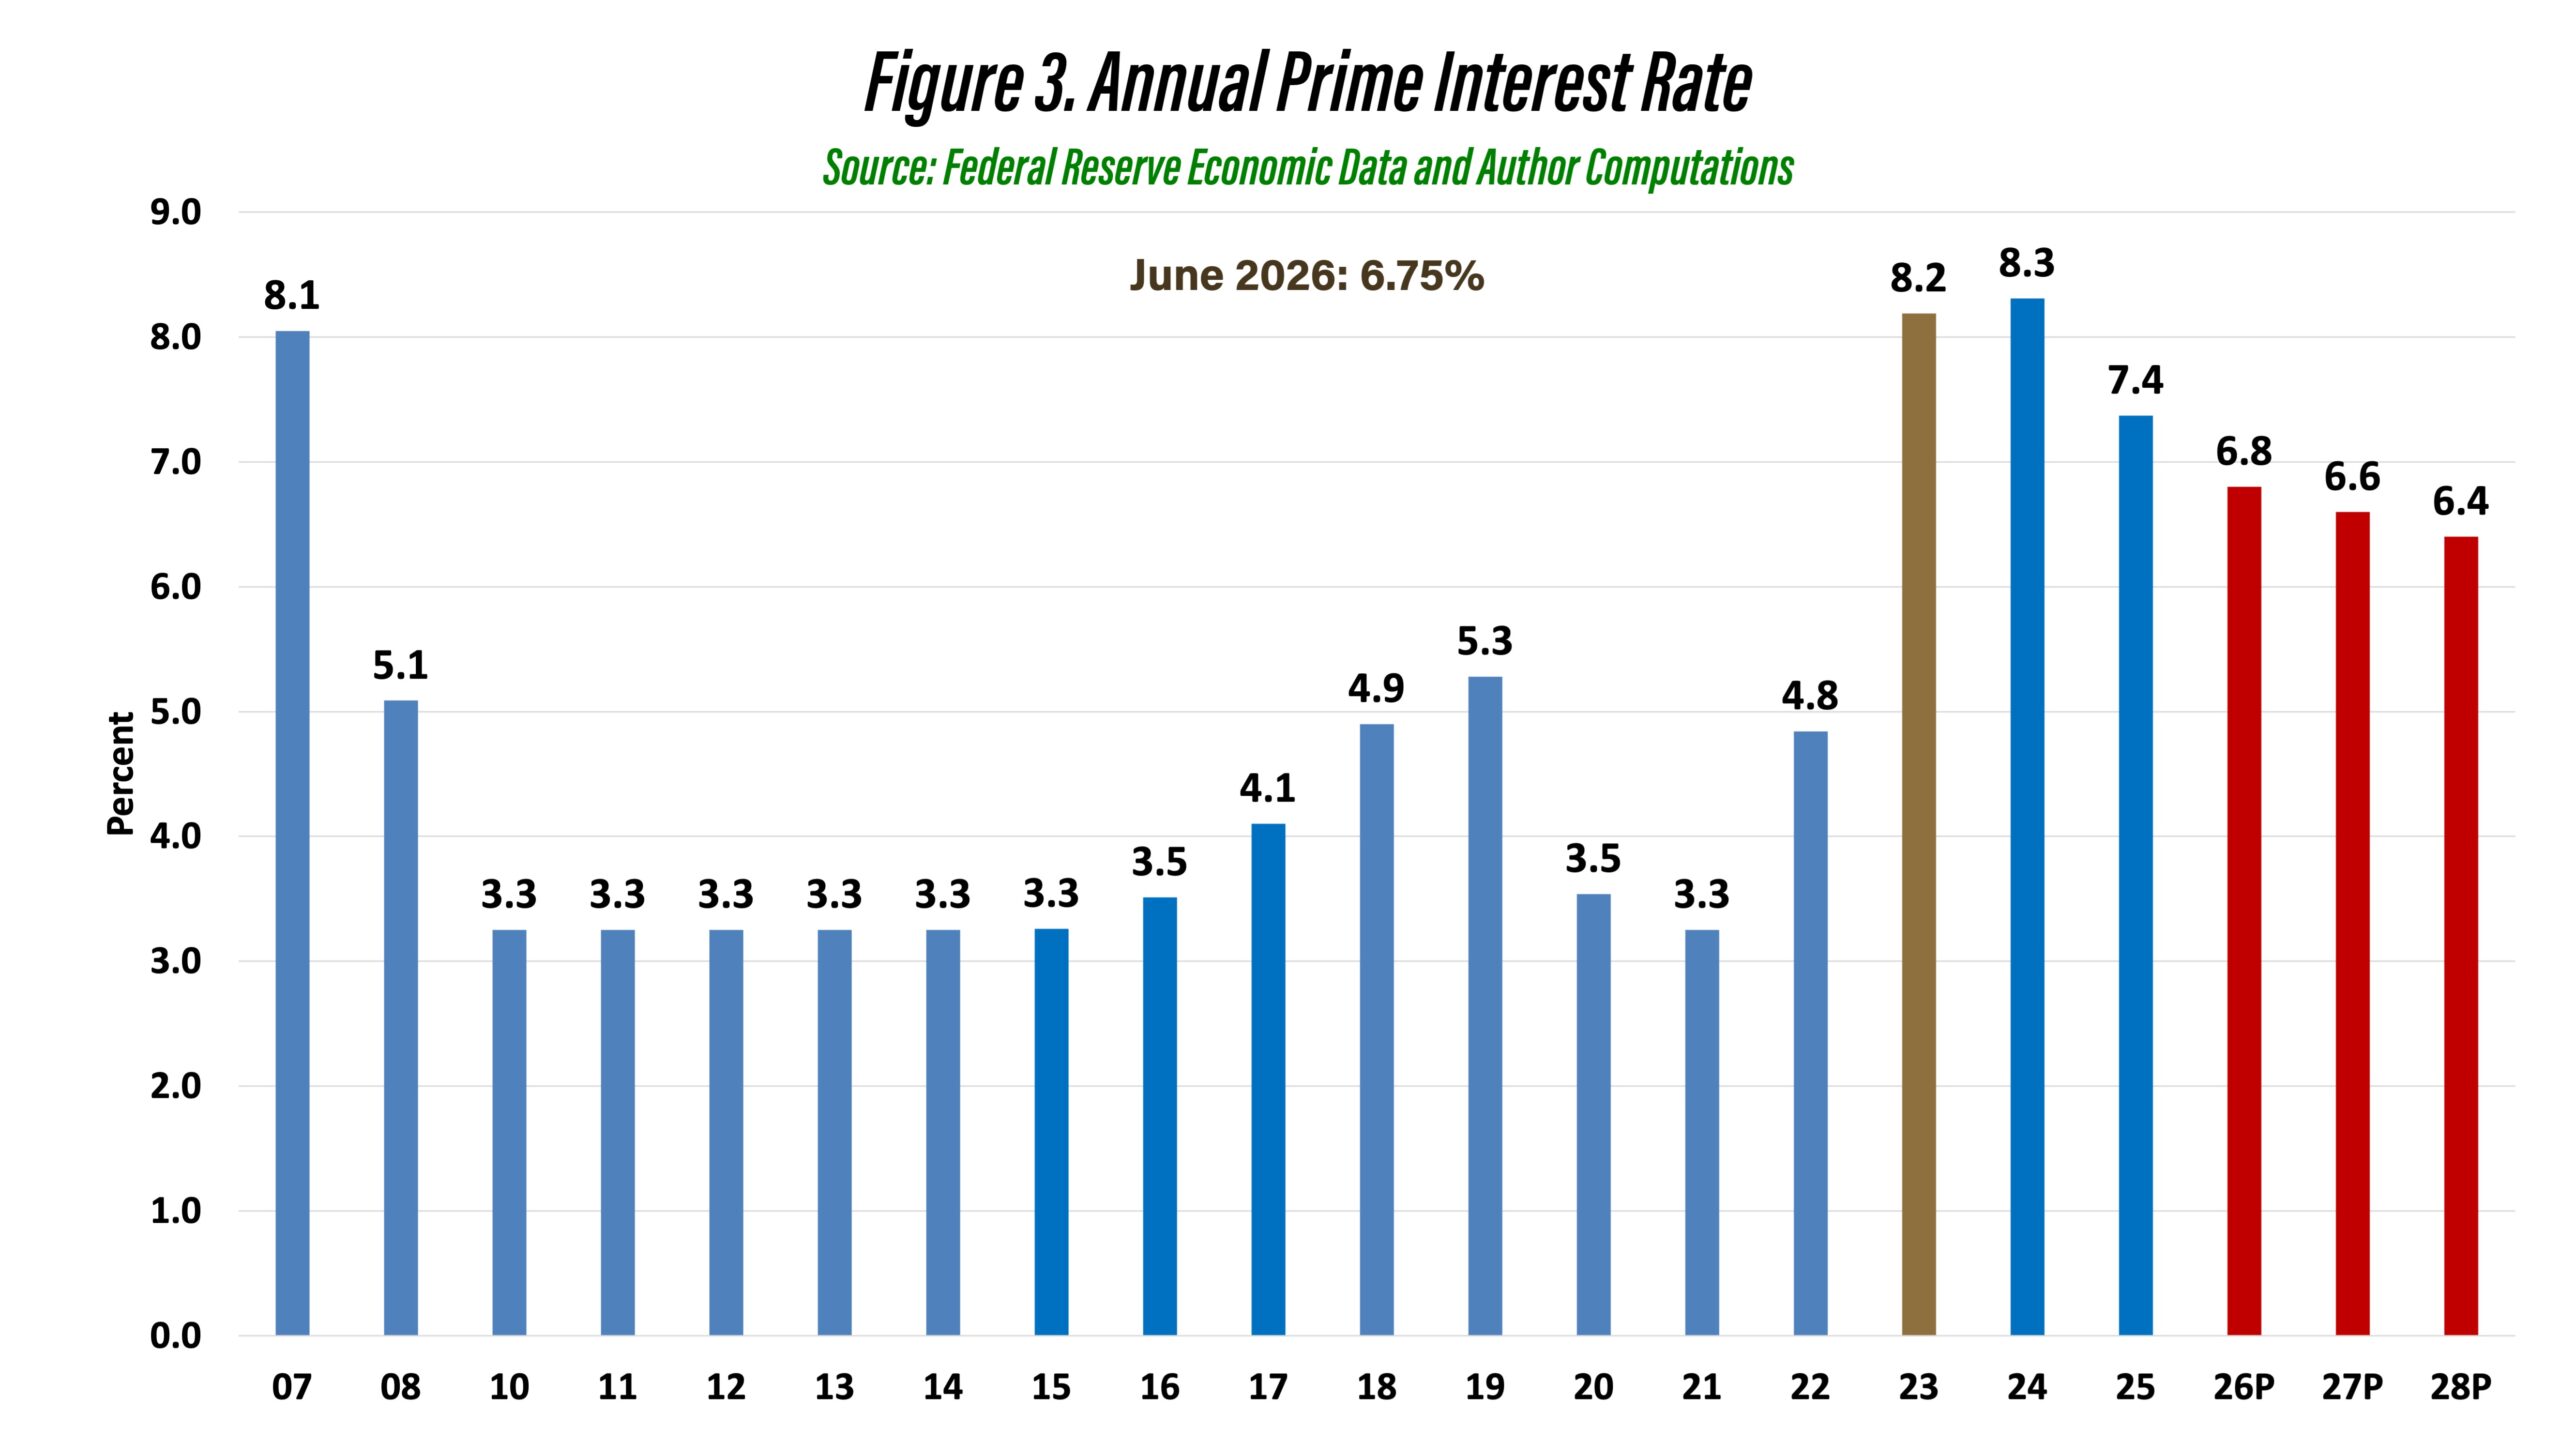
Figure 3. Annual Prime Interest Rate
Figure 3 illustrates historical and projected prime interest rates. The projections were computed by adding 3 percentage points to the latest fed fund rate projections made by the U.S. Federal Open Market Committee. Three percentage points represent the long-run difference between the prime interest rate and the federal funds rate. As illustrated in figure 3, the prime interest rate is expected to increase slightly in 2026 before modestly dropping in 2027 and 2028. However, the rate is expected to remain well above the rates experienced from 2008 to 2022.
What are the implications of relatively higher interest rates on leverage? First, higher interest rates increase the hurdle needed for new capital purchases. Second, higher interest rates increase the probability that repayment of term debt will run into a snag. Again, it is important to point out that optimal debt levels depend on many factors and are farm specific. Having said that, higher interest rates do suggest that extra caution is needed when debt to asset levels are above 0.40.
Concluding Comments
High debt to asset ratio farms had a lower net farm income ratio during the 2007 to 2025 period than low debt to asset ratio farms. However, retained earnings as a percentage of average net worth was higher for the high debt to asset ratio farms. For a substantial proportion of farms, leverage increased both financial performance and financial risk during the 2007 to 2025 period. It is important to note that interest rates were unusually low from 2008 to 2022. These low interest rates made leverage more attractive than it would have been otherwise. Interest rates increased rather dramatically in 2023 and are expected to remain above the level experienced from 2008 to 2022 for the foreseeable future. Given this new interest rate environment, farms may want to reevaluate the proportions of debt and retained earnings used for expansion and for investment in new endeavors. Investments that made sense when interest rates were very low may not make as much sense in the current environment.
Citations
Center for Farm Financial Management, University of Minnesota, FINBIN web site, accessed July 6, 2026.
Langemeier, M. “How Much Debt Can a Farm Carry?” Center for Commercial Agriculture, Department of Agricultural Economics, Purdue University, September 2020.
Langemeier, M. “Decomposition of Changes in Net Worth.” Center for Commercial Agriculture, Department of Agricultural Economics, Purdue University, May 21, 2025a.
Langemeier, M. “Impact of Leverage on Rates of Return.” Center for Commercial Agriculture, Department of Agricultural Economics, Purdue University, July 7, 2025b.
TAGS:
TEAM LINKS:

RELATED RESOURCES
UPCOMING EVENTS
Join educators from across the Midwest to build skills for communicating soil health concepts on Nov. 4-5, 2026. In the field, we’ll evaluate the relationship between soil health and water management focusing on irrigation and edge of field practices. The in-service will have both classroom and on farm demonstrations.
The Land of Opportunity: A Conference for Farmland Owners will be held at two locations on October 5 and October 6, providing farmland owners with valuable information and resources to help them make informed decisions about their land. The conference will feature keynote presentations, educational breakout sessions, and networking opportunities designed specifically for those who own, manage, or have an interest in farmland.