September 9, 2020
How Much Debt Can a Farm Carry?
![]()
![]()
![]()
![]()
![]()
Introduction
Using FINBIN data (Center for Farm Financial Management, 2020), the average debt to asset ratio in 2007, the start of the ethanol boom, was 0.44. The bottom quartile had debt to asset ratios above 0.65. The top quartile had debt to asset ratios below 0.26. Due to strong earnings from 2007 to 2013, the average debt to asset ratio improved to 0.35 in 2013, the latest peak in terms of U.S. net farm income. By 2019, after several years of earnings below the 2007 to 2013 average, the debt to asset ratio averaged 0.42. The bottom and top quartiles had debt to ratios above 0.68 and below 0.24, respectively, in 2019. Obviously, there are large differences in leverage among farms.
Given the wide variability in debt to asset ratios among farms, it is natural to think about how much debt a particular farm can carry. Although this question is too general for a specific response, some guidelines can be provided for certain debts where repayment terms are known. Important factors to be considered when estimating the amount of debt that can be repaid and the amount of debt that a farm is comfortable with include current liquidity and solvency positions, repayment capacity, length of repayment period and interest rate, stability of income, skill and experience of each operator, age and health of operators, and an operator’s risk aversion level.
A case farm in west central Indiana is used to illustrate liquidity, solvency, and repayment capacity in the discussion below. This case farm utilizes a corn/soybean rotation and operates 3000 acres, 750 of which is owned.
Current Liquidity and Solvency Positions
Farms with solid liquidity and solvency positions have more flexibility regarding increases in debt levels. A farm with a solid liquidity position has sufficient current assets to cover current liabilities as well as a potential increase in current liabilities. A farm with a solid solvency position has sufficient current and noncurrent assets to cover current debt obligations as well as potential increases in debt levels.
The case farm had a current ratio of 5.57 and a solvency ratio of 0.143 at the end of 2019. In general, a current ratio above 2.0 and a solvency ratio below 0.30 are indicative of strong financial positions. Thus, the case farm has strong liquidity and solvency positions.
Repayment Capacity
Repayment capacity measures include capital debt repayment capacity, capital debt repayment margin, and replacement margin. Capital debt repayment capacity and capital debt repayment margin address a farm’s ability to repay operating loans and to cover the current portion of principal and interest due on noncurrent loans such as a machinery, building, or land loan. The replacement margin enables borrowers and lenders to evaluate whether a farm has sufficient funds to repay term debt and replace assets. For a farm to grow, it is essential that the replacement margin be large enough to repay term debt, replace assets, and purchase new assets. For this to occur, the long-run average replacement margin has to be positive. Langemeier (2019) further discusses the relationship between repayment capacity and farm growth potential.
Repayment capacity projections for the case farm in 2020 can be found in table 1. The projections of accrual net farm income use trend yields and futures prices for this fall and winter adjusted for basis. It appears that the case farm will be able to cover term debt payments, but the negative replacement margin indicates that the farm will have difficulty replacing capital assets. The cash used for capital replacement was estimated by multiplying depreciation by 1.15. This computation assumes that over the long-run the farm is interested in replacing machinery as it wears out and needs an additional margin for farm growth.
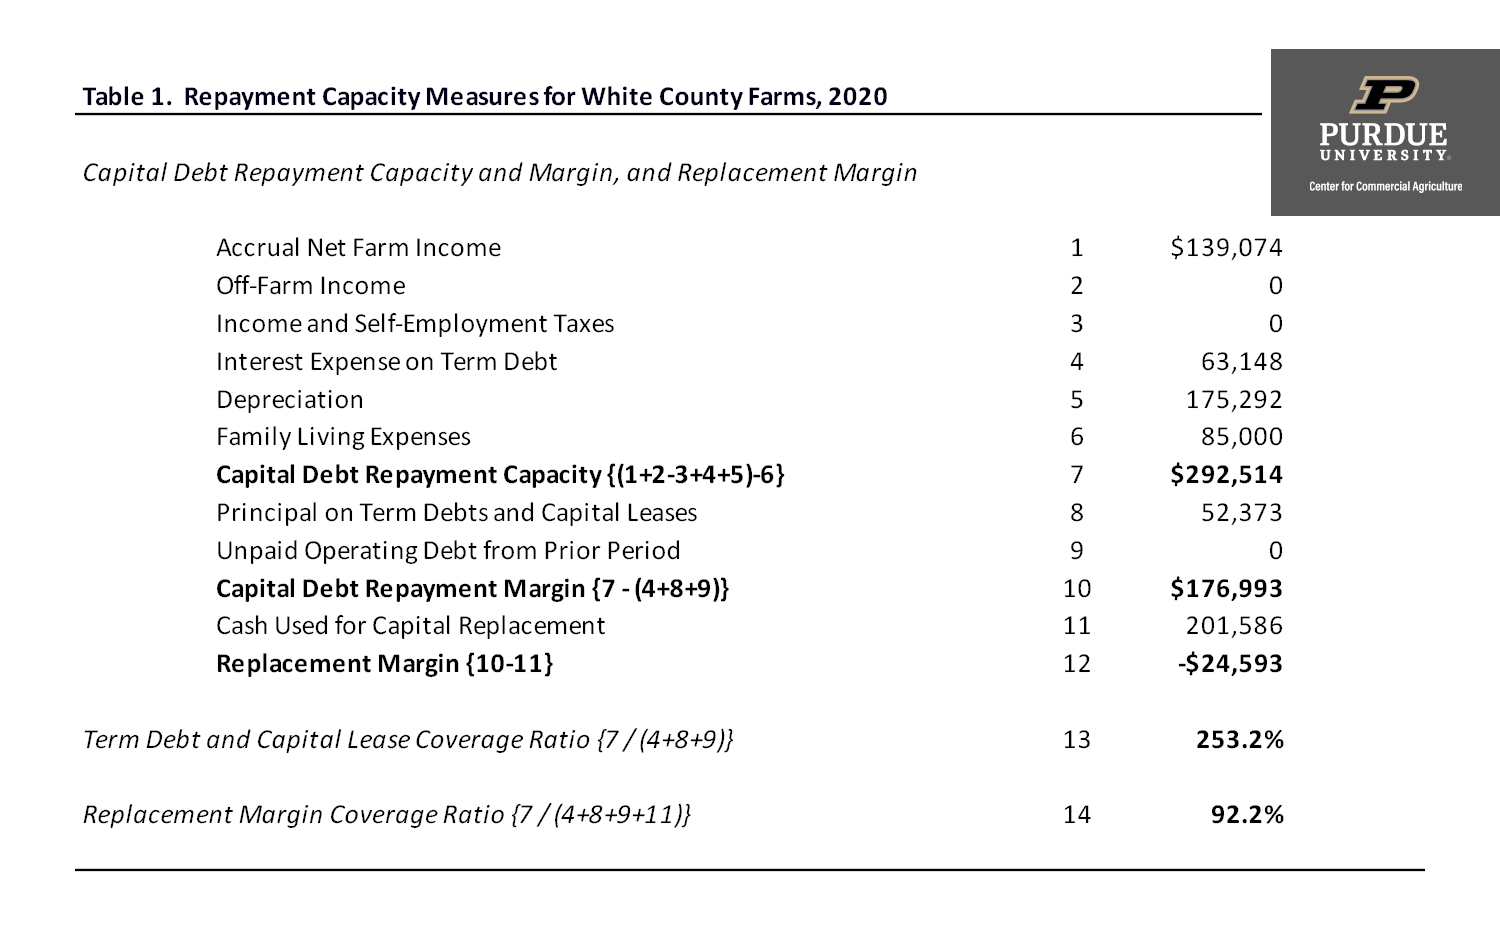
Table 1. Repayment Capacity Measures for White County Farms, 2020
Figure 1 illustrates the capital debt repayment margin and replacement margin for the case farm since 2007. Though both of these measures appear to be relatively low in 2019, the long-run averages (2007 to 2020) are positive indicating the case farm has been able to repay debt, replace assets, and expand since 2007.
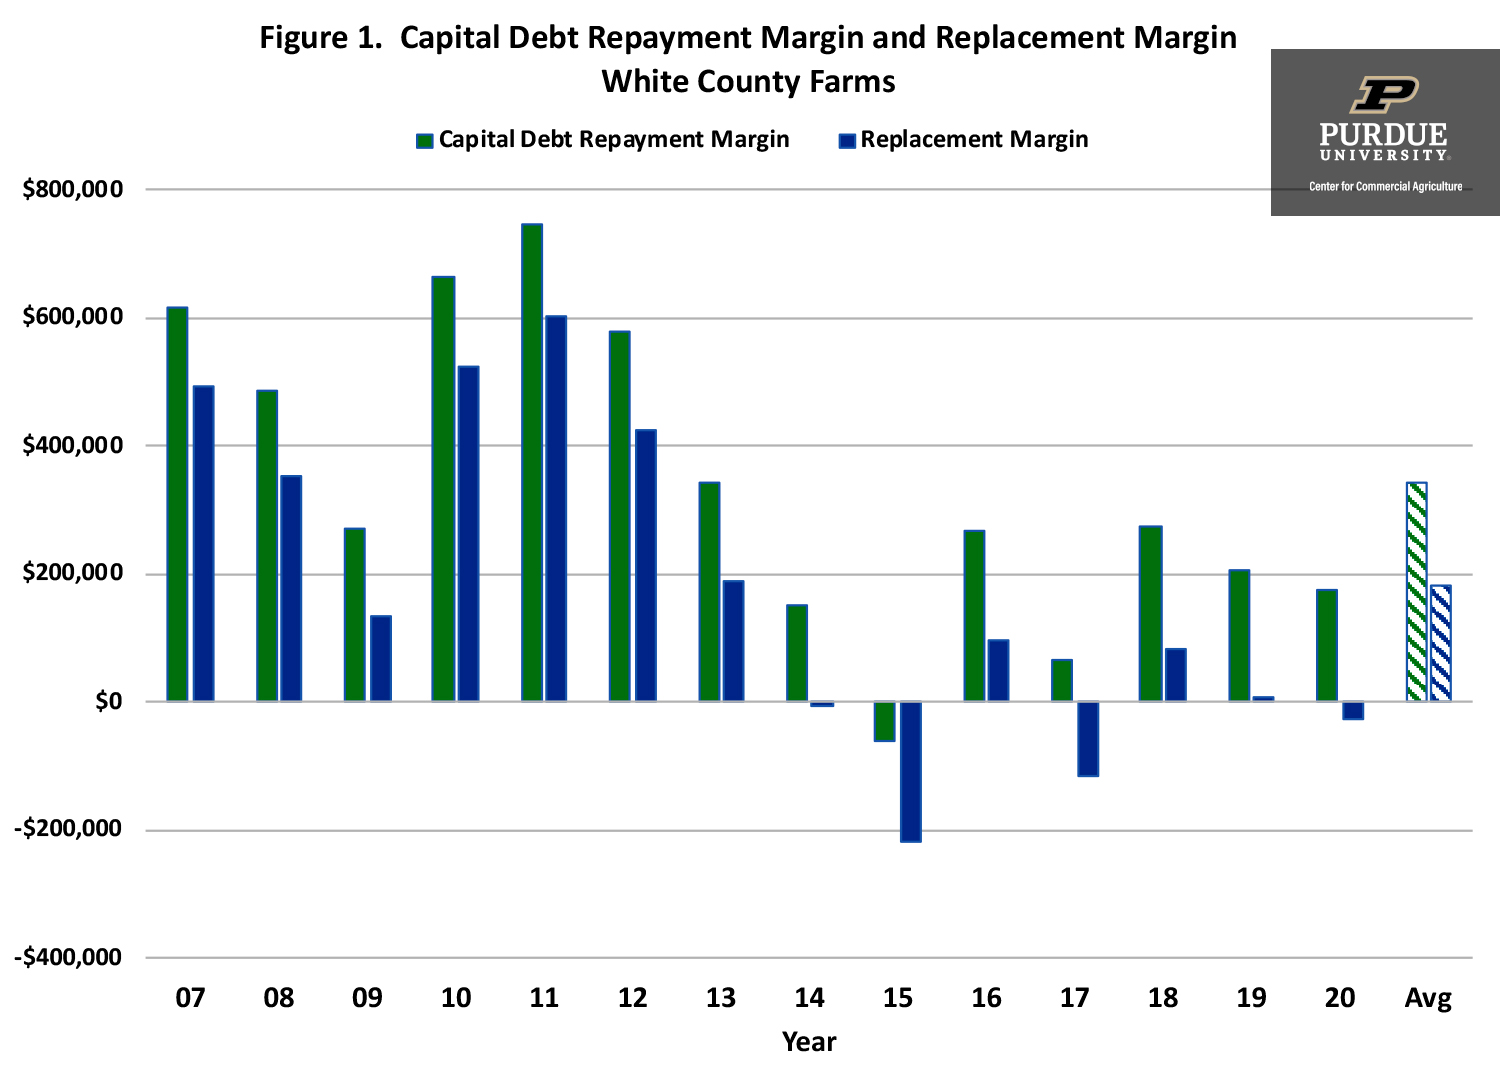
Figure 1. Capital Debt Repayment Margin and Replacement Margin
White County Farms
Length of Repayment Period and Interest Rate
The longer the repayment period and the lower the rate of interest, the greater the debt that can be carried by any level of funds available for loan repayment. It is important to compare the life of an asset to the length of the loan used to help finance the asset. If the loan length is substantially less that the life of the asset, repayment capacity diminishes. The case farm has a ten-year note on machinery and a thirty-year note on land. These loan lengths make it easier for the case farm to repay noncurrent loans.
Stability of Income
Income risk varies widely between farms and enterprises. Price, weather, and disease all impact risk levels. When heavy debt loads are necessary, a farm should reduce risks as much as possible. The greater the weather or price risk for the farm’s enterprises, the more conservative the amount of loans should be. Where crop and livestock insurance can be used to reduce risk, its use should be considered. Also, the greater the risk, the greater the importance of doing things right. When everything is done well and on time, prospects for success are greatly improved, and risk is reduced.
Effect of Skill and Experience
The value of each operator’s skill and experience is important. Superior performance resulting from excellent management may be the most important factor influencing debt carrying capacity. Superior management will cause income prospects to improve and reduce the possibility of losses.
Age and Health of Operators
These factors are, of course, relative ones. Younger, more ambitious operators, who also have the advantage of good health, can expect to meet relatively heavy debt repayment demands compared to anyone lacking in health and vigor. Young operators are often relatively more interested in expansion. When an operation is aggressively expanding, it is imperative to gauge the impact of this expansion on the farm’s liquidity, solvency, and repayment capacity positions.
Risk Aversion
Debt is one of the largest sources of risk (i.e., volatility of income). For this reason, among others of course, operators that are averse to risk tend to have lower debt-to-asset ratios. These lower debt-to-asset ratios often reduce the rate of expansion. However, they also may reduce the probability of large losses and the anxiety often associated with high debt levels.
Concluding Comments
There are numerous factors impacting a farm’s debt holding capacity. It is important to remember that financial leverage or debt directly impacts a farm’s growth rate through its effect on expected returns and risk (Langemeier and Boehlje, 2018). As long as a farm’s return on assets is larger than the interest rate on borrowed funds, financial leverage will increase the return on equity and the sustainable growth rate. However, financial leverage also increases risk. For this reason, a farm needs to weigh the benefits (in the form of higher returns and farm growth) and the costs (in the form of higher interest costs and increased risk) of financial leverage or debt.
Citations
Center for Farm Financial Management, University of Minnesota, FINBIN web site, accessed September 8, 2020
Langemeier, M. “Measuring Repayment Capacity and Farm Growth Potential.” Center for Commercial Agriculture, Purdue University, March 2019.
Langemeier, M. and M. Boehlje. “What is My Sustainable Growth Rate?.” Center for Commercial Agriculture, Purdue University, May 2018.
![]()
![]()
![]()
![]()
![]()
TEAM LINKS:

PART OF A SERIES:

RELATED RESOURCES
UPCOMING EVENTS
We are taking a short break, but please plan to join us at one of our future programs that is a little farther in the future.