August 13, 2026
Does New Planter Technology Pay? What a Purdue Field Trial Found
by Jonah Armstrong, Stephen Boyer, Alex Helms, Chad Fiechter


Planting technology has changed at an unbelievable rate over the past 40 years, but how much have these technologies improved the bottom line for farmers? There are many reported economic benefits to these advancements/technologies. For example, section control reduces overseeding, active downforce enables consistency between rows regardless of soil type, updated seed meters and seed tubes have allowed for operators to achieve consistent singulation at higher speeds, active row cleaners reduce the need for operator adjustment, and innovative closing wheels have improved seed trench closing and reduced compaction issues. Despite all these potential benefits, farmers often report that the returns to planter technology are unclear.
In 2025, Pinney Purdue Ag Center ran an experiment to compare yield differences in corn planted with current technology and 30-year-old technology. The results of this single case study showed that updated planter technology did not have a measurable impact on corn yield. The trial design is a 20-acre field planted in an alternating 12 row strip pattern. Planter 1 is a 12-row Case 2150 planter (shown in Figure 1 (a)) with vacuum meters, active hydraulic downforce, and row cleaners. Planter 2 is a 4-row John Deere 7200 with finger-pickup meters, spring downforce, and no row-cleaners (shown in Figure 1 (b)). Figure 2 (a) shows the trial setup; 19 complete passes for each of the planter types. Note that 3 passes with Planter 2 are necessary to match a single pass with Planter 1. Despite all corn receiving the same total units of N (180), Planter 1 applied starter fertilizer 2x2x2 and Planter 2 did not. The middle 6 rows are harvested for yield analysis to avoid any border effect between plots that may exist.
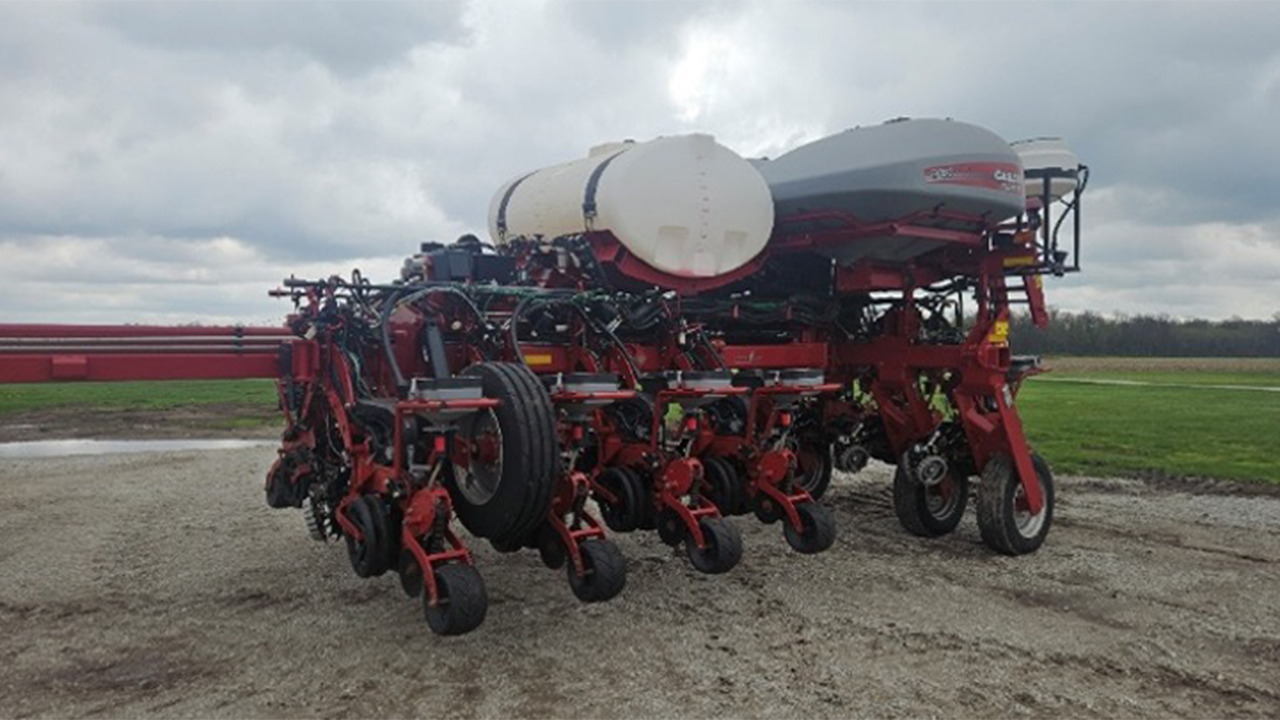
Figure 1a. A 12-row Case 2150 planter with vacuum meters, active hydraulic downforce, and row cleaners.

Figure 1b. A 4-row John Deere 7200 planter with finger-pickup meters, spring downforce, and no row cleaners.

Figure 2a. Alternating 12-row strips used to compare corn planted with modern and 30-year-old planter technology at the Purdue Pinney Ag Center.

Figure 2b. Corn yield monitor data collected during harvest of the planter technology trial. The yield monitor had an estimated calibration error of approximately 1%.
One of the challenges of this study is that, although the produced yield monitory data is highly accurate (roughly 1% calibration error) (Figure 2 (b)), typical academic trials use randomization for treatment assignment and precise volume weights at harvest. However, academic experimental design is impractical for many farm operations. As a result, we use statistical methods to control for unobserved spatial relationships within the field that obscure treatment differences. For example, consider the growing environment of two corn plants in adjacent rows, versus corn plants on opposite ends of the field. We can be much more confident in the likeness of the growing environment for the adjacent plants than those that are dispersed. To address these specific challenges, we clean the yield data and use statistical techniques suggested by Lambert et al. 2004. Specifically, we exclude all end rows and yield data points when the harvester is moving slower than 2 mph and faster than 6 mph.
Figure 3 reports the point estimates and 95% confidence intervals for five estimates of the difference in yield. In any place where the 95% confidence interval includes zero, we cannot conclude there is an effect. As a result, there is no statistical evidence that corn planted with Planter 1 and Planter 2 have different yields (including the potential effects attributable to starter fertilizer).

Figure 3. Estimated differences in corn yield between modern and 30-year-old planter technology. The 95% confidence intervals include zero for all estimates, indicating no statistically measurable yield difference between the two planter treatments.
However, yield is not the only way a planter provides economic benefit. Ease of use, streamlined logistics, and real time monitoring to reduce errors are areas where a planter can provide value to a farming operation. Modern row cleaners create more consistent seed beds without an operator having to leave the cab. One could argue this allows modern planters to be run by less skilled operators, therefore reducing overall cost per acre. Bulk seed storage decreases downtime. Instead of filling individual hoppers, larger tanks can be filled with bulk packaging and generally hold more volume. Electric seed meters and GPS reduce seed use through section control, without operator input. Further, technology may enable operators to manage larger planters more effectively, increasing productivity per worker.
The results from this case study should be interpreted cautiously. For example, soil variability, planting conditions, and weather patterns may impact effects. Therefore, the results should be interpreted as a call to future research, even at the individual farm level. Specifically, research quantifying ease of use, streamlined logistics, and yield differences under varying conditions is needed to provide farmers with clarity on the economic returns to planter technology.
Further Reading:
Lambert, D. M., Lowenberg-Deboer, J., & Bongiovanni, R. (2004). A comparison of four spatial regression models for yield monitor data: A case study from Argentina. Precision Agriculture, 5(6), 579-600.
TAGS:
TEAM LINKS:


RELATED RESOURCES
UPCOMING EVENTS
Join educators from across the Midwest to build skills for communicating soil health concepts on Nov. 4-5, 2026. In the field, we’ll evaluate the relationship between soil health and water management focusing on irrigation and edge of field practices. The in-service will have both classroom and on farm demonstrations.
The Land of Opportunity: A Conference for Farmland Owners will be held at two locations on October 5 and October 6, providing farmland owners with valuable information and resources to help them make informed decisions about their land. The conference will feature keynote presentations, educational breakout sessions, and networking opportunities designed specifically for those who own, manage, or have an interest in farmland.