Indiana Pasture Land, Irrigated Farmland, Hay Ground, and On-Farm Grain Storage Rent

August 8, 2015

PAER-2015-09

Craig L. Dobbins, Professor of Agricultural Economics and Kim Cook, Research Associate

Estimates for the rental value of irrigated farmland, pasture land, hay ground, and on-farm grain storage in Indiana are often difficult to find. For the past several years, questions about these items have been included in the Purdue Farmland Value Survey. The values from the June 2015 survey are reported here. Because the number of responses for some items is small, the number of responses is also reported.

Averages for pasture rent, the market value of and cash rent for irrigated farmland, and the rental of on-farm grain storage are presented in Tables 1, 2, and 3, respectively. The rental rate for grain bins includes two situations; one for just the bin and a second for the bin and utilities. Table 4 (page 11) provides information about the rental rate for established alfalfa-grass and grass hay ground.

Information from prior years’ surveys can be found in the Purdue Agricultural Economics Report archive.​​​

This information can be found in the August issue beginning in 2006.
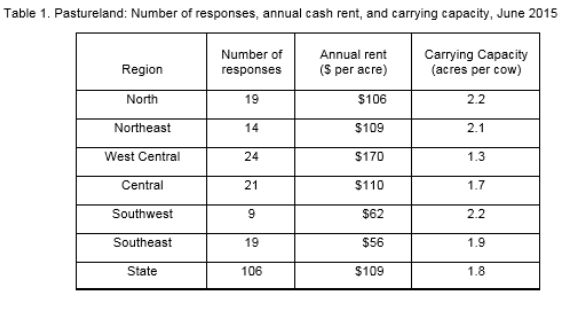
Table 1: Pastureland: Number of responses, annual cash rent, and carrying capacity, June 2015
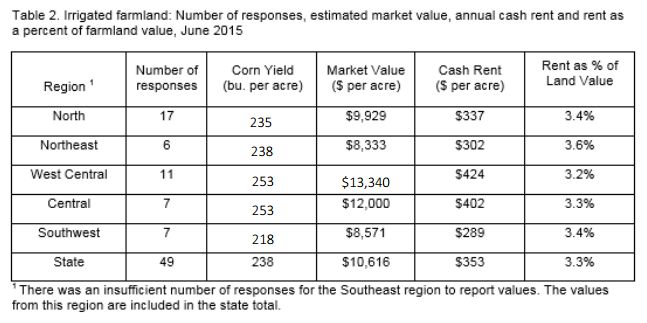
Table 1: Pastureland: Number of responses, annual cash rent, and carrying capacity, June 2015


Table 2. Irrigated farmland: Number of responses, estimated market value, annual cash rent and rent as a percent of farmland value, June 2015
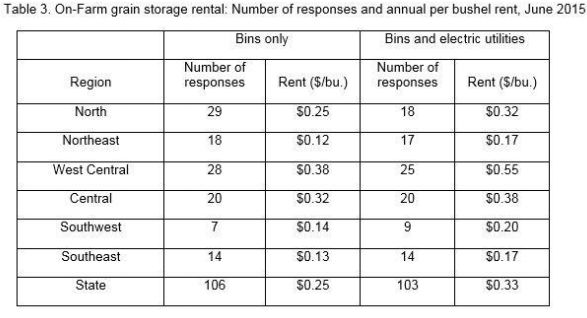
Table 2. Irrigated farmland: Number of responses, estimated market value, annual cash rent and rent as a percent of farmland value, June 2015


Table 3. On-Farm grain storage rental: Number of responses and annual per bushel rent, June 2015

Table 3. On-Farm grain storage rental: Number of responses and annual per bushel rent, June 2015
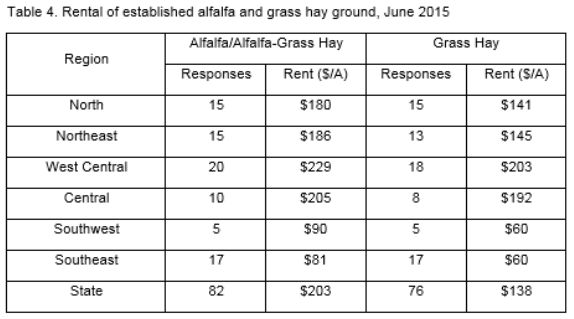
 

Table 4. Rental of established alfalfa and grass hay ground, June 2015
Table 4. Rental of established alfalfa and grass hay ground, June 2015


Publication Appeared Within:

Latest Articles:

The August 2026 CPI and PPI Reports: The Late-July Energy Spike Arrives, and the Food Pipeline Still Holds

September 16, 2026

Energy costs surged across both reports this month — diesel fuel up 24.1 percent, gasoline up 3.9 percent — in a single month. At the same time, food inflation sat almost exactly where it sat in July, and the most upstream producer-price stage swung through a wider range than the stage nearest the consumer has moved in three months combined. A real, measurable energy shock landing squarely in the data, alongside a food pipeline that barely moved, is the sharpest evidence yet for the thesis this series has been building since spring.

The August 2026 Beef Import Waiver: A Narrow Tool Aimed at a Narrow Problem

August 25, 2026

This is a targeted policy aimed at a narrow slice of the beef market — imported product for ground beef, much of which is lean processing beef — rather than a broad intervention in the fed-cattle market. It was announced in response to historically tight cattle supplies and unusually high beef prices. Within that narrow lane, the most plausible effect is some additional availability of lower-cost processing beef and some downward pressure on ground-beef prices.

The July 2026 CPI and PPI Reports: The Energy Shock Bypasses the Food Pipeline

August 20, 2026

Energy prices are 14.7 percent above year-ago levels, and yet the raw agricultural commodities that sit at the head of the food pipeline are cheaper than they were last July. That combination is the whole story of this month’s release — but it is not evidence that the energy shock missed agriculture.