2019 Indiana Pasture Land, Hay Ground, and On-Farm Grain Storage Rent
August 5, 2019
PAER-2019-11
Author: Craig Dobbins, Professor of Agricultural Economics


Estimates for the current rental value of pastureland, hay ground, irrigated land, and on-farm grain storage in Indiana are often difficult to locate. For the past several years, questions about these items have been included in the Purdue Farmland Value Survey. These tables report the values from the June 2019 survey.
Table 1 reports averages and the number of responses for pasture rent. The number of acres required to support a cow is also presented.
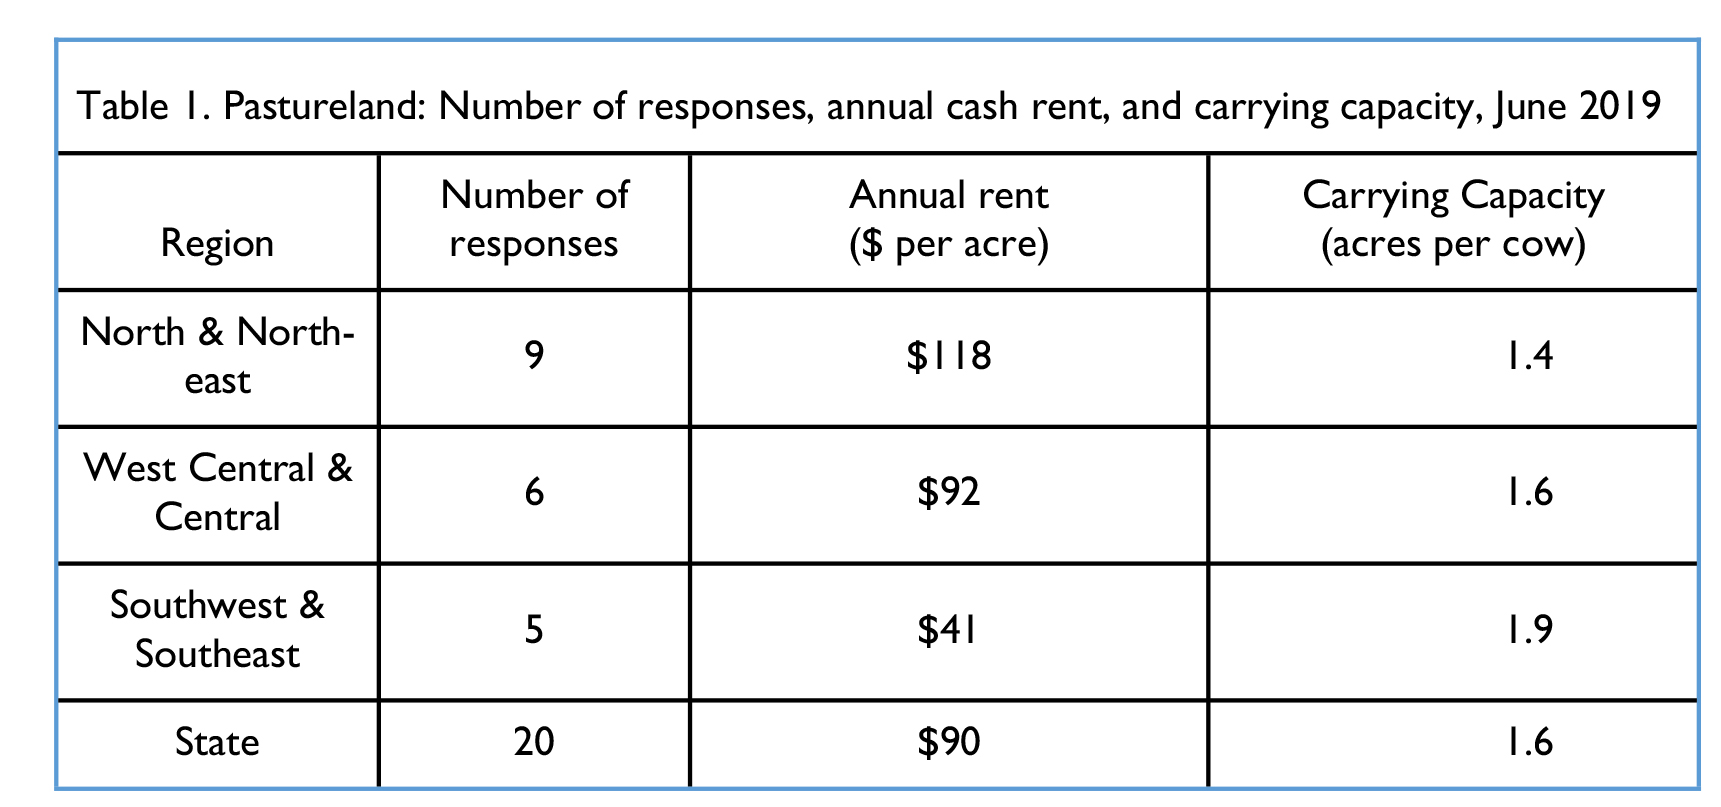
Table 1. Pastureland: Number of responses, annual cash rent, and carrying capacity, June 2019
Table 2 reports the average per acre rental rates and the number of responses for established alfalfa/grass hay and grass hay.
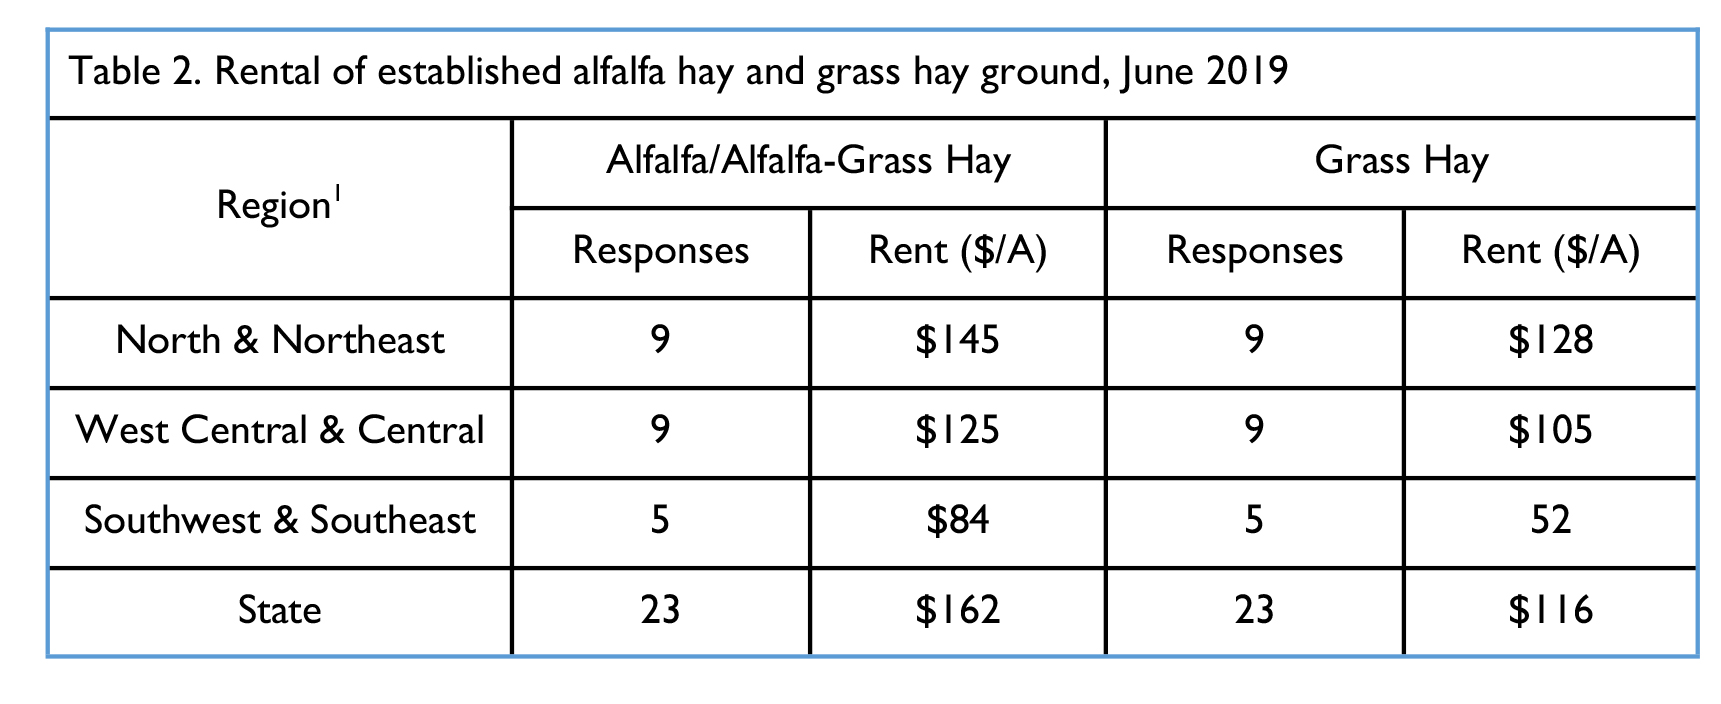
Table 2. Rental of established alfalfa hay and grass ground, June 2019
Table 3 provides information about the value and rental rate for irrigated farmland. These rates are for the production of corn and soybeans. When producing specialty crops such as seed corn or tomatoes, rent is frequently higher.

Table 3. Irrigated Indiana farmland: Number of responses, long-term corn yields, estimated market value, annual cash rent, and rent as a percent of farmland value, June 2019
Table 4 provides information about the rental rate for on-farm grain storage. The rental rate for grain bins includes three situations: where the bin only is rented, where the bin plus utilities are covered; and where a grain system is rented.
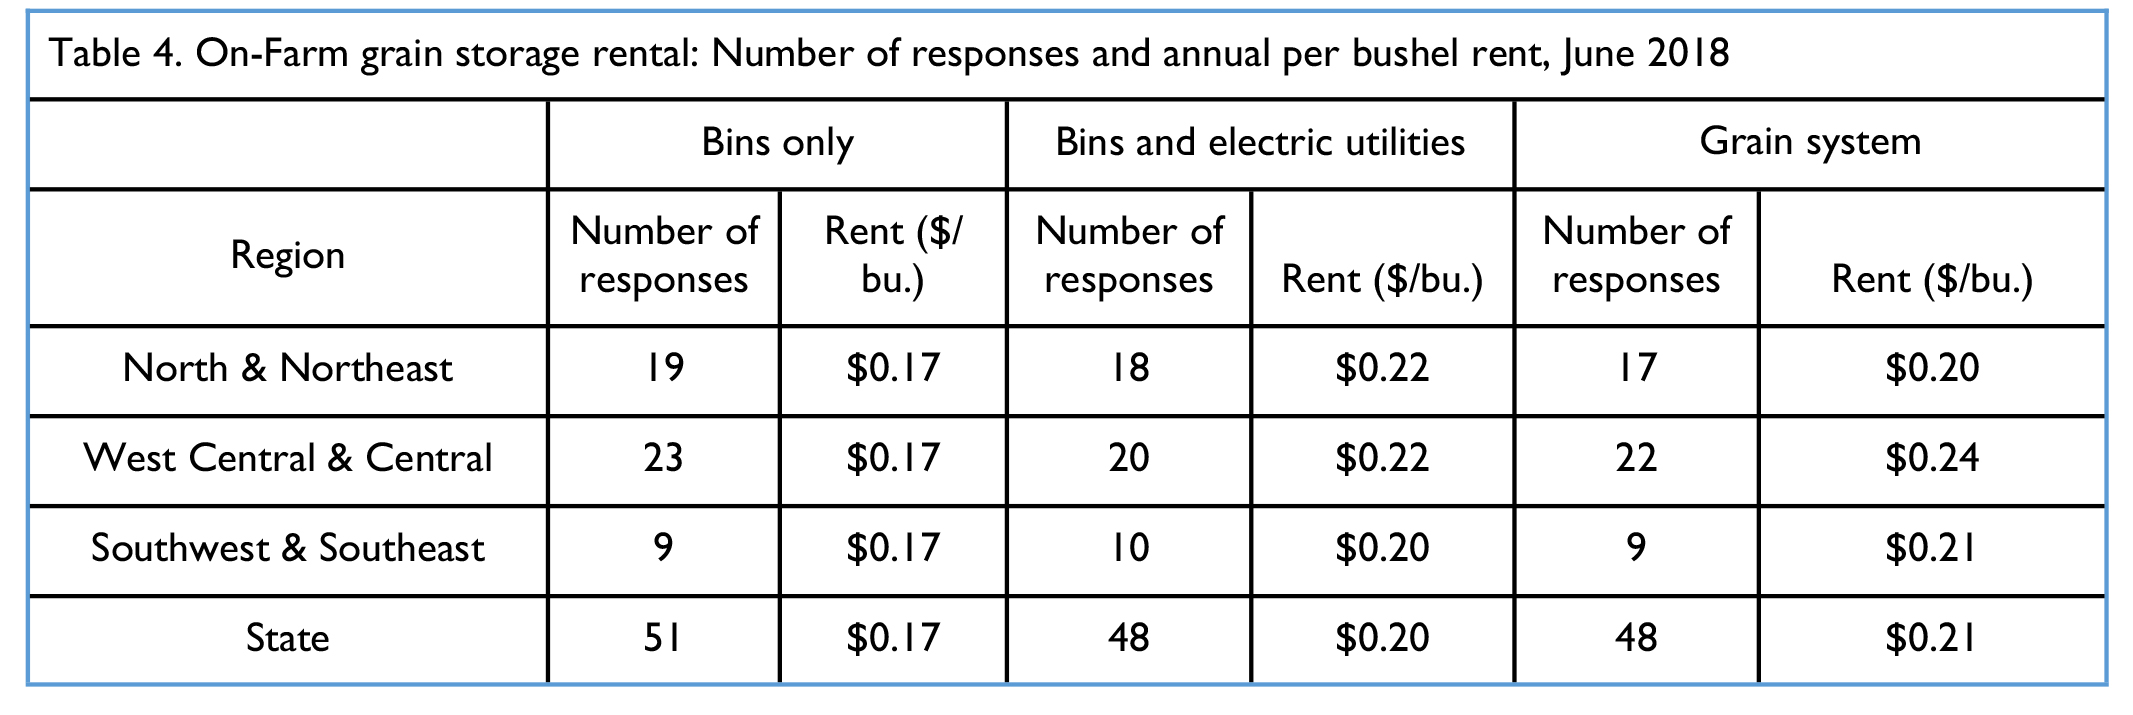
Table 4. On-Farm grain storage rental: Number of responses and annual per bushel rent, June 2019
The first year for reporting this information was 2006. Past reports are in the Purdue Agricultural Economics Report Archive. This information is typically found in the August issue of the specified year. However, 2016 results are in the February 2017 issue and the 2017 results are in the April 2018 issue.