2022 Agricultural Credit Outlook
January 13, 2022
PAER-2022-9
Authors: Brady Brewer, Assistant Professor of Agricultural Economics; Todd Kuethe, Associate Professor, Schrader Endowed Chair in Farmland Economics
![]()
![]()
![]()
![]()
![]()
2021 saw low interest rates and increasing land values. Overall, it was a good year for farmers balance sheets for both short-term and long-term assets. Liquidity and solvency were direct beneficiaries of the 2021 environment. This article examines the trends in three key parts of the agricultural credit markets: interest rates, the demand for loans, and non-performing loans. We examine data obtained from the two Federal Reserve banks that serve Indiana. As shown in Figure 1, 68 counties in northern and central Indiana are part of the Federal Reserve Bank of Chicago region, and the remaining 24 counties in southern Indiana are part of the Federal Reserve Bank of St. Louis.
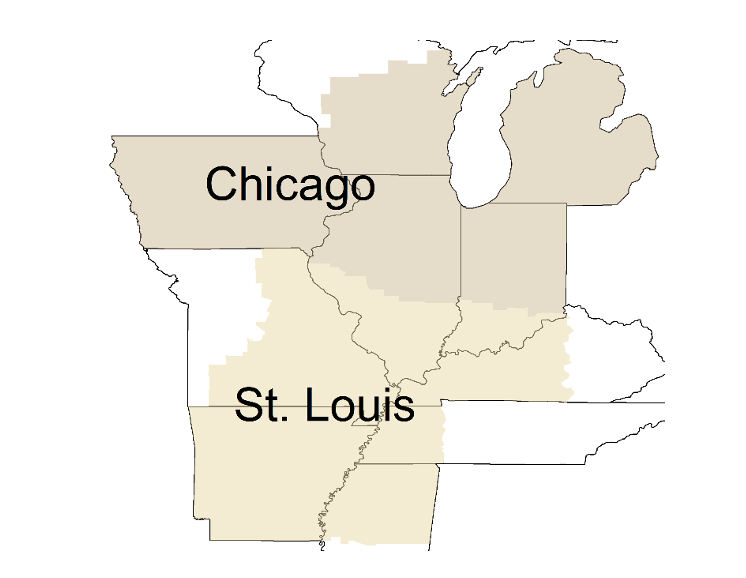
Figure 1: Chicago and St. Louis Federal Reserve Districts
Both Federal Reserve banks conduct quarterly surveys of agricultural bankers in their region. The surveys address important issues in farmland and agricultural credit markets. It is important to note that both Federal Reserve regions cover a large area with diverse agricultural sectors. Thus, local conditions may deviate from broad, regional trends. At the time of writing, data for the St. Louis Federal Reserve district were available through the third quarter of 2021 through the Federal Reserve Bank of Kansas City’s Agricultural Finance Updates, and data for the Chicago Federal Reserve district were available through the third quarter of 2021 through the bank’s AgLetter publication.
Interest Rates
In 2021, interest rates continued the downward trend that started in 2019. Figure 2 plots the average interest rate on farm operating loans since the first quarter of 2015 for both Chicago and St. Louis Fed districts. Farm operating loans are defined as those used primarily to finance current crop production expenses and the care and feeding of livestock (including poultry). The most recent survey results suggest an average interest rate of 4.76% for the St. Louis region and 4.34% for the Chicago region. The rates are the lowest recorded in more than 50 years. It should be noted, that this outlook noted the same thing last year at this time. Interest rates have remained at historically low levels.
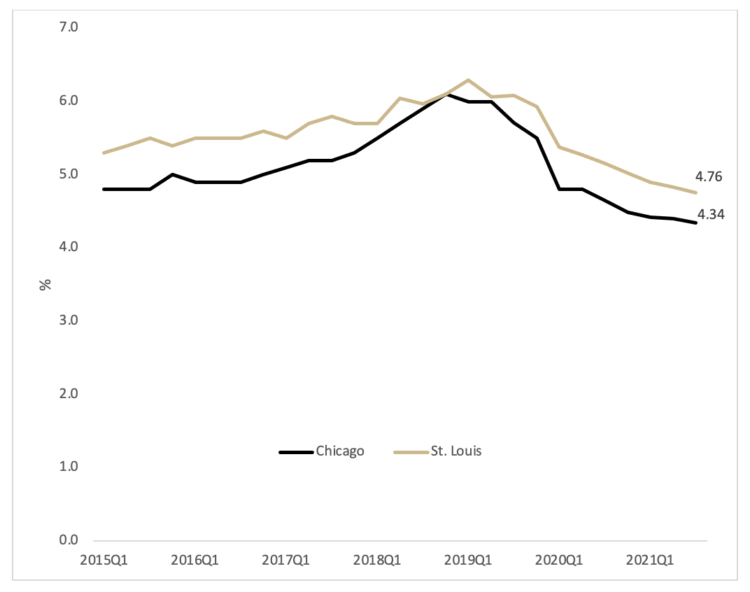
Figure 2 Average Fixed Interest Rate on Operating Loans, 2015Q1 – 2021Q3
Figure 3 similarly plots the average fixed interest rates on long-term farm real estate loans. The most recent survey results suggest an average farm mortgage rate of 4.34% in the St. Louis Fed district and 4.01% in the Chicago Fed district. Again, the rates are at the lowest recorded in more than 50 years.
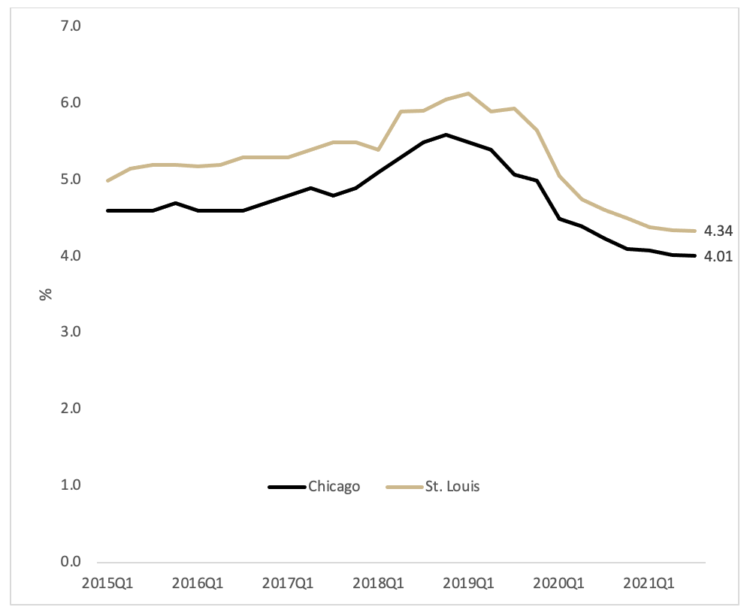
Figure 3 Average Fixed Interest Rate on Long Term Farm Real Estate Loans, 2015Q1 – 2021Q3
The decline in interest rates through 2021 has been a result of the lingering impacts that the COVID-19 pandemic has had on the economy. The Federal Open Market Committee (FOMC) lowered the federal funds rate in early 2020 in response to the onset of the pandemic. The federal funds rate has not been increased since. The FOMC sets the federal funds rate, the rate at which commercial banks borrow and lend their excess reserves to each other overnight, in an effort to control unemployment and inflation. Given the increase in inflation, it is speculated that the FOMC will once again increase the federal funds rate. However, the expectation is for a moderated approach to the increase. While this may cause some concerned for more leveraged borrowers, in the short-term, interest rates appear to be well positioned to stay at the historical lows we currently see. However, in the long-term, the FOMC may take actions that increase interest rates in the foreseeable future.
Demand for Loans
The Federal Reserve Bank surveys ask agricultural bankers to rate the demand for loans at their institution relative to a year earlier. Respondents report whether the demand for loans is “higher,” “lower,” or the “same.” These responses are summarized by a loan demand index, calculated as the share of lenders reporting “higher” minus those reporting “lower” plus 100. Thus, when the loan demand index is less than 100, the demand for agricultural loans is decreasing. Figure 4 shows that the demand for agricultural loans decreased in 2021 relative to 2020, however, the St. Louis Fed reported a diffusion index of 105 for the third quarter of 2021 which indicates a weak sentiment for stronger demand for agricultural loans. The Chicago Fed reported a diffusion index of 78 which indicates a lower demand for farm loans.
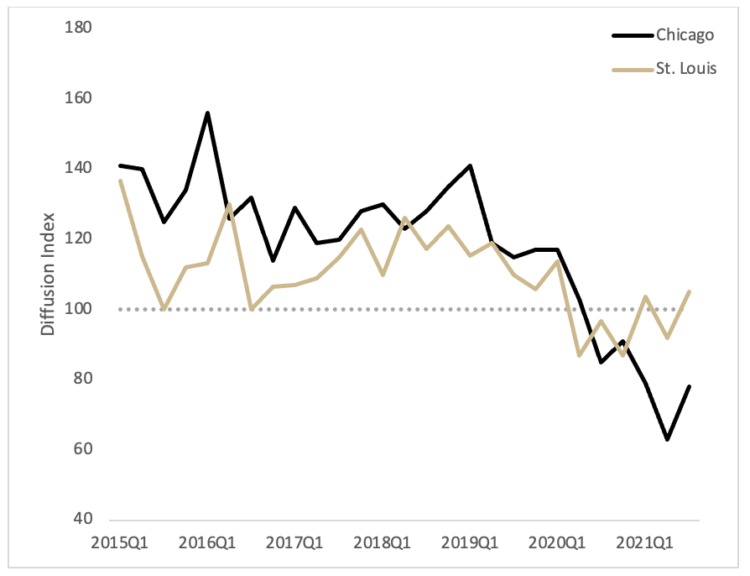
Figure 4 Demand for Agricultural Loans, 2015Q1-2021Q3
It should be noted that agricultural banks are well positioned for an increase in loan demand as agricultural lenders are reporting a higher amount of available funds to loan than in previous years. The similarly constructed funds availability index for both Federal Reserve Banks is plotted in Figure 5.
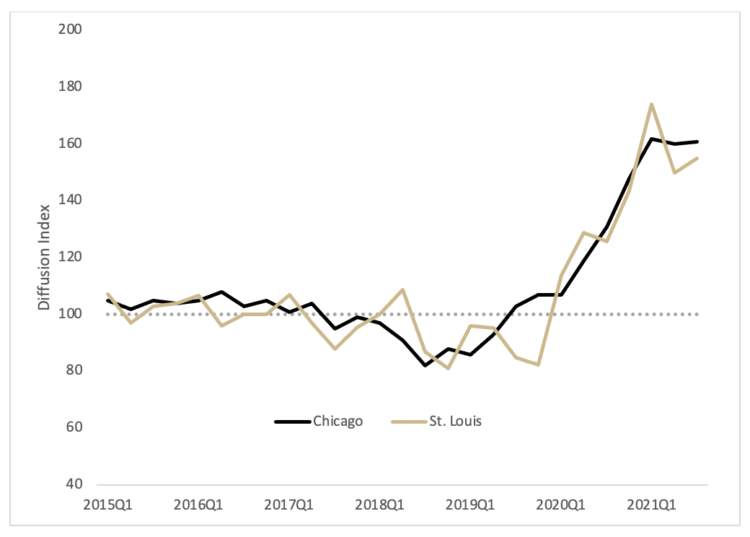
Figure 5 Availability of Funds at Agricultural Banks, 2015Q1 - 2021Q3
Non-Performing Loans
Farmers’ rate of loan repayment declined in 2021, a reversal of a positive trend that began in 2013. The index is similarly constructed based on lenders reported repayment rates relative to the same quarter of the previous year. Given that the loan repayment rate indexes for both Chicago and St. Louis Fed surveys is above 100, the indexes suggest that farmers were able to pay off a smaller portion of their debt. Loan repayment rates are the worse they have been over the past seven years. This suggests that repayment rates may be slowing across the region and should provide some caution for the agricultural finance sector.
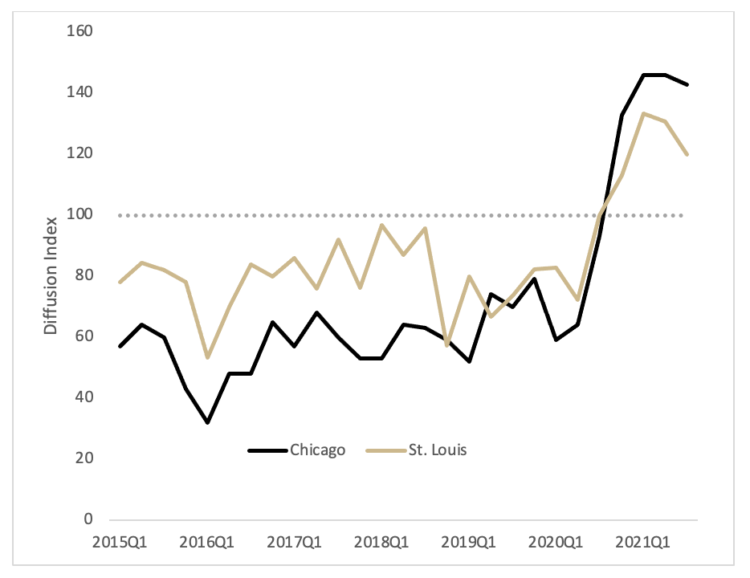
Figure 6 Loan Repayment Index, 2105Q1 – 2021Q3
Overall, the agricultural credit market is riding several positive trends into 2022. Farmers are likely optimistic that interest rates will remain at or near all-time lows, which supports the acquisition of new capital assets. If farm loan demand increases, banks appear to have a sufficient stockpile of funds available to loan. However, there are some negatives at the moment as bankers are reporting higher rates of non-payment from farmers. This would indicate that the liquidity positions of farmers may be deteriorating as they have less cash on hand to pay off current debts. Over the past several years, there have been high levels of uncertainty in the agricultural commodity markets due to the COVID-19 pandemic, political disputes, and supply chain issues. While these are expected to continue at least in the near future, the agricultural credit sector does not have as many concerns. Deteriorating liquidity among farmers and uncertain Fed policy are key drivers to how 2022 will shape the farmers and banks balance sheet alike.
References
Oppedahl, D. (2021) “Farmland Values and Credit Conditions” AgLetter No. 1990, Federal Reserve Bank of Chicago.
Federal Reserve Bank of Kansas City (2021) “Ag Finance Updates” Third Quarter Federal Reserve District Ag Credit Surveys.
![]()
![]()
![]()
![]()
![]()