Farmland Assessments and Tax Bills in 2021 and Beyond
October 7, 2020
PAER-2020-12
Authors: Larry DeBoer, Professor and Tamara Ogle, Purdue Extension Community Development Regional Educator
![]()
![]()
![]()
![]()
![]()
The assessed value of farmland will fall for property taxes in 2021, and almost certainly again in 2022. This will reduce tax bills for most farmland owners in 2021. Tax bills in 2022, though, depend on the course of the corona-recession.
The assessed value of farmland in Indiana peaked for taxes in 2015 and 2016, and has been falling in the years since. The reason is the fall of the base rate of farmland, which is the starting point for setting the assessed value of farmland for the property tax. The Indiana Department of Local Government Finance (DLGF) sets the base rate each year, at the beginning of January. Local assessors multiply this dollar figure by a soil productivity index for each acre, so that the assessed value is higher for more productive land, and lower for less productive land. An influence factor is applied to some acreage, to reduce assessments for factors such as frequent flooding or forest cover. The resulting assessed value is multiplied by the sum of the tax rates of the county, school district, and other units in which the acreage is located, to determine the tax bill.
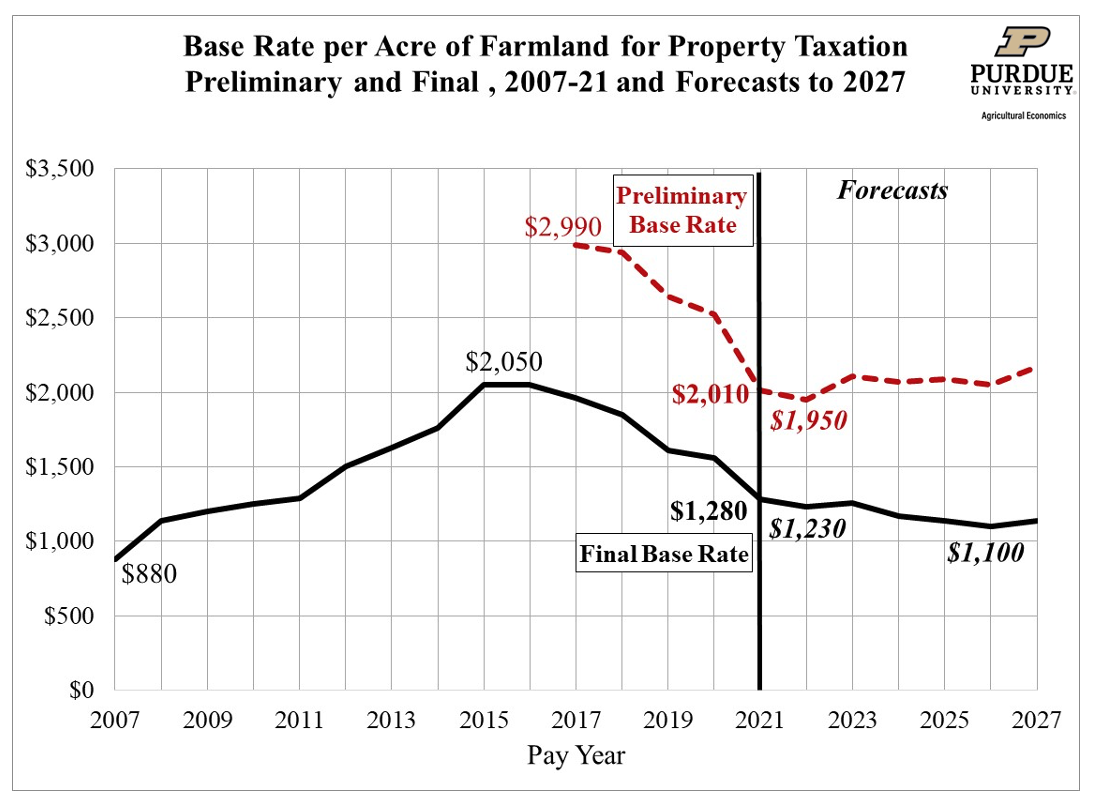
Figure 1.
The Base Rate for Taxes in 2021
In January, the DLGF announced the base rate for farmland for 2020, to be used for tax bills next year, 2021. It was $1,280 per acre, down 17.9% from $1,560 an acre for taxes this year. This continued five years of substantial drops in the base rate. It was $2,050 in 2016, so it’s down 38% since then (Figure 1).
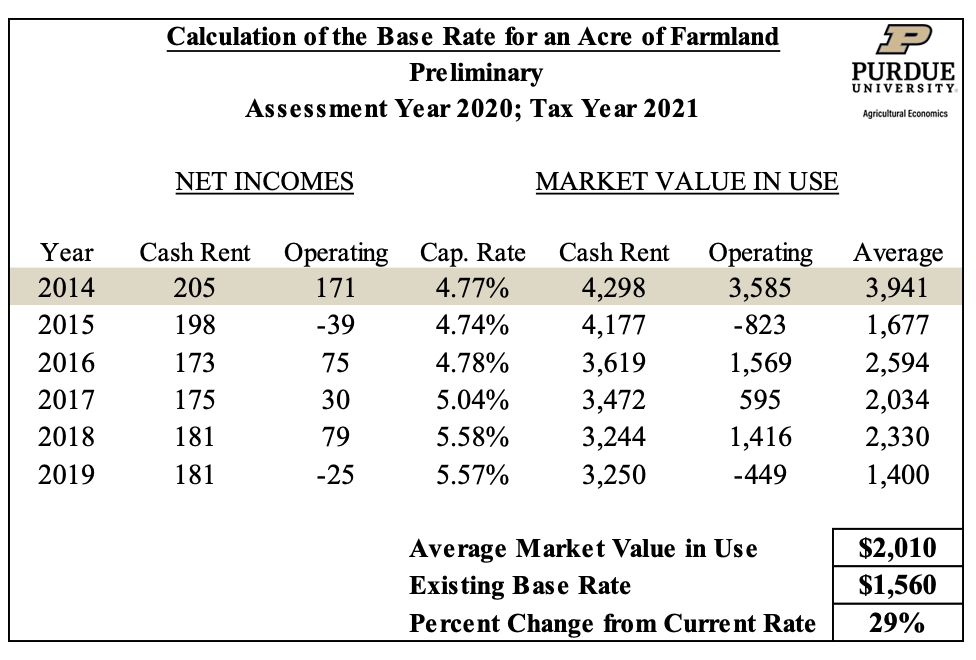
Table 1.1
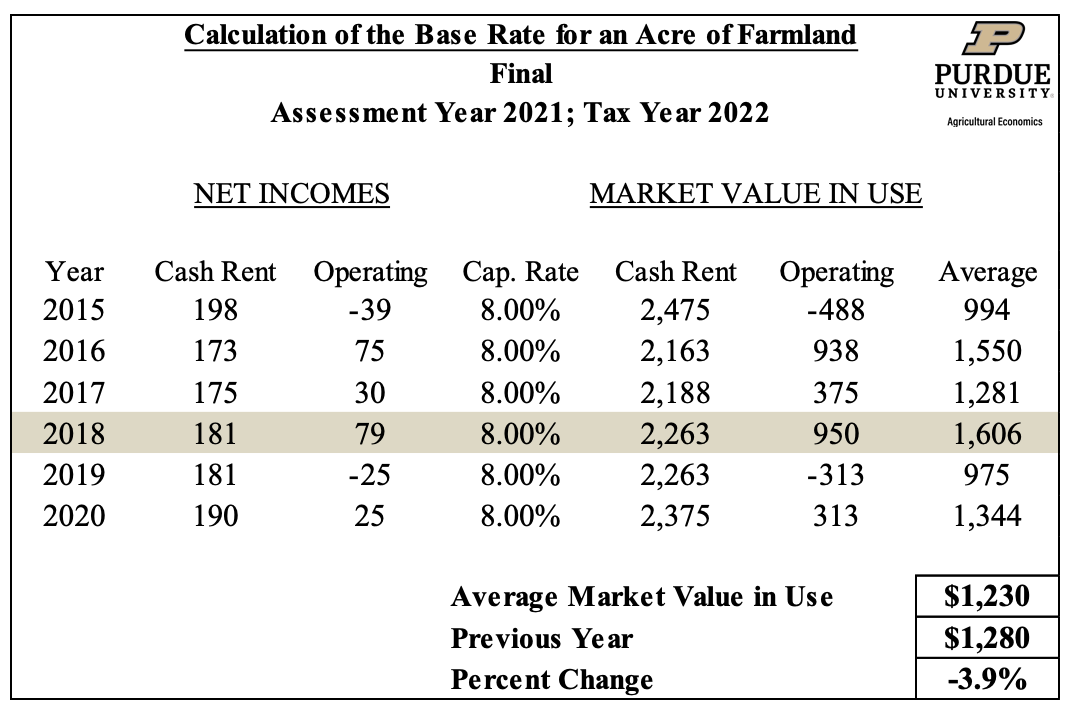
Table 1.2
Table 1 shows how the DLGF calculated the base rate for 2020 pay-2021, that is, the base rate for 2020 to be used for tax bills in 2021. It’s a capitalization formula, which means a measure of income is divided by a rate of return, to estimate the maximum price an investor would pay for an asset such as an acre of farmland. The formula uses the most recent six years of data available. Since the calculation was done at the end of 2019, data for 2014 through 2019 were used. There’s always a two-year lag between the last year of data and the year the base rate is used to calculate taxes. The DLGF documents the data they use each year, on their website at www.in.gov/dlgf/7016.htm.
The formula has a preliminary and a final step. Both use two measures of income. Cash rent income is the average rent for an average acre, from the Purdue Department of Agricultural Economics’ annual Land Values and Cash Rents survey, which is published in the Purdue Agricultural Economics Report each summer. Average property tax payments are subtracted. Operating income is calculated as price times yield, plus government payments, less costs, averaged for corn and soybeans.
The average of the real estate and operating loan interest rates is used as the capitalization rate in the preliminary calculation. Cash rent and operating income are divided by this rate for each year, giving the “market value in use” for both. These two numbers are averaged for all six years. Then the highest figure is dropped and the remaining five are averaged to get the preliminary average market value in use, which is the base rate. For pay-2021 it was $2,010, much higher than the final pay-2020 base rate of $1,560. That’s where the final calculation comes in.
The preliminary base rate is compared to the existing base rate. If the preliminary rate is more than 10% above the existing rate, a capitalization rate of 8% is used in the final calculation, for all 6 years. If the preliminary rate is within 10% of the existing rate, the capitalization rate is 7%. If the preliminary rate is more than 10% below the existing rate, the capitalization rate is 6%. The pay-2021 preliminary base rate of $2,010 was 29% higher than the $1,560 existing pay-2020 rate, so the capitalization rate was set at 8% for the final step.
That 8% rate was much higher than the actual real estate and operating loan interest rates, so the calculations of all six years of market value in use were lower than in the preliminary calculation. The highest value was dropped—from 2014—and the remaining 5 averaged to $1,280. This is the final base rate, for taxes in 2021.
The Future of the Base Rate
The base rate is a rolling average. At the end of December, the DLGF will calculate the base rate for 2021 pay-2022 by dropping the data for 2014, and adding the new data for 2020. Five of the six entries in that base rate average are already set (though there may be slight revisions in the 2019 data). To predict the base rate for pay-2022, we only need to estimate rents, prices, yields, fixed and variable costs, government payments and interest rates for this year, 2020. That’s all!
We already know rent. The PAER for July 2020 published the results of the annual value and rents survey. The pay-2022 base rate estimate uses the June 2020 statewide cash rent for the average land class, which was $217 per acre. An estimate of the statewide property tax per acre is subtracted for the calculation. We estimate property taxes per acre at $27, so the after-tax rent is $190.
Looking at the operating costs for 2020, we already know some of the numbers. The overhead and variable costs come from Purdue Crop Cost and Return guide published by the Center for Commercial Agriculture each spring. Corn and bean prices in the formula are an average of the calendar year average price, the previous marketing year average and the November price. We know prices for some of the months and used the Center for Commercial Agriculture’s crop basis tool with futures prices to forecast the rest. Their price predictions for the 2020 formula are $3.54 per bushel for corn and $8.77 for soybeans . These prices are lower for soybeans than in 2015 through 2019 and in the lower end of the range for corn, the same years. We adjusted yield predictions from FAPRI, the Food and Agricultural Policy Research Institute at the University of Missouri, to Indiana’s trend to predict corn yield at 180 bushels per acre and soybean yield at 55.
The capitalization rate will be 8% in the final calculation. We can count on the final capitalization rate remaining at 8% through the whole coming decade. This is mainly because actual interest rates are very likely to remain low. It is an oddity of the base rate formula that low actual interest rates cause the final cap rate to be as high as possible.
Interest rates are in the denominator of the capitalization formula. When actual interest rates are low, the preliminary base rate calculation is high. When it is more than 10% higher than the existing base rate, the cap rate is set at 8%.
Over the past 5 years, the preliminary base rate has averaged 45% above the existing base rate. Since actual interest rates were higher during those 5 years than they are projected to be in coming years, the preliminary base rate will be even higher relative to the existing base rate well into the 2020’s. So the formula will continue to set the cap rate at 8%. This is fortunate from a forecasting point of view. Since actual interest rates don’t enter the final calculation, there is one less data entry to predict, and therefore one less source of error.
Our forecast for the pay-2022 final calculation is in Table 2. The rolling average drops the 2014 value, but this also was the highest value for the previous year, which was excluded from the average. The new highest value is $1,606 from 2018. Since the new 2020 value of $1,344 is less than that, the base rate declines to $1,230. That’s 3.9% lower than the pay-2021 base rate.
We extended our base rate per acre predictions through 2027 which means we need predicted market value in use data through 2025. For prices, yields, variable costs, and government payments beyond 2020 we use the FAPRI forecasts adjusted for Indiana. FAPRI published an update of their baseline forecast in June of 2020, available on their website at www.fapri.missouri.edu.
FAPRI predicts continued lower commodity prices through the 2020’s. Yields continue on their long-term upward trend. Government payments are more challenging to forecast, but FAPRI predicts them to stay around $20 per acre after 2020. Variable costs for both corn and soybeans decreased in 2020 and are estimated to dip again before steadily increasing in the long run. We expect overhead costs to increase steadily at 1.5% a year. We forecasted cash rents for 2021-2025 using a regression with lagged cash rent, November soybean price and soybean yield. The model shows cash rents dropping in 2021-2022 before stabilizing around $190 per acre.
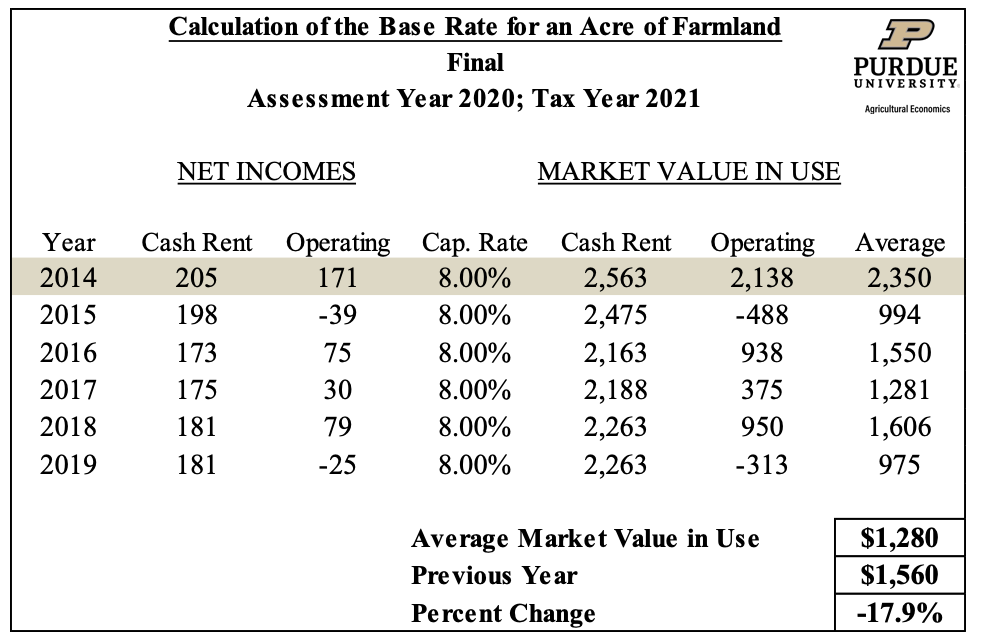
Table 2.
As we move forward, of course, known market value in use numbers drop from the average, to be replaced with predictions. The 2027 base rate will use data from the years 2020 through 2025—in other words, six predicted values. It’s probably best to stop there. Table 3 shows the base rate predictions through pay-2027. The final base rate remains under $1,280 throughout.
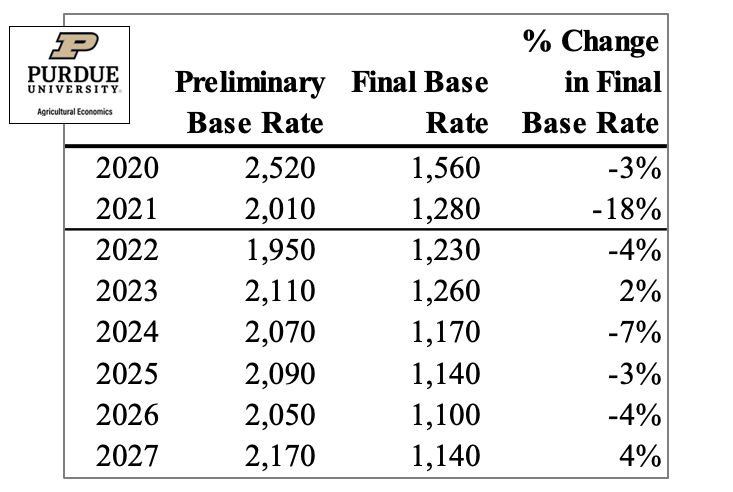
Table 3.
Tax Bills and the Corona-Recession
The drop in the base rate for pay-2021, already set by the DLGF, will probably mean lower property tax bills for most farmland owners. We predict another drop in the base rate for pay-2021, but tax bills that year depend on how the corona-recession affects residential, commercial, and industrial property values.
Assessed values in 2020 will be used to set tax bills in 2021. Those assessments are based on property values in 2019. Assessors used property selling prices and replacement costs from 2019 to set assessed values in 2020. Since those values were from the last year of the long economic expansion, most will be higher than they were in 2018. The assessed values of residential, commercial, and industrial property probably will rise for taxes in 2021, in most places.
The revenue collected from the property tax is called the tax levy. For each local government unit, the increase in this levy is limited by the state’s maximum levy growth quotient (MLGQ). This rate is based on the six-year average of non-farm personal income growth. The six years used for the MLGQ for 2021 are 2014 through 2019—before the recession. The DLGF has already set the 2021 quotient at 4.2%.
Each local government unit recalculates tax rates each year, by dividing the budgeted levy by taxable assessed value. Total taxable assessed value growth averaged 2.5% per year in the second half of the 20-teens expansion. If that continued for another year, and levies rise with the MLGQ, 4.2%, average tax rates will rise by about 1.7%. Tax bills are the product of taxable assessed value and the property tax rate. The base rate of farmland will fall 17.9%, so a tax rate rise of 1.7% will leave little doubt that almost all farmland owners will see tax bill reductions in 2021.
Pay-2022 is a different story. That’s the year that 2020 values will enter the base rate formula, and the taxable assessed value of property, and the MLGQ 6-year average income growth. We predict a 3.9% decline in the base rate. What might happen to the average property tax rate?
Assessed values are vulnerable to recession. In recessions, the values of homes, business buildings, and business equipment tend to fall, and new construction and purchases are reduced. If this happens in 2020, assessors will record the changes in 2021, and lower assessed values will be used for tax bills in 2022.
We have experience with only one recession since the current assessment procedures came into use. That was the Great Recession of 2007-2009. Figure 2 shows what happened to gross assessed values in pay-2010 through pay-2013. The later years account for the two year lag between economic events and tax bills. Gross assessed values are those determined by local assessors. Deductions are subtracted to get taxable (or net) assessed value. Deductions are affected by policy changes, so gross assessed value is the better measure of a recession’s effect.
Statewide, gross assessed value fell in 2011 and 2013, and barely increased in 2012. More than two-thirds of Indiana counties experienced at least one year of assessed value decline, and in 2013 alone, 54 counties saw their assessed values drop.
Many of the counties that saw assessments rise were rural, where farmland is a large share of assessed value. The farmland base rate was rising rapidly during 2010-13 (Figure 1). We know that will not happen again. Rural county assessments will behave more like urban and suburban counties this time.
So assessed values can fall or grow slowly after recessions. Will they fall after the corona-recession? Perhaps not. The Great Recession began with a housing crisis. Home values fell, and home construction dropped even more. This does not appear to be happening in 2020. Instead, retail and commercial real estate may be affected. Sales at restaurants, clothing stores, electronics stores, and gas stations are down. Telecommuting may reduce the demand for office space. If these changes affect property values, construction and equipment purchases in 2020, assessments could fall in 2021, and tax bills would be affected in 2022.
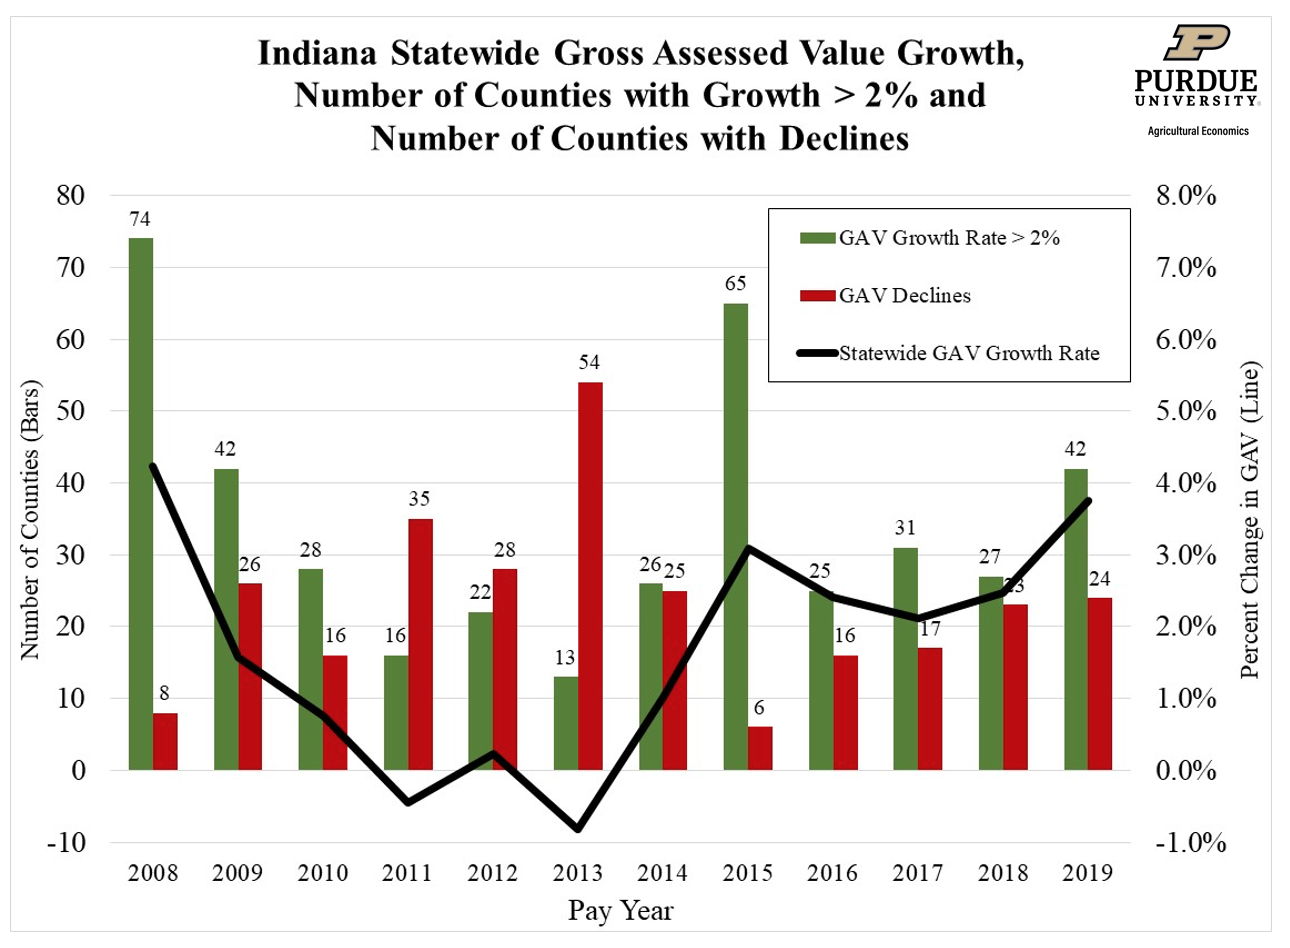
Figure 2.
Incomes fall during recessions. The MLGQ fell after the Great Recession. It dropped below 3% from 2011 to 2016, then rebounded to near 4% in 2017. That’s the year when the 2009 income decline finally left the formula. Unemployment is up and pay is down in 2020, which should reduce income growth. However, the CARES act delivered more than $2 trillion in additional unemployment benefits and direct aid to individuals. Total income has increased from 2019 as a result. It’s possible that the MLGQ will not fall as much in 2022 as it did in 2011.
If taxable assessed values do not grow for pay-2022, while the MLGQ rises between 3% and 4%, tax rates will also increase 3% to 4%. We predict the pay-2022 base rate of farmland will fall by 3.9%. This drop could be offset by a rise in tax rates. Rate changes will vary with levy and assessed value changes in each county, school district and other local unit. In 2022, some farmland owners will see tax bill reductions, but others will see tax bills rise.
![]()
![]()
![]()
![]()
![]()
