Indiana Farm’s Financial Health in Light of Economic Uncertainties
May 10, 2023
PAER-2023-23
Hari P. Regmi, Agricultural Economics doctoral student
![]()
![]()
![]()
![]()
![]()
Introduction
This report evaluates the financial performance and position of Indiana farms relative to those in the Midwest and U.S. to gauge the standing of Indiana’s farms in relative terms. We analyze four financial ratios to measure farm financial performance with respect to efficiency, liquidity, profitability, and solvency. USDA-Economic Research Service (ERS) provides detail documentation for the farm sector financial ratios (USDA-ERS, 2023). In this report, we use publicly available USDA-Agricultural Resource Management Survey (ARMS) summary data for Indiana, the Midwest region, and the US to compare the financial conduct and performance of Indiana farms.
Efficiency ratio
Efficiency ratios measure a farms’ ability to use its assets to generate revenue. Efficiency ratios are important because an improvement in efficiency ratios usually translates to improved profitability. The operating expense ratio is one of the most commonly used efficiency ratios. The operating expense ratio is calculated as follows:
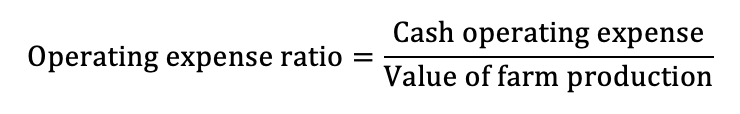
Operating expense ratio = (Cash operating expense) / (Value of farm production)
The operating expense ratio measures the extent to which the cash income generated by the farm business is absorbed by the cost of production for the specific year. A lower value of operating expense ratio is preferred because the lower the ratio, the more effective the farm in generating returns. Figure 1 shows the operating expense ratio for Indiana, Midwest, and US farms from 2012 through 2021. We find that the operating ratio for Indiana, Midwest, and US farms consistently increased from 2014, reached to the highest point (83.8 %) in 2019 and then started to decline. Indiana farms’ operating expense ratio was higher relative to the Midwest farms and US farms for all years (except for 2014 and 2018). We find that Indiana farms were relatively less efficient than Midwest and US farms as measured by operating expense ratio. For 2021, the latest year with available data, operating expense ratio for Indiana farms, Midwest farms, and US farms were 73.8%, 70.3%, and 72.3%, respectively. This shows that while the ratio was higher in previous years, Indiana farms are comparable to other farms across the region and country.
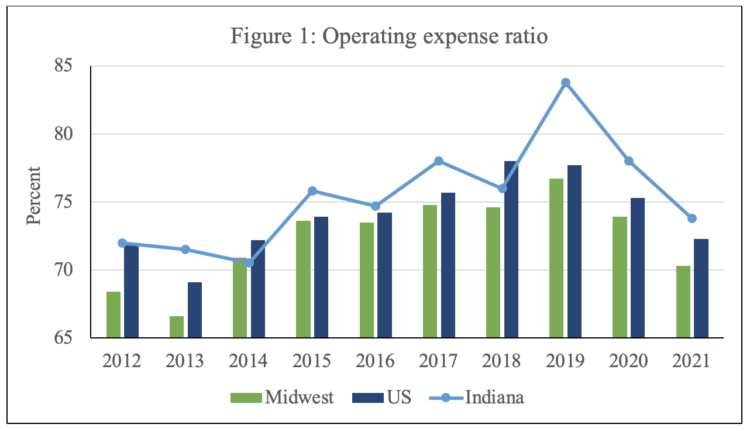
Figure 1: Operating expense ratio
Liquidity ratio
Liquidity refers to the ease with which farm assets can be converted into cash to meet farm expenses and debt payments. Liquidity ratios indicate farm’s ability to cover short-term obligations as the payments come due. We analyze one of the most commonly used liquidity measures, current ratio. Mathematically,

Current ratio = (Current assets) / (Current liabilities)
Figure 2 shows the current ratio for Indiana, Midwest and US farms from 2012 through 2021. A higher value (generally, above two) of current ratio is preferred because it indicates that the farm is more liquid and has better coverage of outstanding short-term debts. A current ratio value of below one indicates financial stress, while between one and two is considered acceptable (FFSC, 2022). In general, Indiana farms, Midwest farms and US farms had current ratio above the acceptable threshold of one in the past ten years. For 2021, the latest year with available data, current ratio for Indiana farms, Midwest farms, and US farms were 3, 2.6, and 2.8, respectively. Indiana farms were able to maintain the highest current ratio (3) for 2021 as the economy have been recovered from the COVID-19 pandemic.
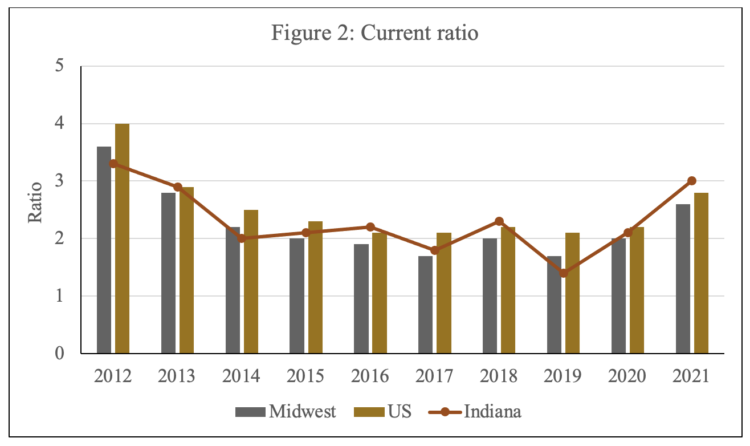
Figure 2: Current ratio
Profitability ratio
Farm profitability refers to the farm sector’s ability to generate returns from production inputs. Net farm income, which is the leftover income after all the factors of production are paid, is one of the commonly used indicators of farm profitability. However, it is difficult to benchmark net farm income because of differences in farm size and scales of operation (Chandio et al., 2022). We use one of the most commonly analyzed profitability indicators, operating profit margin (OPM), which accounts for scale of farm operations, as captured by farm profitability per unit of output. The operating Profit margin is calculated as follows:

OPM = (Net farm income + interest expense – Return to unpaid labor and management ) / (Value of production + government payments)
Figure 3 shows the operating profit margin for Indiana, Midwest, and US farms. Higher value of operating profit margin is preferred (> 25%). ERS categorizes farm operations as low risk (OPM 25%), moderate risk (10% ≤ OPM < 25%), and high risk (OPM< 10%) based on OPM. The operating margin indicators show that farms in Indiana, Midwest, and US were under moderate to high risk for most of the past ten years. Although Indiana farms had relatively higher operating profit margin (except for in 2019) compared to Midwest and US farms, Indiana farms were still in the high-risk zone for most of the past 10 years. Despite the effect of COVID-19 pandemic, in 2021, Indiana farms operating margin improved (10.7%).
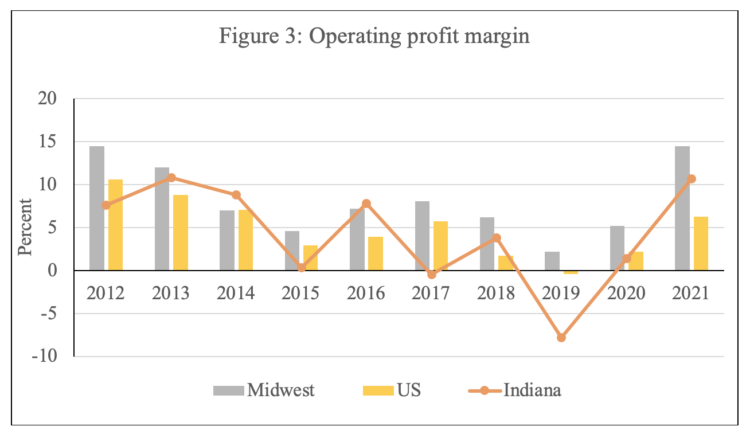
Figure 3: Operating profit margin
Solvency ratio
Solvency ratios show farms’ ability to satisfy its debt obligations. Solvency indicators are often referred to as leverage ratios and indicate the degree to which the farm is able to pay all of its financial liabilities by selling all assets. Solvency indicators are particularly important to understand farm financial risk and borrowing capacity. We use debt-to-asset ratio as a measure of farm solvency. Debt-to-asset ratio measures the proportion of farms’ assets owed to the lender to cover debt obligations.
Debt-to-asset ratio = (Total farm debt) / (Total farm assets)
Figure 4 shows debt to asset ratio for Indiana, Midwest, and US farms for the past ten years. Debt-to-asset ratio equal to one indicates that all farm assets are financed by debt. Higher debt-to-asset ratio indicate a lower level of solvency, thus lower ratio (generally below 30) is preferred. We find that Indiana, Midwest, and US farms debt to asset ratio were relatively stable and under 30% over the last ten-year (from 2012 through 2021). Indiana farms had higher debt-to-asset ratio relative to Midwest and US farms for most of the years over the past ten-year period. However, we find that Indiana farms had lower debt-to-asset ratio (9.1) for 2021 relative to Midwest farms (10).
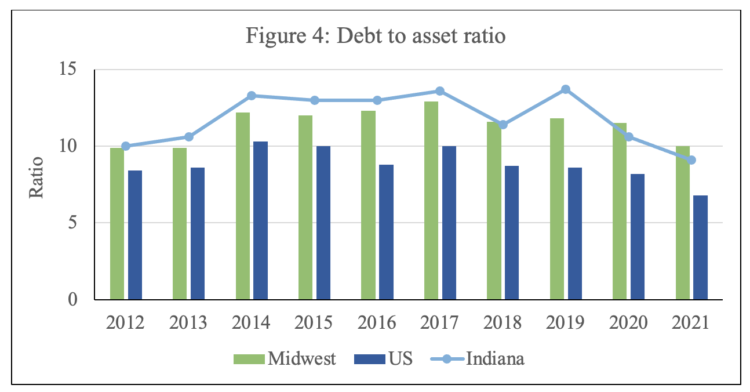
Figure 4: Debt to asset ratio
Conclusions
We discuss multiple financial ratios of Indiana, Midwest, and US farms focusing on four indicators of farm financial performance: Efficiency, Liquidity, Proficiency, and Solvency. These measures can be used to track Indiana farms’ relative performance and to identify the areas for improvement or take initiative actions to improve performance. We find that Indiana farms were relatively stable according to liquidity and solvency indicators. However, Indiana farms were relatively less efficient than Midwest and US farms measured by operating expense ratio. Further, profitability indicators (measured by operating profit margin) for Indiana farms were more uneven for the past ten years with the largest profit loss in 2019. Recently, Giri et al., (2022) also indicate that at the national level, most of the financial ratios for 2020 were weaker than their respective average over the twenty-year average (2000-2019). In light of increased interest expense due to tighter monetary policies of the Federal Reserve and forecasted decrease (at national level) of farm income, Indiana farms might need to find ways to increase efficiency. While the financial conduct and position of Indiana farms for the most part are not worrisome, it seems that farm operators might need to carefully engage in risk management strategies.
References
Chandio, R. H.Wu, A.L.Katchova, A.K.Giri, and D. Subedi. 2022.“Benchmarking Ohio Farms’ Financial Health.” Available on OhioFarmsFinancialsARMS.pdf (osu.edu)
Farm Financial Standards Council “Financial Guidelines for Agriculture.” 2022. ⟨ Council Updates Financial Guidelines Documents – Farm Financial Standards Council (ffsc.org)⟩
Giri, A.K, C. Litkowski, D. Subedi, and T. McDonald. 2022. “COVID-19 Working Paper: Farm Sector Financial Ratios: Pre-COVID Forecasts and Pandemic Performance For 2020”. Available on https://www.ers.usda.gov/publications/pub-details/?pubid=104535
USDA-Economic Research Service. 2023a. Farm Income and Wealth Statistics-Documentation for the Farm Sector Financial Ratios. Available on https://www.ers.usda.gov/data-products/farm-income-and-wealth-statistics/documentation-for-the-farm-sector-financial-ratios/#trrfe
![]()
![]()
![]()
![]()
![]()