Indiana’s Farmland Market Holds Steady as Regions Swap Places
August 17, 2026
PAER-2026-24
Todd Kuethe, Schrader Chair in Farmland Economics & Professor of Agricultural Economics


Statewide farmland prices were fairly stable in 2026 with slight rises and falls across quality grades, according to the latest Purdue Farmland Values and Cash Rents Survey. The average price of top quality farmland is $14,909, up 0.6 percent from June 2025 (Table 1a). The average price of average quality farmland, on the other hand, declined by 1.1 percent from June 2025, at $12,121 per acre. The average price of poor quality farmland dipped even further, at 3.1 percent to $9,460. This adjustment follows modest statewide gains in 2024 and 2025 that, as in 2026, masked significant divergence across regions. The farmland market across Indiana most closely mirrors the experiences of 2014 to 2019, where prices moderated following the boom of 2007 to 2013.
Table 1a
Average estimated Indiana land value1 per acre (tillable, bare land), statewide, June 2026
| Class | Land Value Corn Bu/A |
Land Value June 2025 |
Land Value Dec 2025 |
Land Value June 2026 |
Land Value % change 6/25-6/26 |
Land Value % change 6/25-12/26 |
Land Value % change 12/25-6/26 |
Land Value/bu $/bu 2025 |
Land Value/bu $/bu 2026 |
Projected Land Value Dec 2026 |
Projected Land Value % change 6/26-12/26 |
|---|---|---|---|---|---|---|---|---|---|---|---|
|
Top |
237 | 14,826 | 15,182 | 14,909 | 0.6 | –0.1 | –1.8 | 64.45 | 62.92 | 14,809 | –0.7 |
|
Average |
208 | 12,254 | 12,345 | 12,121 | –1.1 | –2.1 | –1.8 | 61.51 | 58.25 | 11,992 | –1.1 |
|
Poor |
179 | 9,761 | 9,747 | 9,460 | –3.1 | –4.2 | –2.9 | 57.46 | 52.88 | 9,355 | –1.1 |
|
Transition2 |
— | 29,043 | 26,981 | 27,260 | –6.1 | –5.1 | 1.0 | — | — | 27,567 | 1.1 |
|
Recreation3 |
— | 9,542 | 9,277 | 9043 | –5.2 | –5.6 | –2.5 | — | — | 9,009 | –0.4 |
Footnotes:
1 The land values contained in this summary represent averages over several different locations and soil types. Determining the value for a specific property requires more information than is contained in this report and should include an evaluation by a professional appraiser.
2 Transition land is land moving out of production agriculture into other, typically higher value, uses.
3 Recreation land is land located in rural areas used for hunting and other recreational uses.
At the regional level, farmland prices exhibited more pronounced changes, but similar to the 2014 to 2019 adjustment period, both positive and negative adjustments were observed across regions and quality grades (Table 1b). There are caveats that must be made, especially in times of adjustment, when interpreting the regional information. First, the regions may mask some of the variability across or within counties or localized impacts. This year, several respondents specifically noted high variation within their local areas — for example, differences in the pace of nearby development or in how many potential buyers remain active in a given pocket of a region. Second, the reported estimates are averages, which do not capture the dispersion of prices. Finally, the number of responses in each region is modest, so these values should be interpreted with caution. This final point is discussed in more detail at the end of the report, including opportunities for new respondents to join our survey pool.
Table 1b
Average estimated Indiana land value per acre (tillable, bare land) by geographic area, June 2026
| Area | Class | Corn Bu/A | June 2025 | June 2026 | % change 6/25-6/26 | Projected Dec 2026 | % change 6/26-12/26 | Responses |
|---|---|---|---|---|---|---|---|---|
|
North |
Top | 246 | 15,389 | 14,400 | –6.4 | 14,500 | 0.7 | 14* |
|
— |
Average | 213 | 12,333 | 10,900 | –11.6 | 10,550 | –3.2 | — |
|
— |
Poor | 183 | 9,222 | 8,417 | –8.7 | 8,300 | –1.4 | — |
|
Northeast |
Top | 234 | 15,909 | 13,696 | –13.9 | 13,867 | 1.2 | 33 |
|
— |
Average | 207 | 13,791 | 11,436 | –17.1 | 11,377 | –0.5 | — |
|
— |
Poor | 179 | 11,032 | 9,277 | –15.9 | 9,217 | –0.6 | — |
|
W. Central |
Top | 242 | 14,388 | 14,975 | 4.1 | 14,570 | –2.7 | 27 |
|
— |
Average | 214 | 11,731 | 12,458 | 6.2 | 12,160 | –2.4 | — |
|
— |
Poor | 185 | 10,135 | 10,025 | –1.1 | 9,620 | –4.0 | — |
|
Central |
Top | 236 | 15,548 | 15,730 | 1.2 | 15,545 | –1.2 | 38 |
|
— |
Average | 207 | 13,192 | 13,432 | 1.8 | 13,424 | –0.1 | — |
|
— |
Poor | 178 | 10,567 | 10,476 | –0.9 | 10,429 | –0.5 | — |
|
Southwest |
Top | 224 | 14,233 | 15,750 | 10.7 | 15,857 | 0.7 | 13* |
|
— |
Average | 192 | 10,825 | 10,875 | 0.5 | 10,714 | –1.5 | — |
|
— |
Poor | 159 | 7,488 | 7,250 | –3.2 | 7,000 | –3.4 | — |
|
Southeast |
Top | — | 10,417 | 10,500 | 0.8 | 10,500 | 0.0 | 2* |
|
— |
Average | — | 8,167 | 8,500 | 4.1 | 8,500 | 0.0 | — |
|
— |
Poor | — | 6,083 | 8,000 | 31.5 | 8,000 | 0.0 | — |
* Limited responses; Interpret with caution
Figure 1
County clusters used in Purdue Land Values survey to create geographic regions
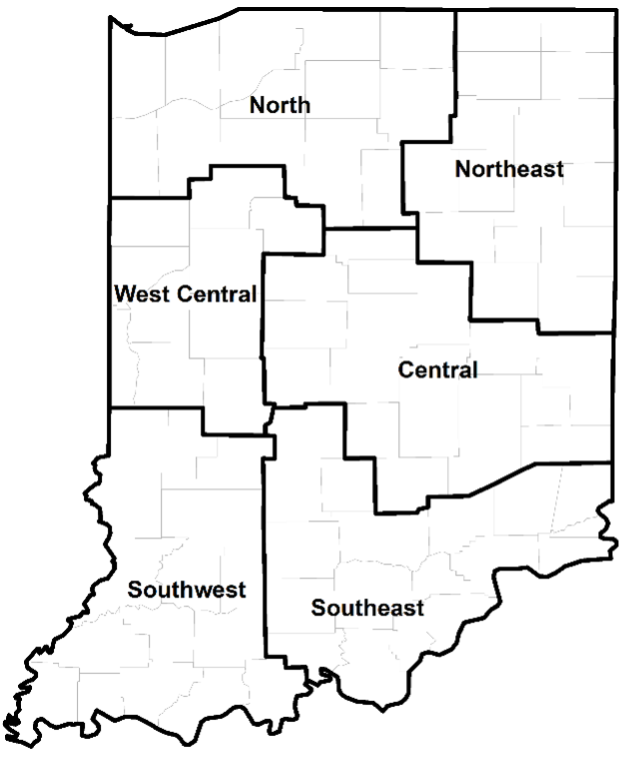
With these caveats in mind, the North and Northeast posted the steepest declines in 2026, falling by 6.4 to 11.6 percent in the North and 13.9 to 17.1 percent in the Northeast. It is important to note that in 2025, these regions exhibited the highest percentage increases. The Southwest region posted the largest price increases in 2026, with top quality at 10.7 percent, continuing the seesaw pattern of decline, rise, and decline beginning in 2023. Farmland prices in the Southeast region also increased after declining in both 2025 and 2024. Thus, the Indiana farmland market may still be adjusting to the dramatic shift of the 2020 to 2022 boom, as regions with the strongest prior price increases are now witnessing the most pronounced softening, and vice versa.
On a statewide basis, the value of land transitioning out of agricultural production (Table 1a) continued to decline to $27,260 per acre, down 6.1 percent from 2025. Again, a couple of caveats are worth noting. First, the survey asks for the average value of land “transitioning out of production agriculture and moving into residential, commercial, or industrial uses.” Many of our respondents noted that lumping residential, commercial, and industrial use is difficult given the wide disparity in development pressure across these activities. Second, these statewide estimates again mask regional variability. Many respondents noted the pressures of large-scale development projects in their areas, while at least one other said there is “VERY little development demand” in their market area. The price of recreational lands across the state also declined, to $9,043, down 5.2 percent from 2025.
Farmland Market Forces
Respondents were asked to evaluate the importance of eleven market forces that may potentially influence the farmland market: (1) current net farm income, (2) expected growth rate in farm returns, (3) crop price level and outlook, (4) livestock price level and outlook, (5) current and expected interest rates, (6) returns to alternative investments, (7) outlook for U.S. agricultural export sales, (8) U.S. inflation rate, (9) cash liquidity of buyers, (10) current U.S. agricultural policy, and (11) farmland conversion to other uses. Respondents rate each market force on a scale of -5 to +5, with -5 being the strongest negative influence. A positive influence is given a value between 1 and 5, with 5 representing the strongest positive influence. A score of 0 indicates the force was not influential. An average for each item was calculated, and averages for 2024, 2025, and 2026 are included in Figure 2.
The downward pressure of a number of market forces intensified between 2025 and 2026, such as crop prices, interest rates, and agricultural exports. In addition, several factors that were positive in 2025 are negative in 2026, such as growth in returns and farmer liquidity. Only three market forces placed positive pressure on farmland prices in 2026. The strongest positive forces were livestock prices and land conversion. Inflation is characterized as a positive but moderate force.
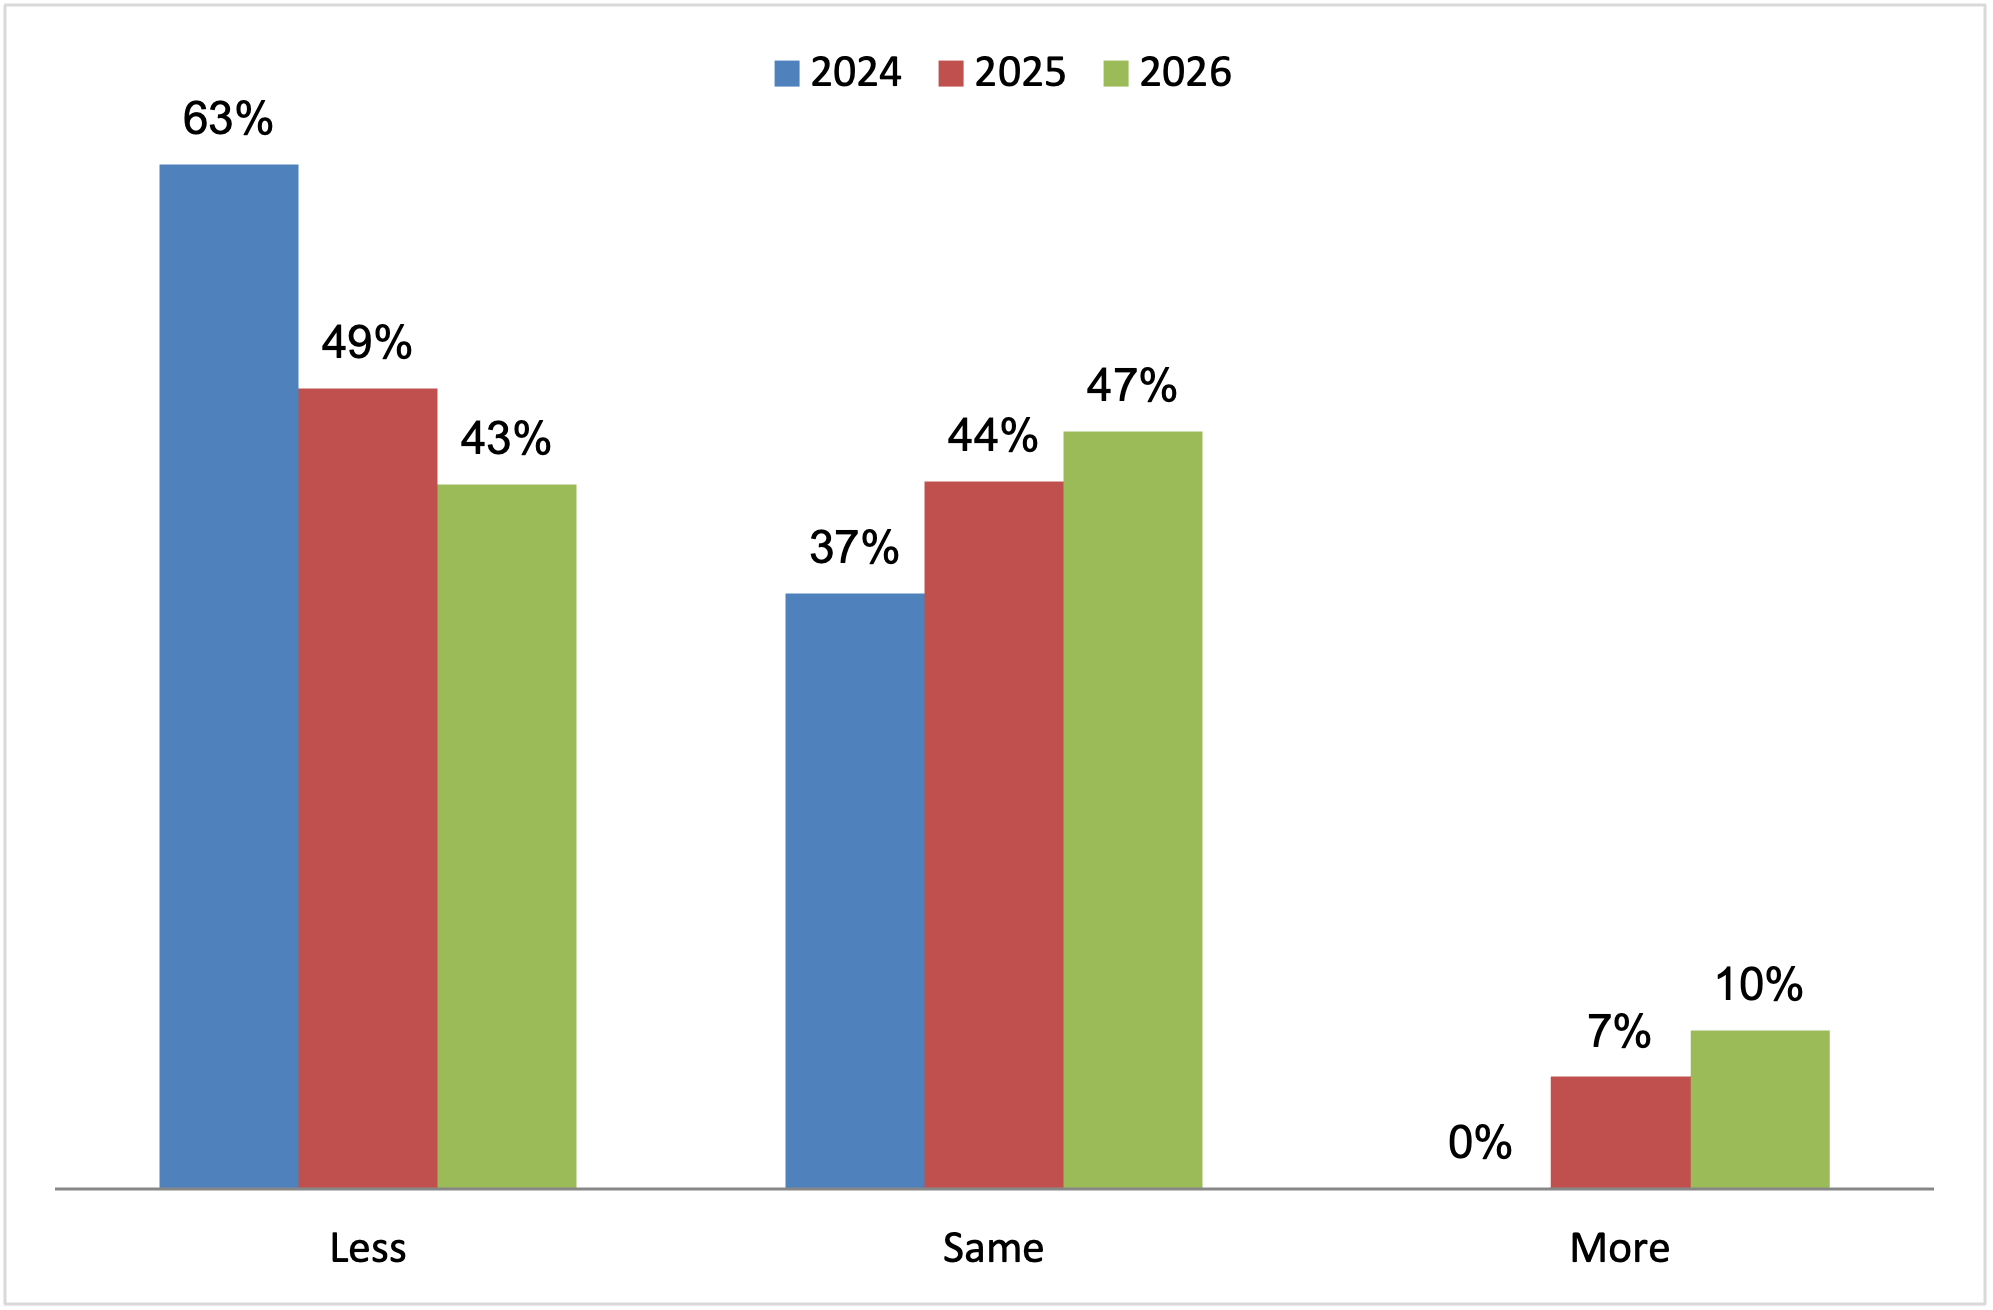
The amount of land on the market also appears stable in 2026 (Figure 3). While the number of respondents reporting “more” continues to grow, “same” remains the dominant response. At least one respondent noted that in their market area, “same” means “basically NO land changing hands.” Several respondents suggested that the pool of interested buyers is shrinking, as buyers express uncertainty, and at least one suggests that “potential sellers appear to be delaying the marketing of their properties in anticipation of a return to higher land values.”
Figure 2
Influence of drivers of Indiana farmland values
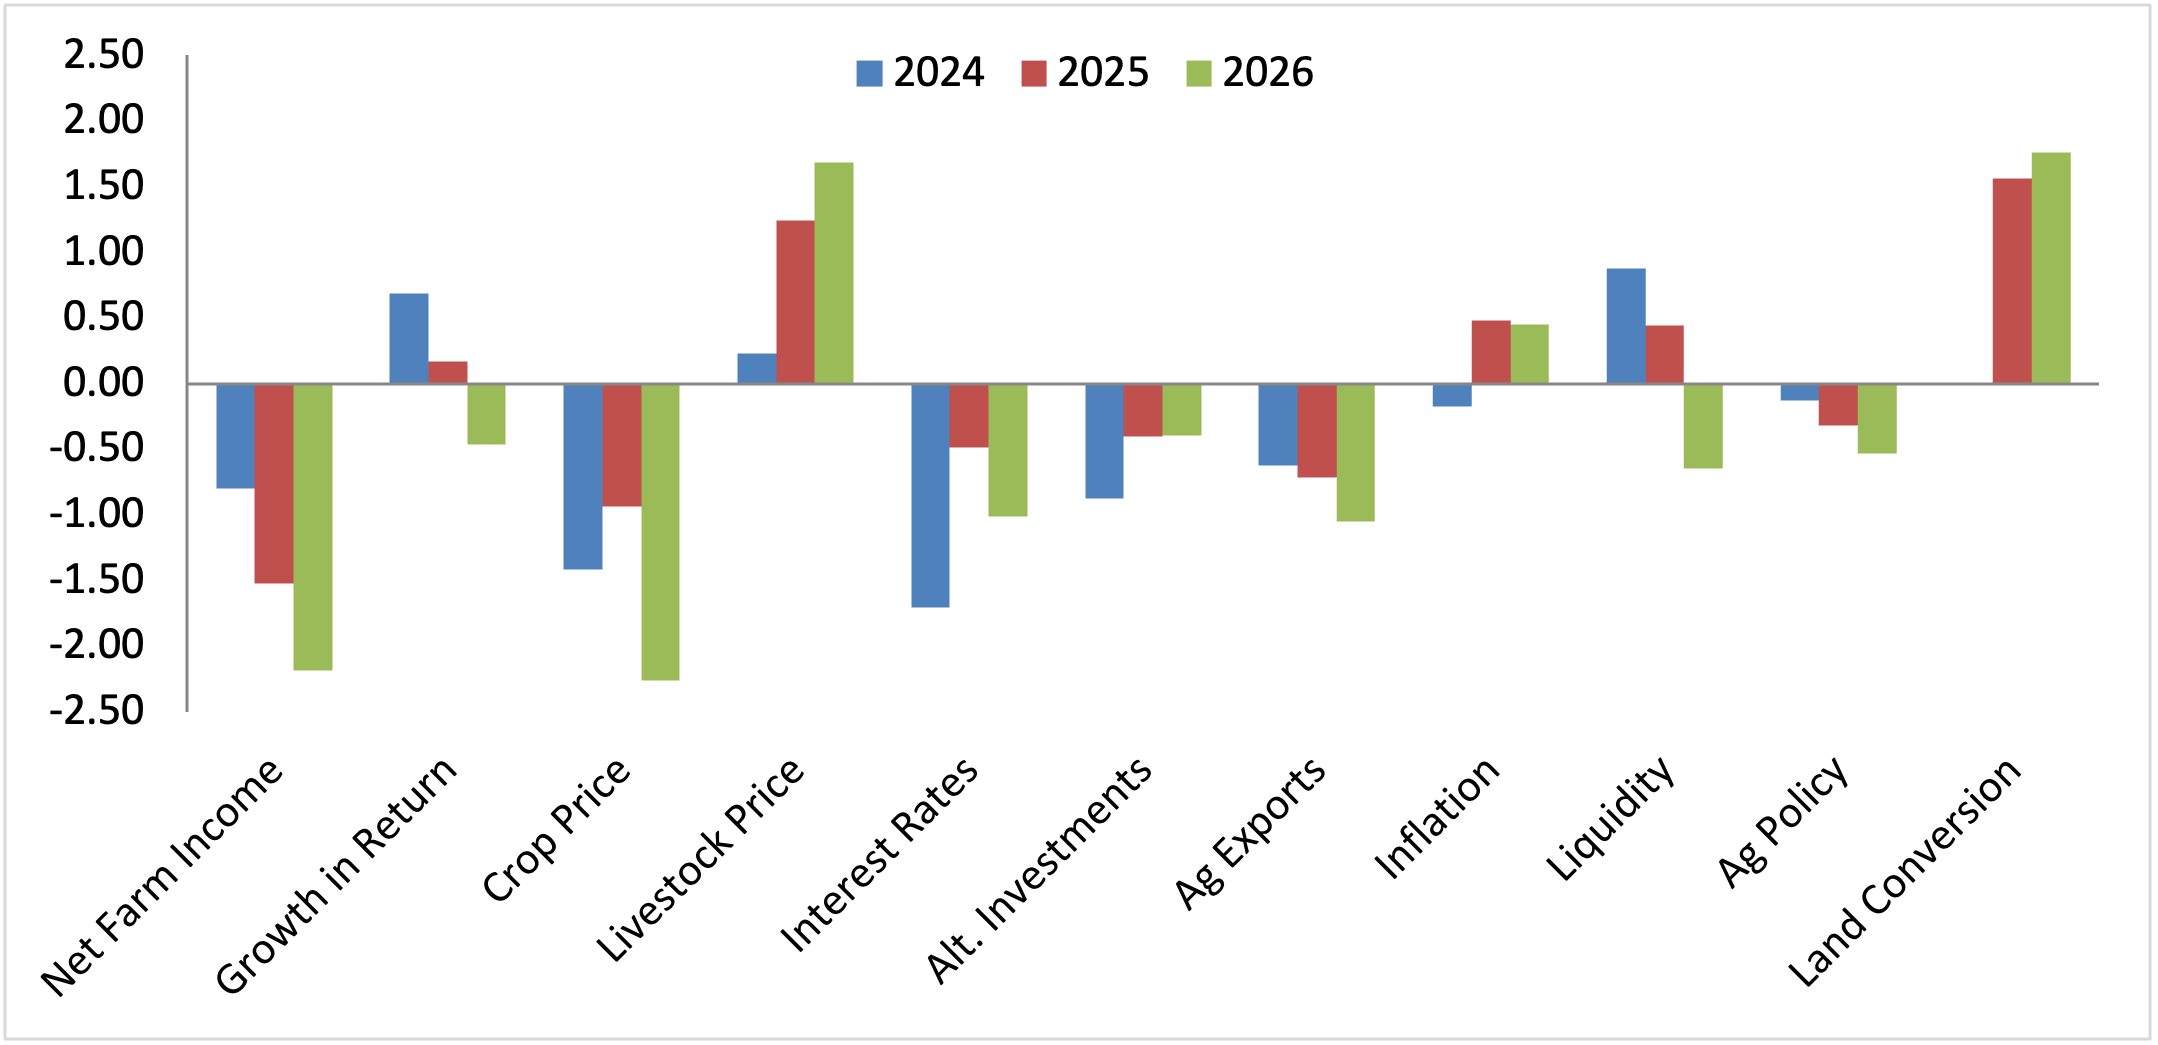
Figure 3
Percentage of respondents indicating less, same, or more farmland on the market than in the previous June
Five-Year Forecasts
Respondents were again asked to forecast the five-year average corn price, soybean price, mortgage rate, and inflation (Table 2). Respondents grew a bit more optimistic about long-run commodity prices, increasing corn prices to $5.05 and soybean prices to $12.05. These values, however, are still well below the expectations just a few years ago. Conversely, respondents appear more pessimistic about mortgage rates and inflation, increasing to 6.44% and 3.47%, respectively.
Table 2
Projected five-year average corn and soybean prices, mortgage interest, and inflation
Rate (%) Inflation
| Year | Price ($/bu) Corn | Price ($/bu) Soybeans | Rate (%) Interest | Rate (%) Inflation |
|---|---|---|---|---|
|
2022 |
5.65 | 12.84 | 6.41 | 5.76 |
|
2023 |
5.55 | 12.81 | 6.76 | 4.47 |
|
2024 |
5.02 | 12.44 | 6.58 | 3.73 |
|
2025 |
4.91 | 11.53 | 6.28 | 2.99 |
|
2026 |
5.05 | 12.05 | 6.44 | 3.47 |
|
Average |
5.24 | 12.33 | 6.49 | 4.08 |
Cash Rent
Statewide cash rental rates for top quality land declined by 4.1 percent to $305 per acre (Table 3a). Rates also declined for average quality land by 1.4 percent to $260 per acre. On the other hand, cash rental rates for poor quality land increased by 3.3 percent to $214 per acre. With the same caveats as farmland prices, cash rents varied across quality grades and regions (Table 3b). For example, rental rates fell for all three quality grades in the Central region and rose across all three quality grades in the Southeast region. However, in all other regions, some quality grades increased while others decreased.
Table 3a
Average estimated Indiana cash rent per acre (tillable, bare land), statewide, 2025 and 2026
| Class | Corn Bu/A | Rent/Acre 2025 | Rent/Acre 2026 | % Change 25-26 | Rent/bu of Corn 2025 | Rent/bu of Corn 2026 | Rent as % of June Land Value 2025 | Rent as % of June Land Value 2026 |
|---|---|---|---|---|---|---|---|---|
|
Top |
237 | 318 | 305 | –4.1 | 1.38 | 1.29 | 2.1 | 2.0 |
|
Average |
208 | 264 | 260 | –1.4 | 1.32 | 1.25 | 2.2 | 2.1 |
|
Poor |
179 | 207 | 214 | 3.3 | 1.22 | 1.20 | 2.1 | 2.3 |
Table 3b
Average estimated cash rent per acre (tillable, bare land) by geographic area, 2025 and 2026
| Area | Class | Corn Bu/A | Rent 2025 | Rent 2026 | % chg | Responses |
|---|---|---|---|---|---|---|
|
North |
Top | 246 | 313 | 301 | –3.9 | 14* |
| — | Average | 213 | 247 | 254 | 3.0 | — |
| — | Poor | 183 | 179 | 202 | 12.7 | — |
|
Northeast |
Top | 234 | 306 | 304 | –0.5 | 33 |
| — | Average | 207 | 253 | 257 | 1.7 | — |
| — | Poor | 179 | 201 | 212 | 5.6 | — |
|
W. Central |
Top | 242 | 358 | 333 | –6.9 | 27 |
| — | Average | 214 | 299 | 289 | –3.4 | — |
| — | Poor | 185 | 239 | 240 | 0.3 | — |
|
Central |
Top | 236 | 328 | 301 | –8.2 | 38 |
| — | Average | 207 | 282 | 260 | –7.7 | — |
| — | Poor | 178 | 223 | 214 | –4.3 | — |
|
Southwest |
Top | 224 | 286 | 272 | –5.1 | 13* |
| — | Average | 192 | 229 | 226 | –1.3 | — |
| — | Poor | 159 | 173 | 184 | 6.4 | — |
|
Southeast |
Top | — | 248 | 250 | 0.8 | 2* |
| — | Average | — | 197 | 208 | 5.3 | — |
| — | Poor | — | 167 | 175 | 4.8 | — |
* Limited responses; Interpret with caution
Looking Ahead
In sum, state-level aggregate farmland prices exhibited relatively modest changes from 2025 to 2026. Respondents suggest that the majority of market forces are placing downward pressure on farmland prices, so it is not surprising that they expect modest declines through the remainder of 2026.
Viewed over the longer horizon, 2026 will likely be viewed as part of a period of adjustment following the short but sharp price boom of 2020 to 2022, when statewide farmland values rose over 60 percent in three years. This period of adjustment is similar in many ways to the 2014 to 2019 adjustment period. The character of this year’s divergence — regions moving in sharply different directions, with at least two showing internal splits between quality grades — echoes 2018’s “Up, Down, and Sideways” pattern within the prior adjustment period. Whether 2026 occupies a similar late-cycle position within the current adjustment, as 2018 did within 2014 to 2019, is not yet possible to say.
Purdue Farmland Values and Cash Rents Survey
The Purdue Farmland Values and Cash Rents Survey is conducted each June. The survey is possible through the cooperation and contribution of numerous professionals knowledgeable of Indiana’s farmland market. These professionals include farm managers, rural appraisers, land brokers, agricultural loan officers, farmers, and Farm Service Agency (FSA) county office directors.
These professionals were selected because their daily work requires they stay well informed about farmland values and cash rents. These professionals provide an estimate of the market value for bare, poor, average, and top quality farmland in December 2025, June 2026, and a forecast for December 2026. To assess the productivity of the farmland, respondents provide an estimate of long-term corn yield for top, average, and poor productivity farmland. Respondents also provide a market value estimate for land transitioning out of agriculture and for recreational land. The survey received 127 responses in 2026; not all respondents provided estimates for every land class or question, as individual respondents may have direct knowledge of only certain land qualities or uses in their area.
The data reported here provide general guidelines regarding farmland values and cash rent. To obtain a more precise value of an individual tract, contact a professional appraiser or farm manager who has a good understanding of the local market.
A Note on Survey Participation
The number of professionals contributing to this survey has declined substantially over its history, from roughly 300 to 400 respondents in the 1990s and 2000s to closer to 100 in recent years, with the decline accelerating over the past several years. This year’s tables have been restructured to reflect this reality more transparently: statewide and regional figures are now reported separately, and regional tables include the number of responses underlying each estimate. We believe these changes give readers a clearer sense of which figures should be interpreted with more caution.
We would like to grow the pool of professionals who contribute to this survey, particularly in the Southeast, Southwest, and North regions of the state. If you are a farm manager, rural appraiser, land broker, agricultural loan officer, or other professional with knowledge of farmland values and cash rents in your area, we welcome your participation in next year’s survey. Signing up takes less than a minute, and registered respondents will receive an advance copy of next year’s report before its public release. Scan the QR code below or visit [https://bit.ly/4z0DKKZ] to add your name to next year’s invitation list.