Cash Rents and Farmland Values Remain Under Downward Pressure
December 5, 2018
PAER-2018-23
Author: Craig Dobbins, Professor of Agricultural Economics


Cash Rent
Last year at this time, many forecasters indicated the worst of the margin pressure appeared to be behind production agriculture. Farmers had achieved some success in lowering per unit cost of production. In addition, supply and demand balance appeared to be improving. Unfortunately the hoped for improvements did not materialize when a trade war with China broke out in June 2018. The opinions quickly turned negative as tight margins became even tighter.
Comparing annual per bushel production costs from the Purdue Crop Cost and Return Guide indicates some progress has been made in lowering per unit costs. In 2013, per unit variable costs for rotation con was $2.83 per bushel on average farmland. In 2016, this cost was $2.43 (Table 1), a decline of 16%. From 2016 to 2018, per unit cost has been relatively stable. An increase in the per unit production cost for rotation corn is expected for 2019, increasing from $2.39 to $2.50.
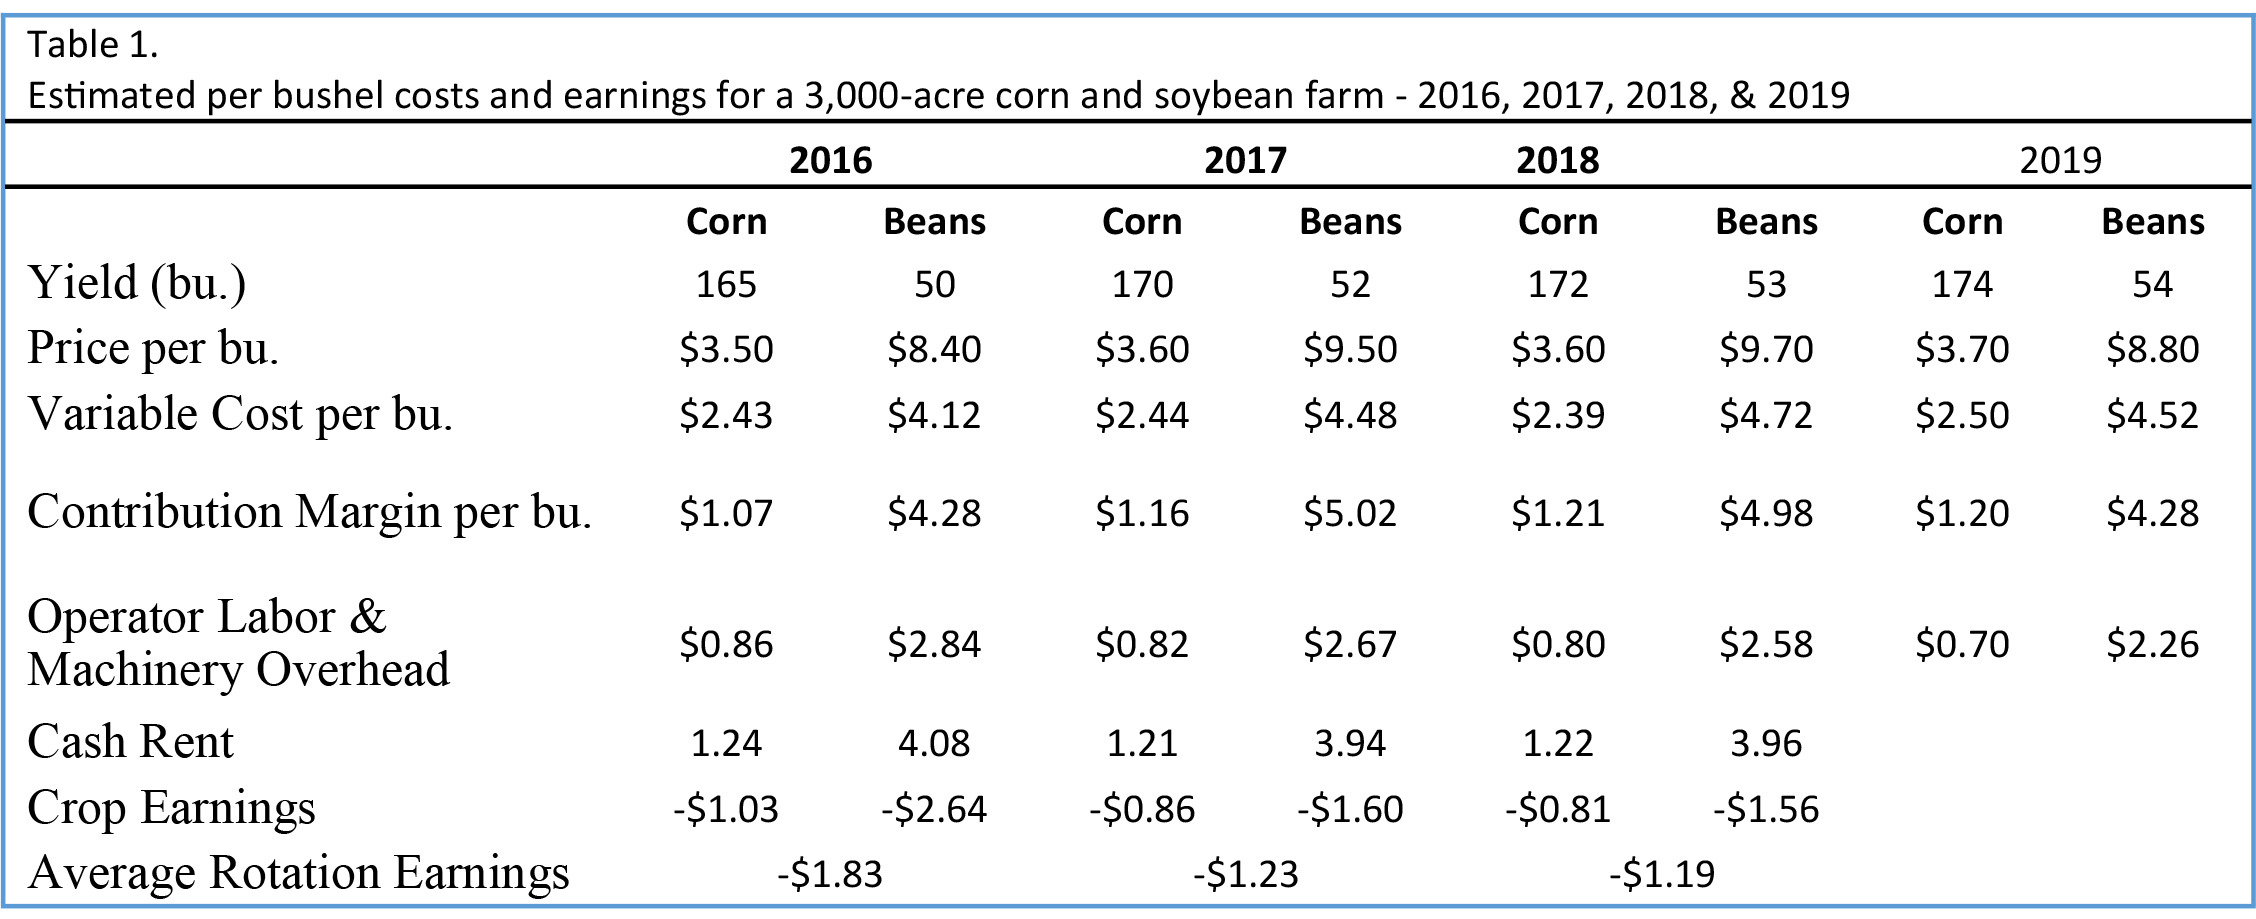
The change in per unit production cost for rotation soybeans has been a little different. In 2013, rotation soybean production costs were $4.43 per bushel. These costs declined to $4.12 in 2016, a decline of 7%. There have been increases in the per unit production costs for 2017, 2018, and 2019. The 2019 estimate is $4.52, a cost 2% more than in 2013.
Subtracting per unit production costs from the price of corn and soybeans provides the contribution margin. This is the money left to pay the expenses associated with investments in machinery and facilities, for family and hired labor, and farmland. In 2016, the contribution margin was $1.07 per bushel ($176.55 per acre) for rotation corn and $4.28 per bushel ($214.00 per acre) for soybeans. The cash rent for average farmland during this period has averaged $207 per acre, more than the contribution margin. This means there are no earnings to pay for machinery and facility investments and family and hired labor. Cash rents from 1996 to 2018 are presented in Figure 1.
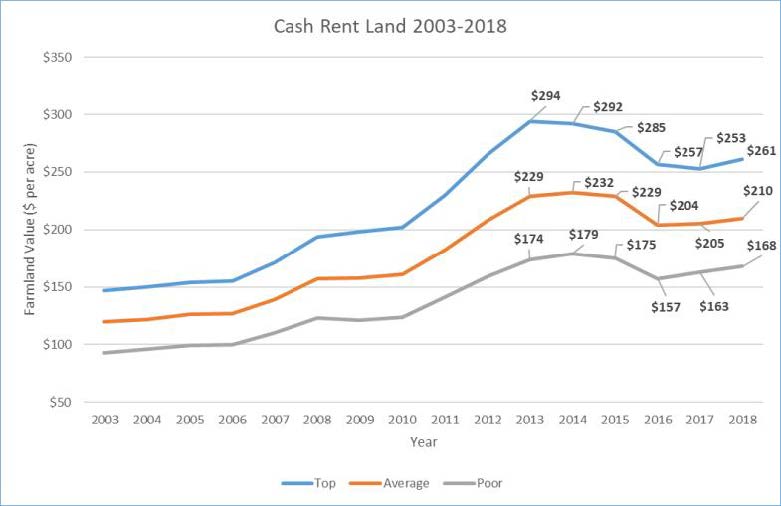
Figure 1. Cash rent values for Indiana farmland, 2003 – 2018
As one considers cash rent for 2019, it is important to know on which side of average you are on. Per unit production costs vary widely. If your costs are below average, you have an advantage. What will you do to make the most of this advantage? If costs are above average, what is the strategy for lowering them?
The bottom line message of these numbers is there is still a need to reduce costs, increase revenues, or both. What do these numbers mean for cash rent? In the average situation there is downward pressure on cash rent and other costs. Historically a decline in cash rent of 5% is a significant change in this extremely competitive market. The tight margins do not provide room for cash rents to increase. For next year, cash rents are more likely to be flat or down with a higher probability of stable cash rents than declining cash rents.
Farmland Values
Average quality Indiana farmland reached a peak of $7,976 per acre in 2014. The 2018 Purdue Farmland Value Survey indicated average quality farmland was valued at $7,072 per acre, 11% less than the peak value and 2.1% more than the June 2017 value (Figure 2). While crop margins remain tight, the above trend yield of 2017 and prospects for better prices, helped lift farmland values in 2018. The optimism in the market was quickly lost with the shift in trade policy. The imposition of tariffs and the retaliatory response quickly dampened export demand. There was a hope that the trade war would be short lived, but instead we find ourselves in a 90 day cooling off period. This pause has postponed an increase in tariffs on Chinese imports. Over time trade flows will adjust and the quantity of agricultural exports will likely rise, but this will take time.
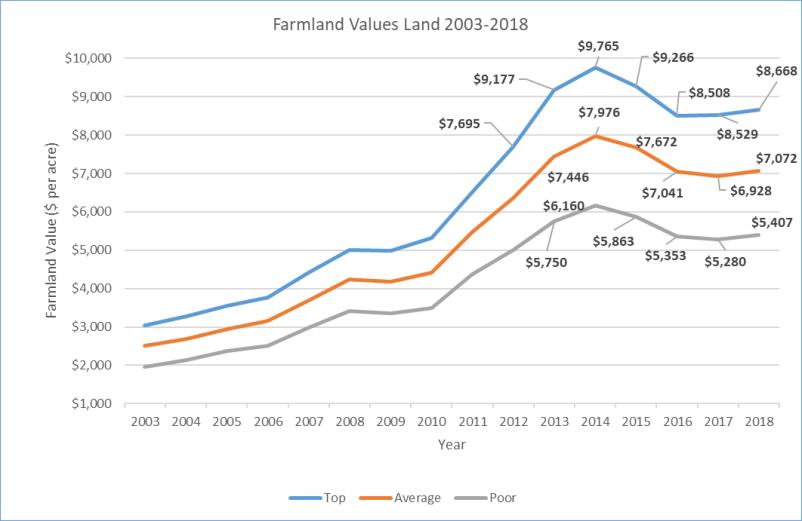
Figure 2. Farmland values for Indiana farmland, 2003 – 2018
Another important influence in the farmland market is the rise in long term interest rates. The Federal Reserve has been systematically raising short term rates. Long term rates have also been rising. Since the early 1980s, the economy has benefited from declining interest rates. If we are entering a period of rising interest rates, this will add another negative influence to the farmland market.
The major source of strength in the farmland market seems to be the reluctance of current owners to sell. There is not a source of objective data to determine if there is a smaller supply of farmland on the market now than previous, but there several antidotal indicators that point in that direction.
Tight margins, uncertainties about trade negotiations and tariffs, and rising long-term interest rates are likely to be negative enough to keep the farmland market from increasing in 2018. While there is continued concern about the financial strength of farmers, there is no pending crisis that is likely to force an increased supply of land on the market. It is expected that farmland values are likely to remain steady, with the possibility of a small decline if the trade news is negative.