Crop Costs Stay High and Returns Collapse
December 13, 2014
PAER-2014-18
Michael Langemeier, Allan Miller, and Craig Dobbins
![]()
![]()
![]()
![]()
![]()
Crop margins are tight and even negative for many! Estimated earnings for Indiana corn and soybeans are expected to fall once again for 2015 crops, following severe declines in 2014. Contribution margins for 50/50 corn/soybean farms with average Indiana soils are expected to drop by $233 per acre between 2013 and 2015. Returns for 2015 are expected to be back near 2005 levels before grain prices began to surge. Lower crop prices and continued high costs of production are the main culprits. The 2015 Purdue Crop Cost and Return Guide, gives estimated costs for producing crops, as well as estimated contribution margins and earnings. The guide is updated frequently as grain futures prices change and the costs of inputs, such as seed, fertilizer, pesticides and fuel, fluctuate. This article reflects updates for early December 2014. The guide presents cost and return information for low, average, and high productivity soils. The discussion here will focus on estimates for average productivity soils only.
Table 1 presents crop budget information for continuous corn, rotation corn, rotation soybeans, wheat, and double-crop soybeans for average productivity soil. Double-crop soybeans are typically planted after wheat so it is typical to combine the contribution margin for these two crops when comparing to continuous corn, rotation corn, and rotation soybeans. The contribution margin, obtained by subtracting total variable cost from market revenue, ranges from $132 per acre for continuous corn to $342 per acre for wheat/double-crop soybeans.
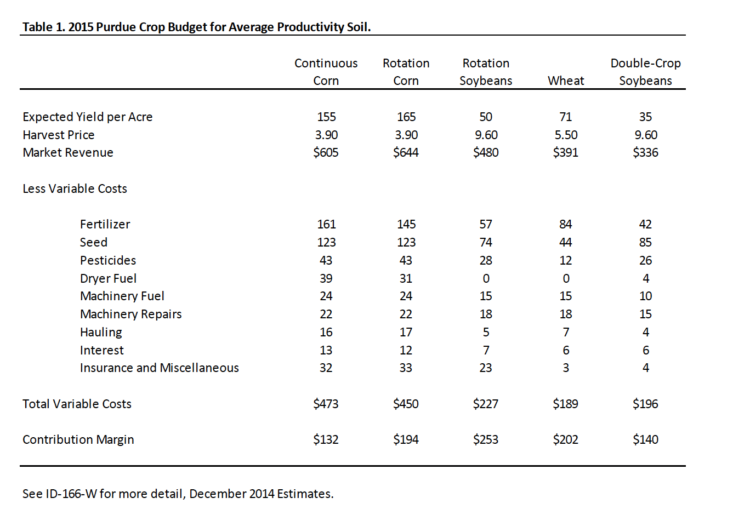
Table 1. 2015 Purdue Crop Budget for Average Productivity Soil
Contribution margins for rotation soybeans at $253 per acre are far higher than for rotation corn at $194. This suggest nearly $60 per acre higher returns for soybeans than corn in 2015. This strong soybean premium is expected to cause some acreage to shift toward soybeans. Indiana producers should watch the price relationships between 2015 corn and soybeans this winter as they make their final planting decisions.
Figure 1 illustrates the trends in market revenue, total variable costs, and the contribution margin for rotation corn from 2006 to 2015. Market revenue in 2015
is expected to drop approximately 9 percent, due to the decline in corn price. Variable costs are expected to increase slightly. The trend in fertilizer and seed costs over the last ten years is illustrated in Figure 2. Fertilizer costs are based on price estimates in late November. The contribution margin for 2015 is expected to drop $75 per acre (approximately 28 percent) and is expected to be the lowest since 2006. It is important to note that the contribution margin is used to cover overhead costs such as machinery costs, family and hired labor, and cash rent. Failure to adequately cover these overhead costs typically puts downward pressure on rents.
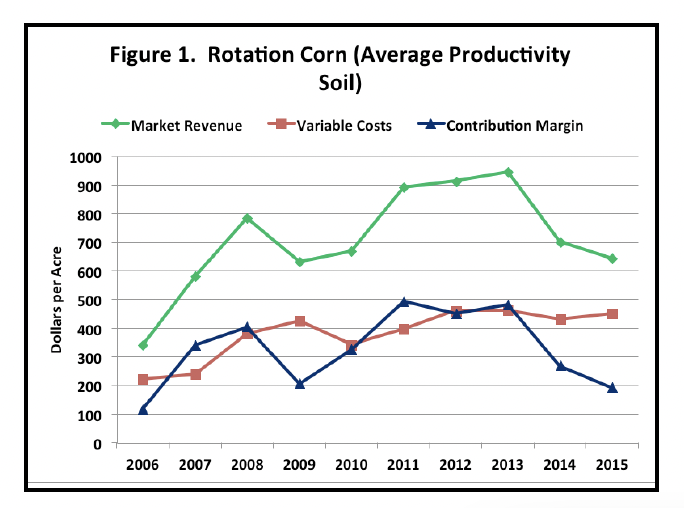
Figure 1. Rotation Corn (Average Productivity Soil)
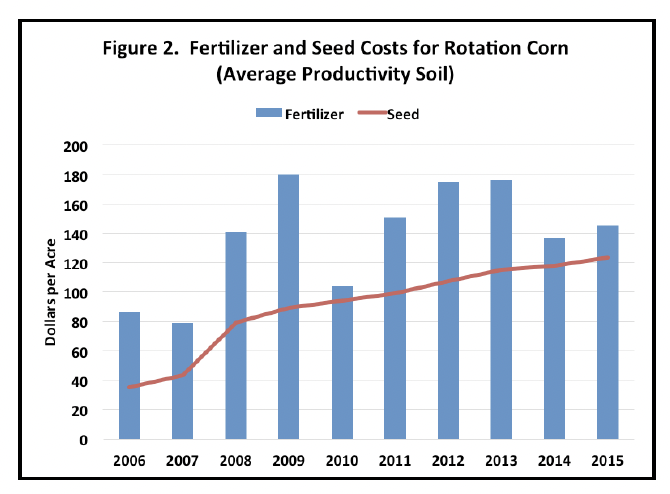
Figure 2. Fertilizer and Seed Costs for Rotation Corn (Average Productivity Soil)
Trends in market revenue, total variable costs, and the contribution margin for rotation soybeans are illustrated in Figure 3. As with rotation corn, the market revenue for rotation soybeans is expected to drop. Total variable costs are expected to be similar to those experienced in 2014. The trend in fertilizer and seed costs for rotation soybeans is illustrated in Figure 4. The contribution margin for rotation soybeans is expected to decline $118 per acre. The contribution margin for rotation soybeans is the lowest it has been since 2009.
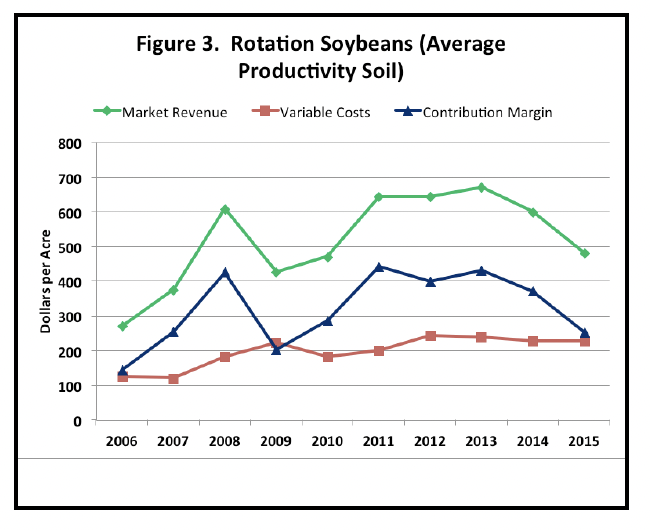
Figure 3. Rotation Soybeans (Average Productivity Soil)
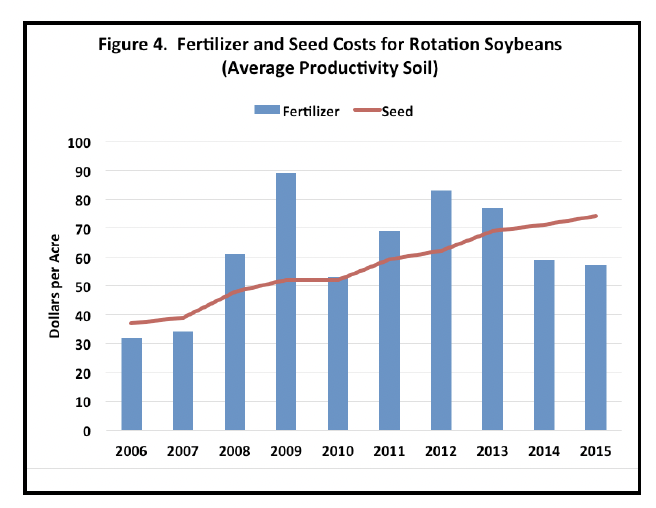
Figure 4. Fertilizer and Seed Costs for Rotation Soybeans (Average Productivity Soil)
From 2010 to 2013, the contribution margin for rotation corn was higher than the contribution margin for rotation soybeans. The average difference in the contribution margin was approximately $50 per acre during this period. The relative attractiveness of corn during the last few years, encouraged many producers to plant relatively more corn than soybeans. The situation in 2014 and 2015 is considerably different. Soybeans had a relatively higher contribution margin in 2014. For 2015, rotation soy-beans are expected to have a contribution margin that is approximately $60 per acre higher than the contribution margin for corn. Given the expected change in the relative attractiveness of corn and soybeans, producers should carefully budget both crops.
In the long-run, in addition to covering variables costs, producers need to cover the overhead costs associated with machinery, family and hired labor, and cash rent. Even if a producer does not hire labor or rent land, they need to consider the opportunity costs associated with these items, which can be estimated by answering the following questions. What is the value of family labor if it is employed off the farm? Similarly, what could the land that I own be rented for? The residual remaining after subtracting variable costs and overhead costs, which include the opportunity costs associated with family labor and owned land, from market revenue and government payments is called “earnings” in the Purdue crop cost and return guide.
Over the long-run, we would expect the average earnings per acre to gravitate towards zero. Figure 5 presents earnings per acre for a farm with 3,000 crop acres that utilizes a corn/soybean rotation. From 2006 to 2014, earnings per acre ranged from a negative $81 in 2006 to $212 in 2011. Earnings per acre are expected to be a negative $115 per acre in 2015, well below the ten-year average of $52 per acre.
In summary, margins will be considerably tighter in 2015. This increases the importance of carefully scrutinizing input and crop decisions. Producers are encouraged to create crop budgets and in general improve their record keeping. Lower crop margins will adversely impact a farm’s liquidity position and financial performance.
![]()
![]()
![]()
![]()
![]()