March 27, 2013
Agricultural Price and Land Values: Insights from Participants in the “Financial Health of Farming and Land Values” Conference
![]()
![]()
![]()
![]()
![]()
Research Overview
Who: The Center for Commercial Agriculture involved participants in their program, Financial Health of Farming and Land Values, in applied research.
What: Program participants were invited to participate in valuing a farm and providing expectations for corn prices, interest rates, land values, and land rental rates.
When: March 27, 2013
Where: Purdue University, Beck Agricultural Center, West Lafayette, Ind.
Why: To identify expectations for farmland values & corn prices and examine potential relationships. Furthermore, to identify potential changes in expectations after participation in the program.
How: Program participants were polled at the beginning and end of the program using audience response devices (clickers).
Background
The Center for Commercial Agriculture (CCA) hosted the “Financial Health of Farming and Farmland Values” conference on March 27, 2013 at the Beck Agricultural Center at Purdue University to offer insights and provide perspectives on questions that are on the minds of nearly everyone in agriculture today:
- What are current attitudes toward farmland values?
- What are the expectations of agricultural producers, landowners and investors today for future income associated with investments in farmland?
- Are farmland prices in a bubble?
- Are expectations for future income driving farmland investment decisions? If not, why?
The Setting and Experiment
Several agricultural economists associated with CCA have recently sought to address questions surrounding farmland values and related investment decisions. Soaring Corn Belt farmland values have also been on the minds of farmers, agricultural industry professionals and investors. Attendees at the March 2013 CCA conference dedicated to the financial health of farming and farmland values included farmers, landowners and industry professionals, with nearly three quarters of the participants being farmers, lenders, or landowners (Figure 1). In total, 67 percent of program attendees owned farmland at the time of their attendance of the CCA program (Figure 2).
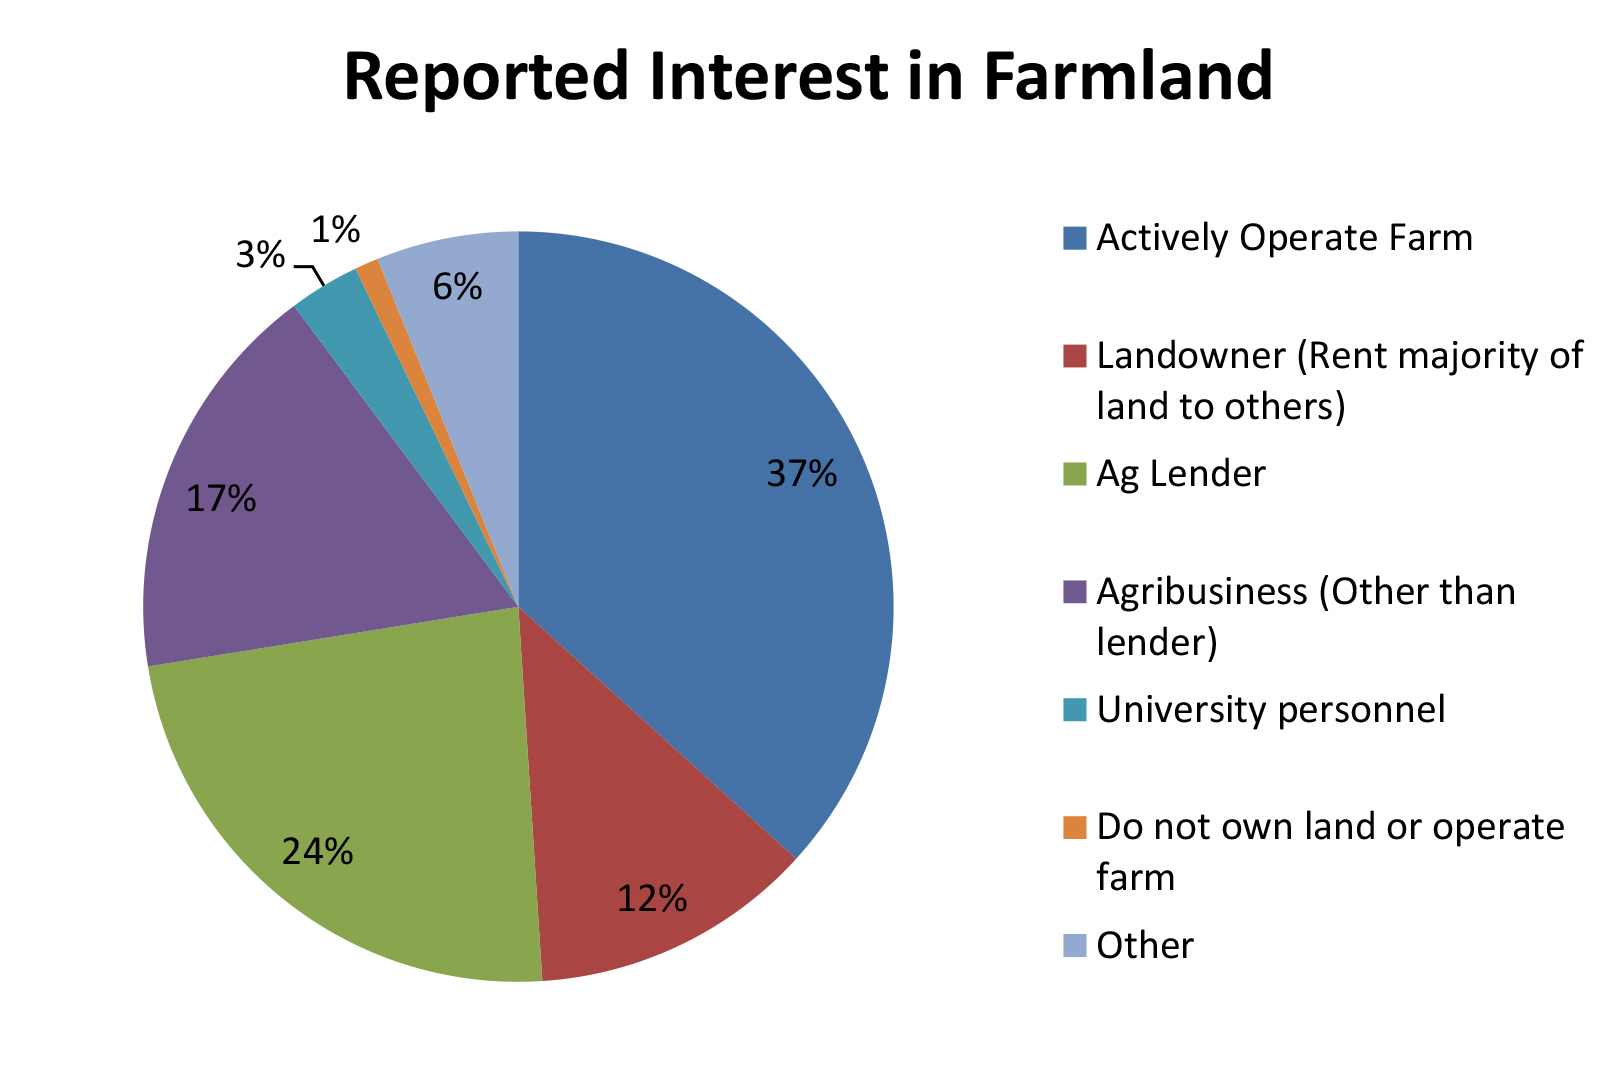
Figure 1. Participants’ Stated Interest in Farmland Value, 98 respondents
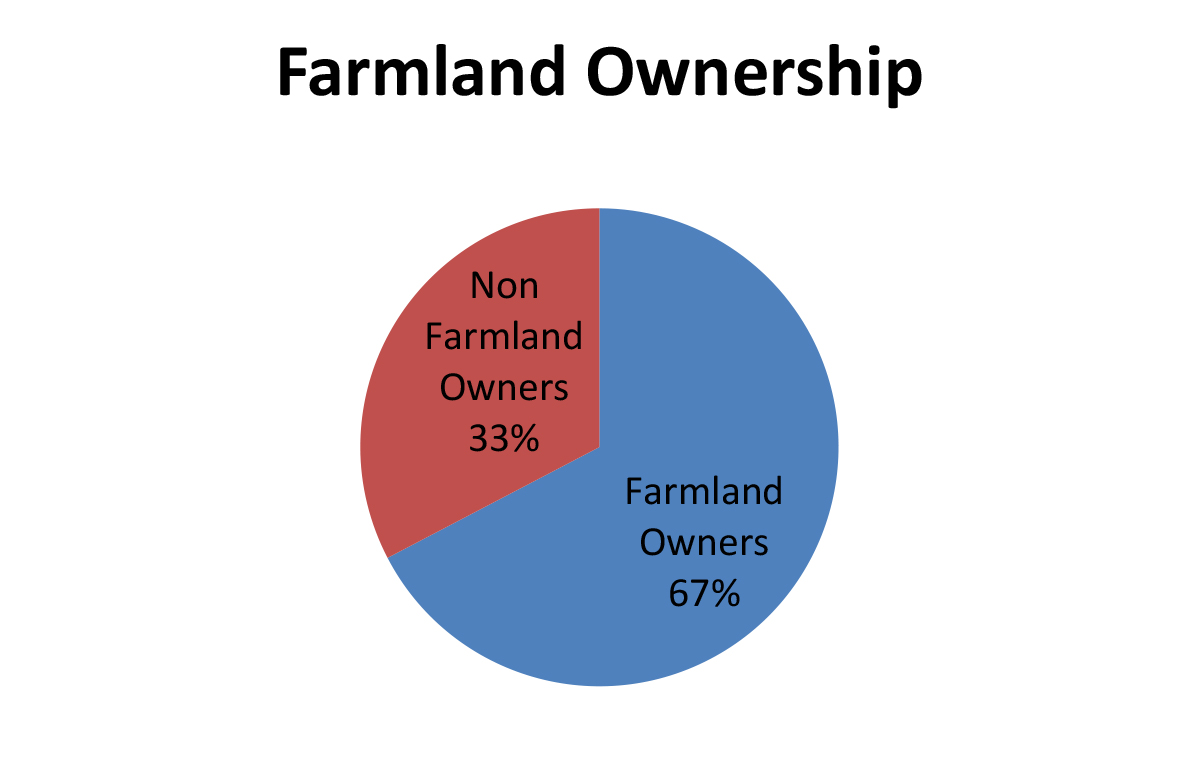
Figure 2. Proportion of participants owning farmland (as of the time of their attendance in March 2013), 98 respondents
To obtain a better understanding of how market participants and stakeholders view the farmland market, a real time survey was administered during the conference. Attendees were asked several questions regarding their expectations for farm revenue, commodity prices and farmland values. This report describes the survey and summarizes the results.
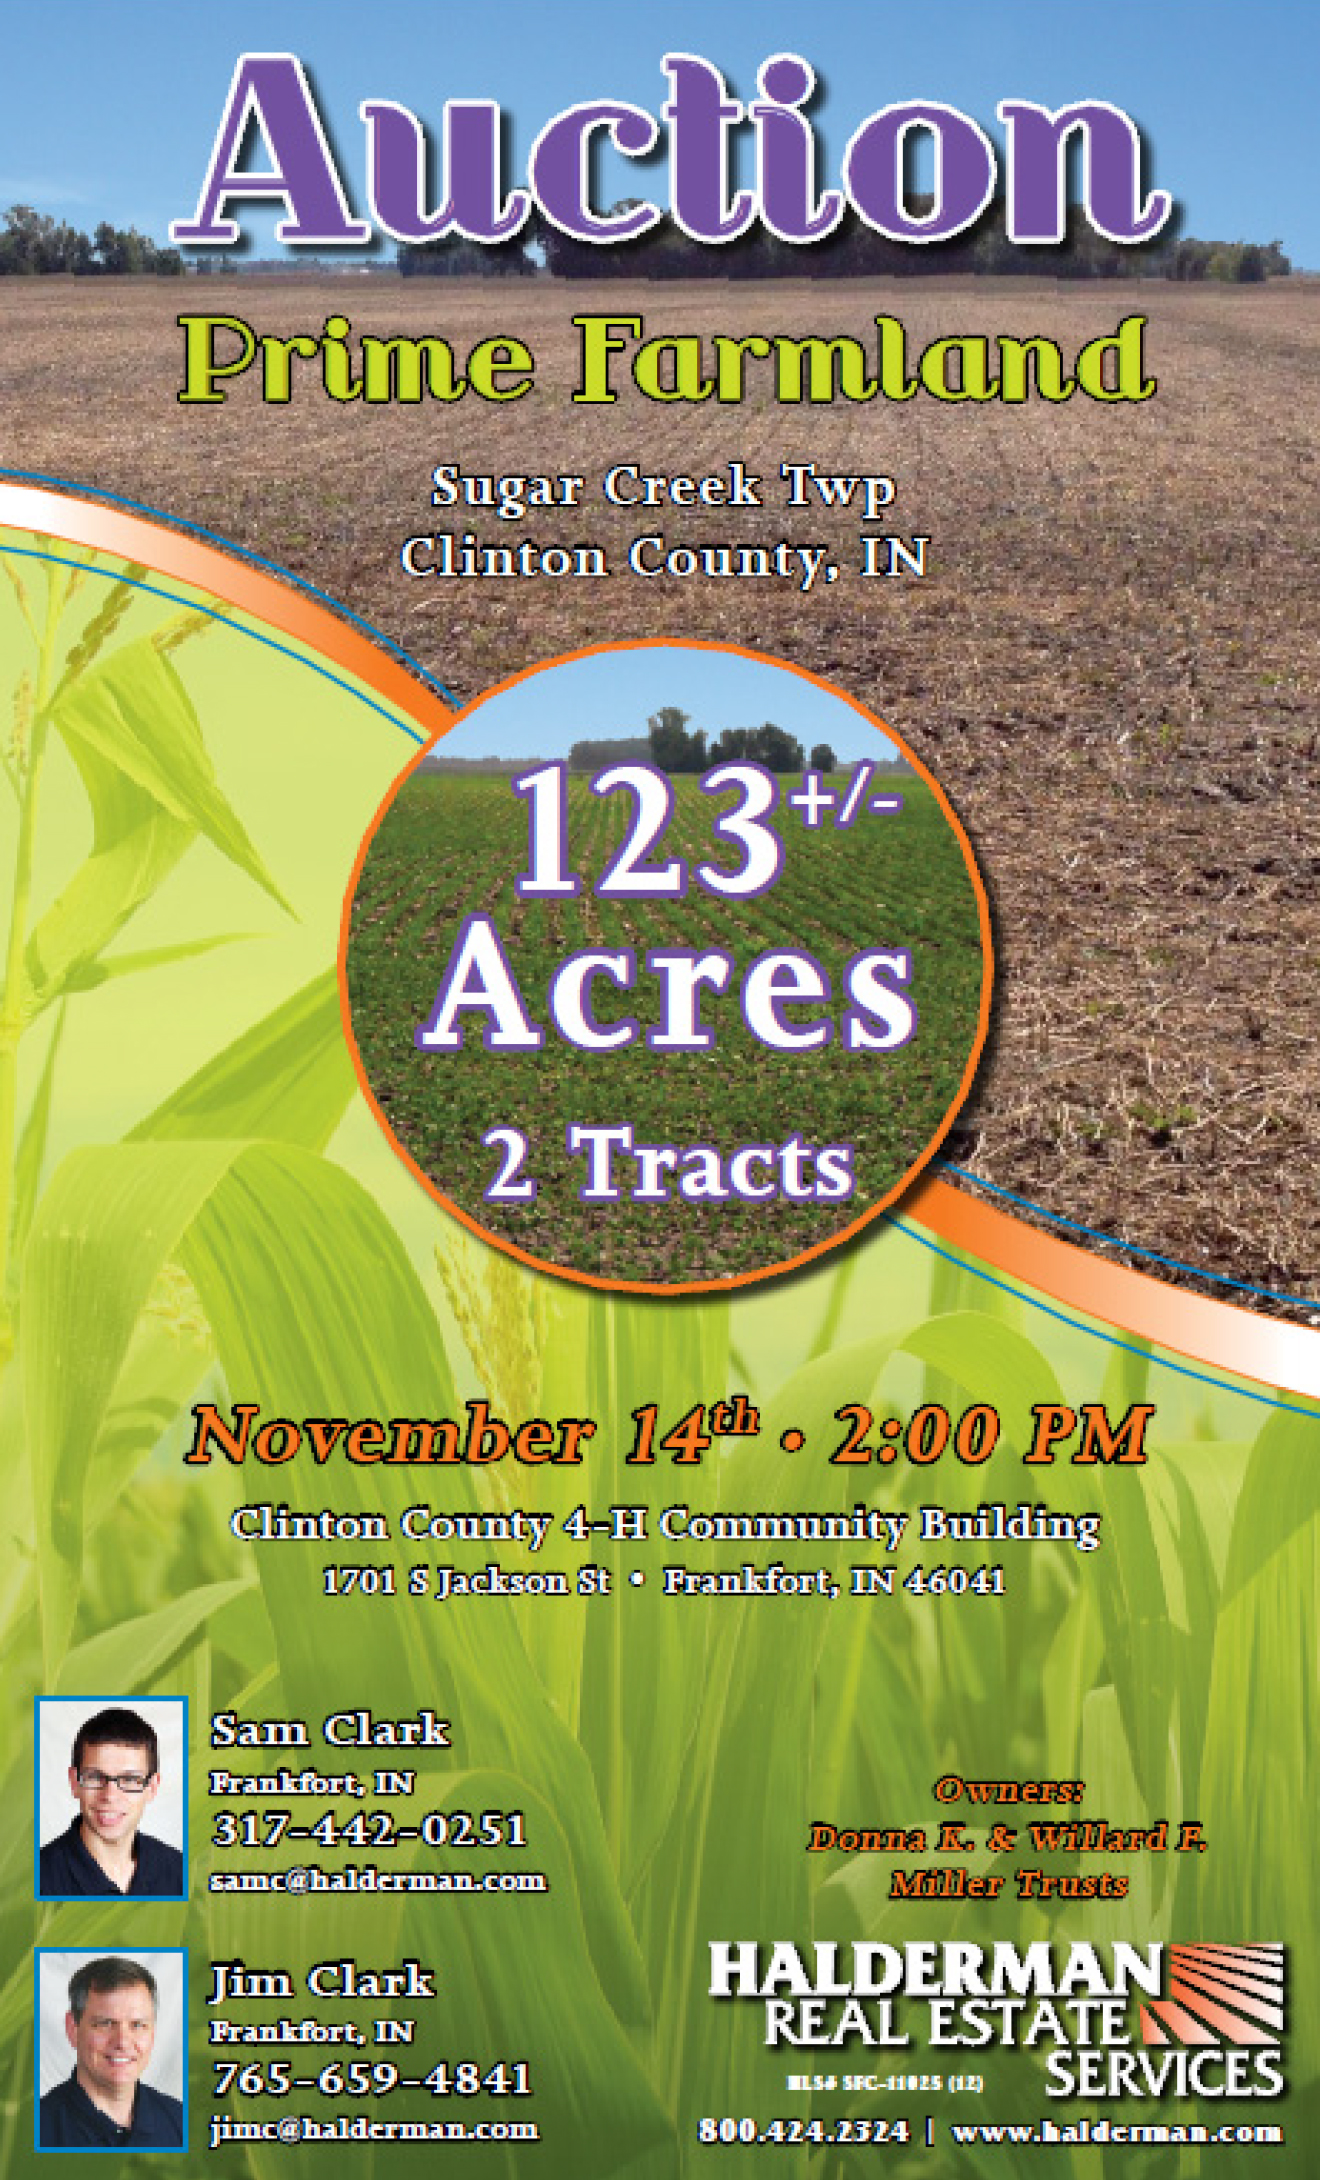
The first step in the process was to provide conference attendees with some background information on a tract of farmland. The materials provided to the participants were auction materials associated with a recent farmland auction that had taken place in Frankfort, Ind. (the materials provided to the participants are shown in Appendix A).
The majority of attendees, 68 percent of the total 119 attendees registered, were from Indiana. However, participants also attended from Ohio, Kentucky, Missouri, Illinois, Minnesota, Tennessee, Arkansas, Iowa, Kansas, Nebraska and New Jersey. Given the diversity of program participants in terms of geographic location of residence, participants were provided with some additional information about the farm, including a statement from an agronomist about the production capacity of the farmland.

Figure 3. TurningTechnologies Response Card NXT provided to program participants
After examining the information, program participants were invited to respond to a series of questions about the farmland. These questions were presented in two distinct sessions of the CCA program, one during the first morning session and the second the final session of the afternoon. (See conference Program in Appendix B.) Each program participant was provided an Audience Response Device (Clicker) to enable real-time anonymous responses to questions posed during the session (Figure 3).
After each question, respondents were shown a summary (mean) of the audience responses to the question. They were also shown more detailed analyses of the responses at the conclusion of the program. Throughout this report, the number of participants included in the response for each specific question was indicated. The number of respondents may vary from question to question based on whether the individual responded. However, in order for the respondent to be included in any questions they must have participated in both the morning and afternoon sessions.
Price Expectations
Rapid increases in farmland prices have caused many to wonder if the farmland market was responding rationally to economic fundamentals. In March 2012, Gloy et al., conducted a survey surrounding farmland values, revealing a great deal of uncertainty and a wide range of opinions surrounding the expectation for farmland values and future output prices. The survey of CCA program participants in March 2013 revealed similar uncertainty – and – a noteworthy range of answers for all questions investigated. These included expectations of corn prices, farmland values, willingness to pay for the farmland advertised (see Appendix A) and willingness to sell farmland in today’s land market.
Gloy (2013) states that “While most people will eventually agree that fundamentals such as income and interest rates are a critical factor in the value of farmland, I have observed that many people frequently do not make this connection when determining their own valuation of farmland.” To examine this assertion, program participants were asked to provide estimates of the most likely corn price that they expected to receive over the next five years. In other words, they were asked to state their expectations surrounding cash corn prices over the next five years; they were also asked to place high and low ranges around their estimates. In the highest corn price scenario, the respondent was asked to fill in the blank to the following statement, “There is a 1 in 10 chance that the cash corn price will be more than $____/bushel.” In the highest corn price scenario, the respondent was asked to fill in the blank to the following statement, “There is a 1 in 10 chance that the corn price will be less than $____/bushel.”
A summary of responses from the first session of the program is provided in Figure 4. The responses are ordered according to the magnitude of the participants most likely price estimate. High and low prices are indicated by the bars on each most likely price point. Basic observation of Figure 4 reveals that very few participants placed much likelihood on the chance that cash corn prices would average less than $3.00 per bushel over the next five years, and many expected the bottom of the range at $4.00 per bushel.
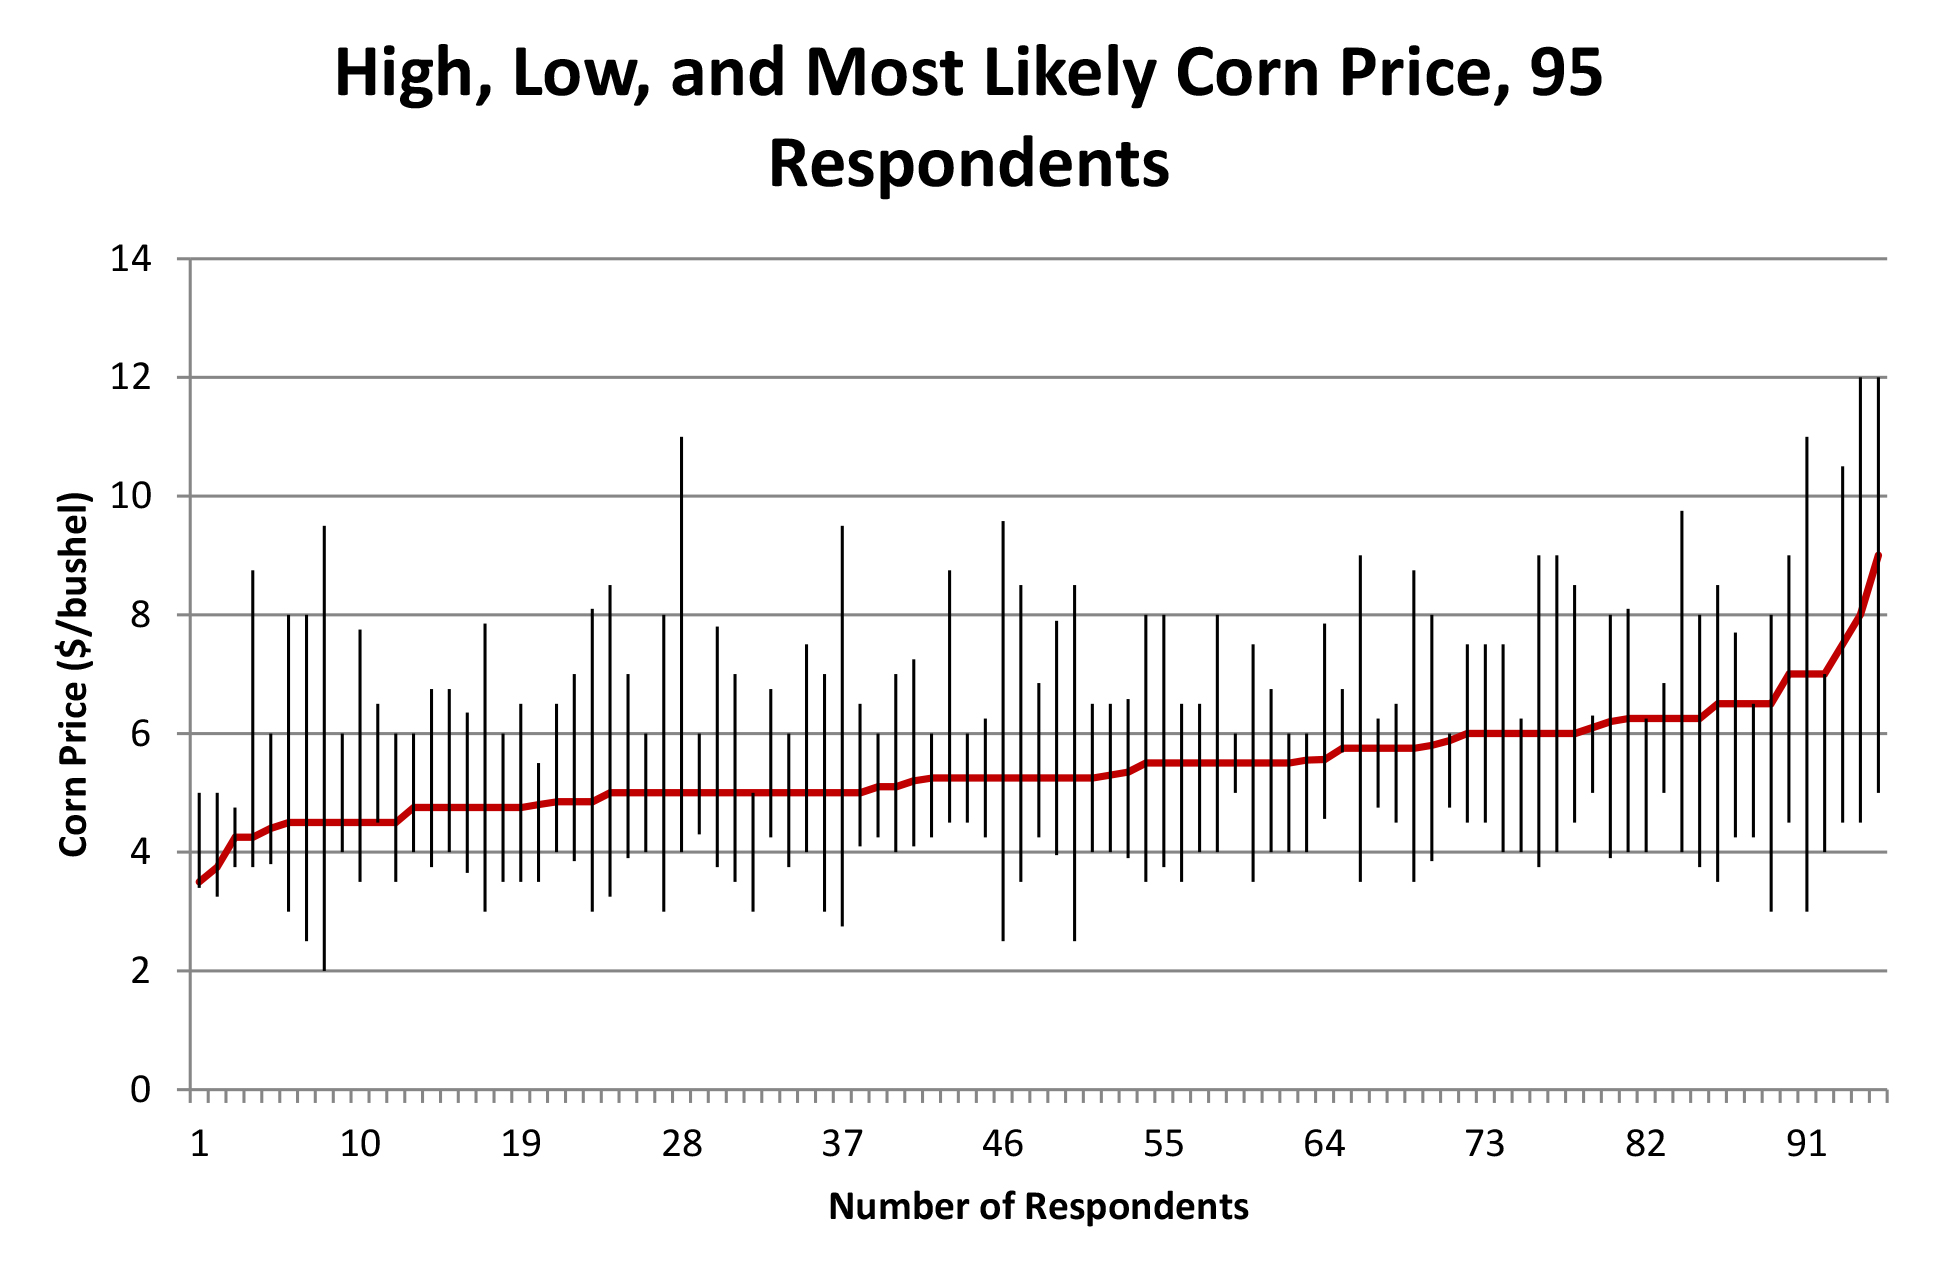
Figure 4. Distribution of Cash Corn price expectations for the next five years, 95 respondents, March 2013. (Responses presented are from the morning session of the program.)
Descriptive statistics for the responses are presented in Table 1. In terms of the most likely corn price expected in the next 5 years, the average price reported by participants in the morning session was $5.46/bushel, with a range of $3.75 to $9.00/bushel. In the afternoon session, after participating in the CCA conference, the average price reported had not changed much at $5.28/bushel; however, the range of most likely corn prices narrowed with a low of $4.20 and a high of $7.50. Thus, while the average for the most likely corn price reported only varied by $0.18/bushel, the range was significantly smaller in the afternoon session than it was at the start of the program.
Conference participants were asked about the distribution of expected corn prices during the morning session of the program. When reporting the price at which there was a 1 in 10 chance that the corn price in the next five years would be less than current prices, the average price reported was $3.86/bushel, with a range of $2.00/bushel to $5.68/bushel. For the high corn price scenario, the average reported price was $7.36/bushel, with a range of $4.75 to $12.00/bushel.
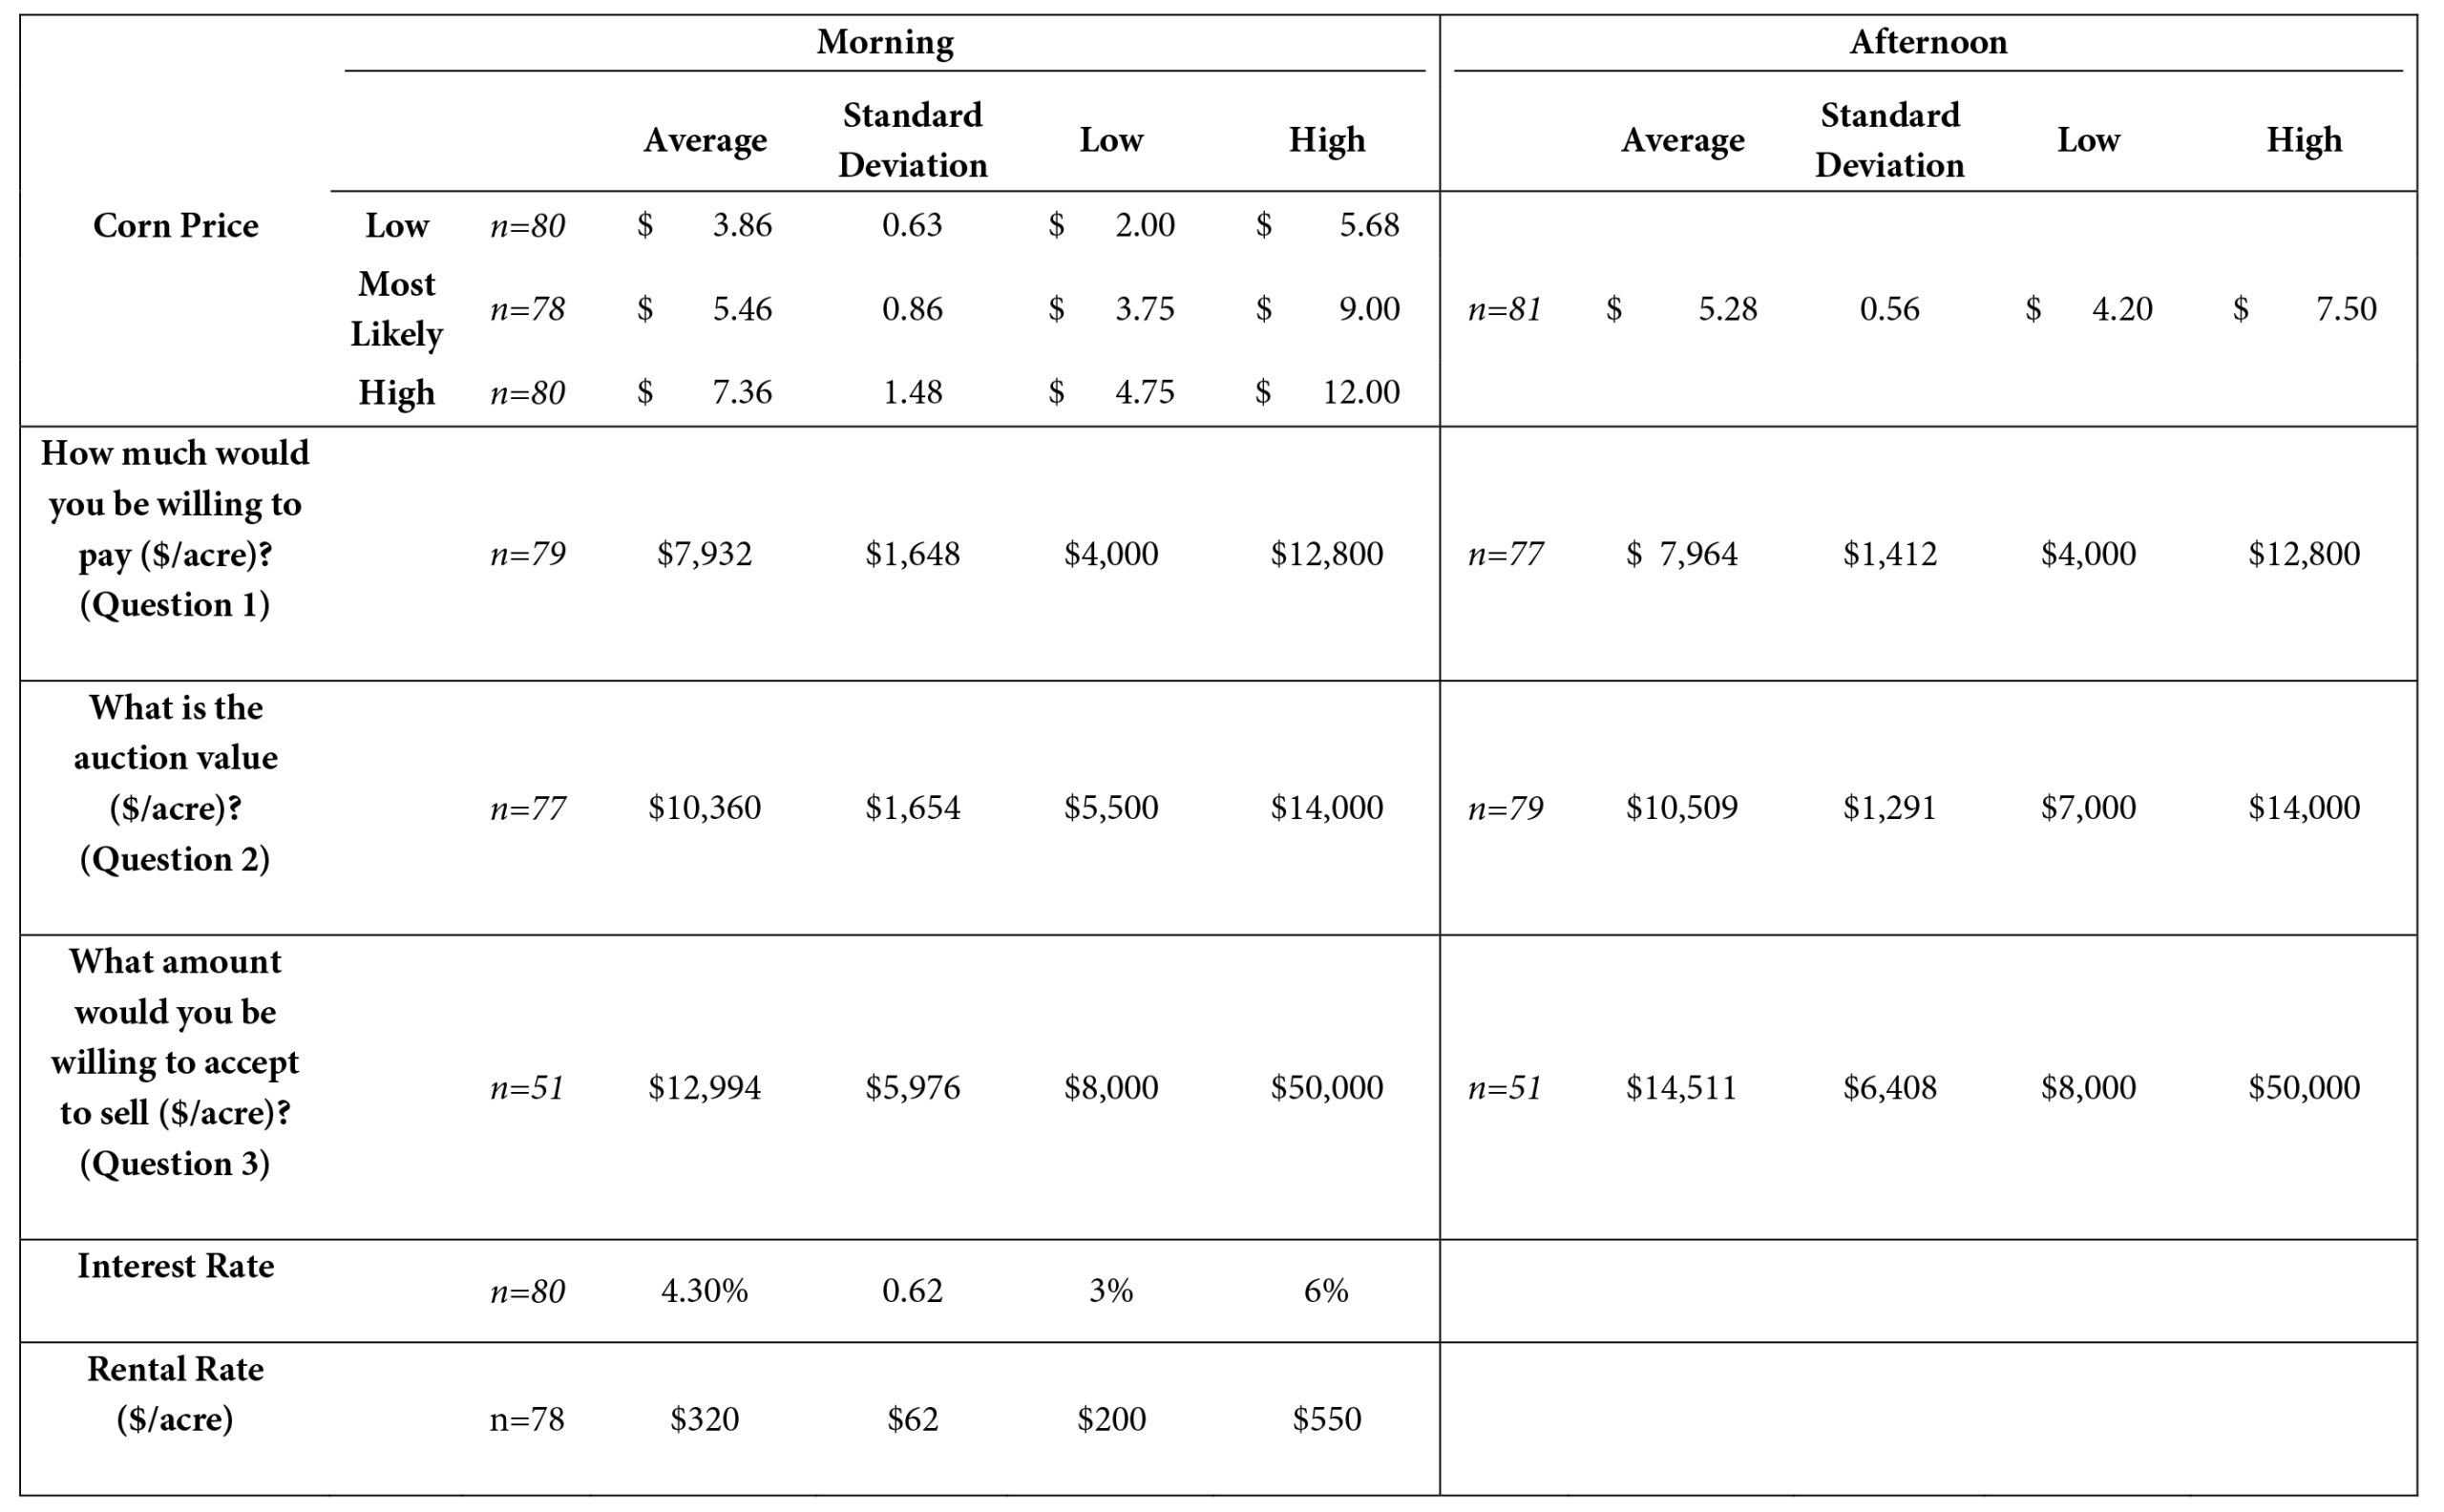
Table 1. Summary statistics from survey questions; morning versus afternoon program responses
Participant Valuation of Sugar Creek Township Farm for Auction
Participants were provided information regarding a farm for sale in Indiana (see Appendix A). Included in this information was a soil productivity assessment stating that under normal conditions that yield expectations were 185 bushel/acre on a continuous corn system. With this information in hand, participants were asked three distinct questions regarding the values of this farm in both the morning and afternoon sessions of the program. Morning and afternoon responses are detailed in Table 1 and Figure 5. Specifically, they were asked:
- After reviewing the farmland sale brochure, how much would you be willing to pay for this farm today ($ per acre)?
- After reviewing the farmland sale brochure, how much do you think this farm would sell for at an auction today ($ per acre)?
- If you owned a farm like this (comparable land), what price would you be willing you accept for it? If you are not interested in selling at any price, please enter “99”9.
A total of 79 participants responded to question 1 during the morning session, with an average willingness to pay of $7,932 and a standard deviation of $1,648. The range of participants’ willingness to pay for the described farm was from $4,000 to $12,800. In the afternoon session, after experiencing the entire program, 77 total participants responded to the same question. The average willingness to pay was practically identical to the morning session at $7,964 with a slightly smaller standard deviation of $1,412.45. The range in answers to question 1 in the afternoon session was identical to the range from the morning session.
A total of 77 participants responded to question 2 during the morning session, with an average estimate of auction value of $10,360 and a standard deviation of $1,654. The range of $8,500, from $5,500 to $14,000, was slightly smaller than the total range in answers for question 1. After participating in the one-day program, a total of 79 people responded to question 2 in the afternoon session. The average estimated auction sale price was $10,509 with a standard deviation of $1,291. While the average estimated auction sale price was only slightly higher in the afternoon than in the morning session, the variation in answers was less with a lower standard deviation and a range of only $7,000.
Question 3 was unique in asking participants what they would accept in terms of payment to sell land comparable to the farm advertised in the program. Participants who would be unwilling to sell at any price were asked to enter “99” into their audience response device in order for their responses to be removed from the data set (to avoid impacting average sale prices with those opting out of the market). Thus, participants had the option to remove themselves from the market by entering “99”. A total of 51 participants indicated that they were willing to sell, with an average willingness to accept of $12,994. The standard deviation on the willingness to accept was $5,976, which is much larger than any standard deviation in responses for questions 1 and 2. Furthermore, the range of responses was $42,000, which is a six times larger than the range in the afternoon session for the estimated auction value of the land. Clearly, selling land (of the value described in the program) was perceived very differently than buying land of similar characteristics. In the afternoon session, 51 total participants were willing to sell land, but the average willingness to accept increased to $14,511 with a standard deviation of $6,408. The range in answers for the afternoon session remained the same ($42,000) as the morning session in terms of answers to question 3.
Beyond the expected corn price and land values at auction, participants were asked their expectation of rental rates for the same farmland. The mean expected rent was $320 with a range from $200 to $550 across 78 participants. Therefore, on average, participants were willing to purchase land at approximately 25 times the cash rental value. A multiple of 25 is consistent with recent measures; Gloy et al. (2012) found that survey participants were willing to pay 26.5 times the rental rate to purchase land. While relatively high in historic terms, these values are consistent with land markets in recent years in the Corn Belt.
In addition to willingness to buy, willingness to sell and estimates of revenue streams via corn prices or rental rates, participants were asked to consider the cost of credit and their expected interest rate to finance the farm in question. Thus, participants were asked, “If you were to borrow the money to purchase this farmland today, what would you expect the annual interest rate to be ___?” The average interest rate (across 80 respondents) was 4.30 percent with a range from 3 percent to 6 percent.
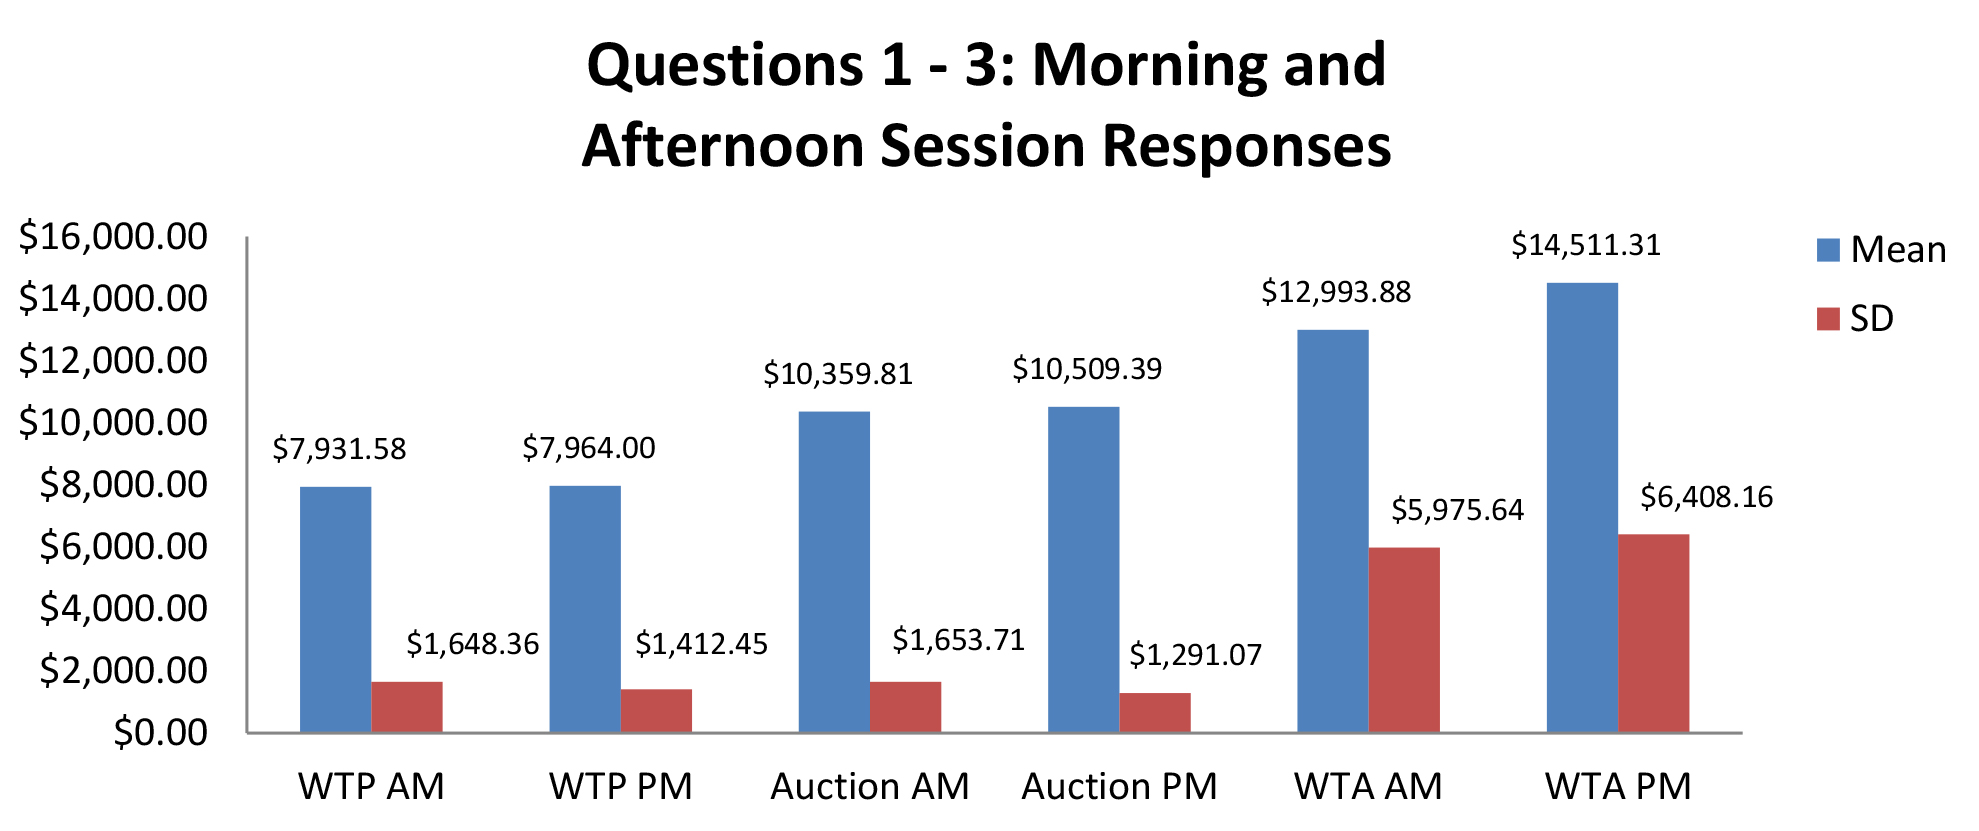
Figure 5. Question 1-3: Morning and Afternoon Session Resposes
Relationships Between Revenue Generation and Farmland Values
Farmland derives its economic value from the future earnings that it generates. It is important to examine whether market participants are considering the future income generating potential when deriving farmland values.
Corn price expectation versus an individual’s stated willingness to pay for farmland is presented in Figure 6. Given that participants own willingness to pay was, on average, less than they expected the land to sell for at auction, it could be hypothesized that participants perceive a disconnect between their own valuation of farmland and the expected auction sale price. Thus, investigating an individual’s willingness to pay for the land versus their own expectation of corn price is expected to demonstrate some relationship, if you believe that expectations of future income streams directly impact asset valuation.

Figure 6. Most likely corn price versus willingness to pay for farmland, 96 respondents, March 2013
Inspection of Figure 6 reveals, again, no discernible relationship between the most likely corn price expected in the next five years and an individual’s willingness to pay for farmland. Crop prices, (here corn prices) are one measure of expected future income potential of farmland. Another measure of expected future income potential is farmland rental rate. Thus, Figure 7 displays the relationship between farmland rental rates and expected most likely corn prices. Results, from visual inspection, are very similar to those from the comparison of expected most likely corn prices and willingness to pay for farmland – no discernible relationship.
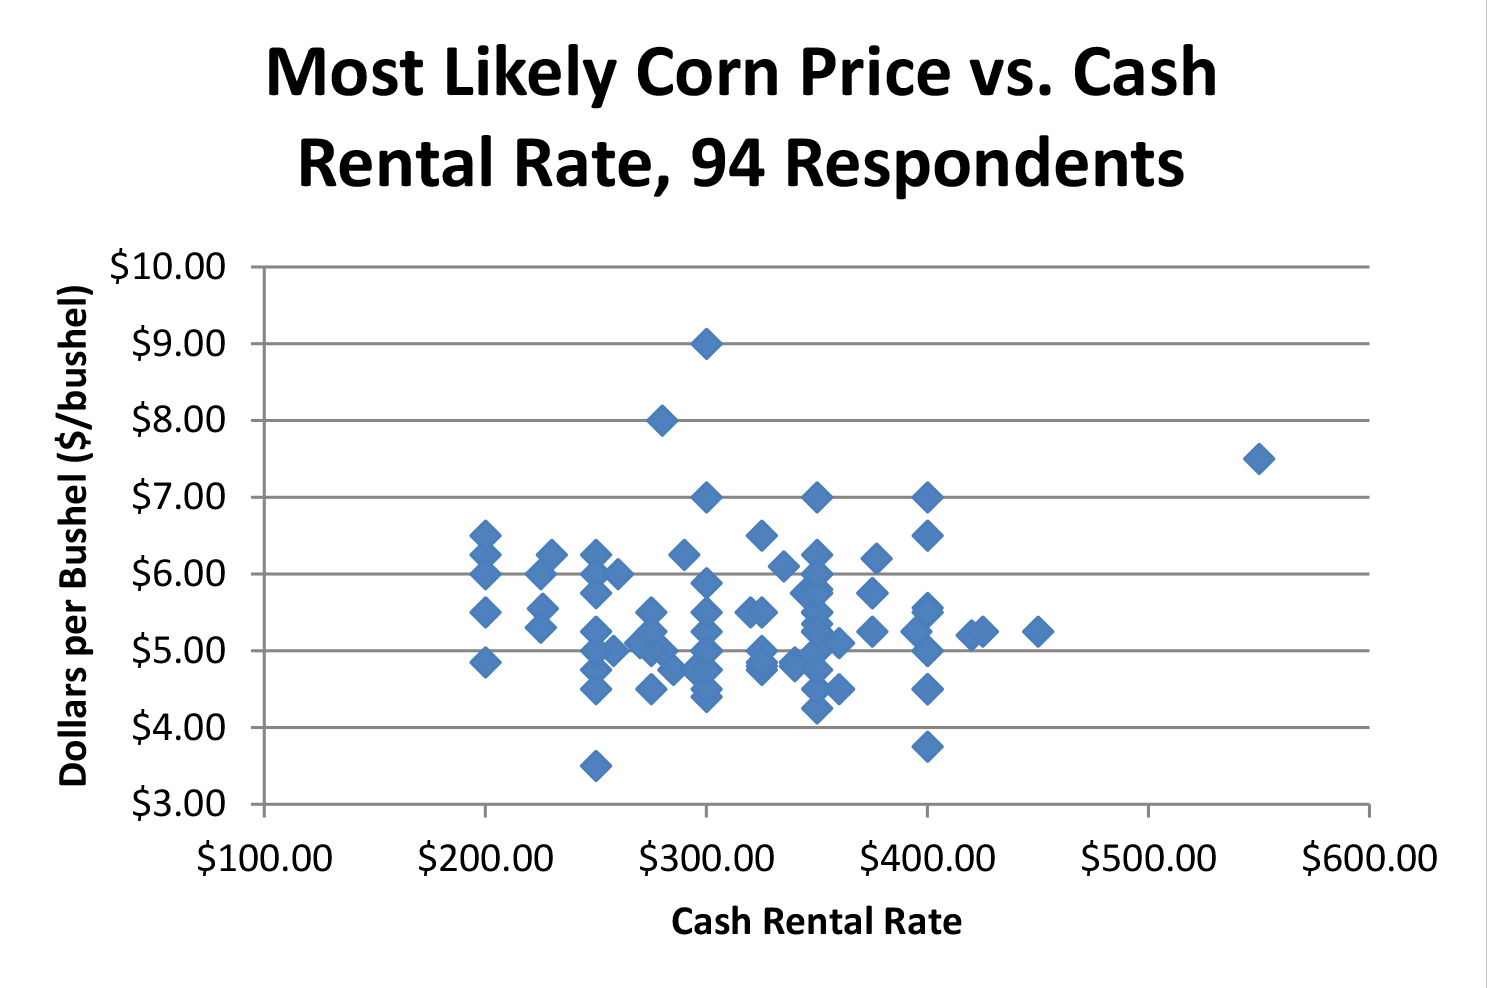
Figure 7. Most likely corn price versus cash rental rate, 94 respondents, March 2013
Possible explanations for the apparent disconnect between farmland valuation and/or rental rates and expected corn prices are numerous. Gloy (2013) points out that frequently individuals do not make the connection between the fundamentals of expected income and interest rates when valuing farmland. However, even if fundamentals are taken into account, expectations of costs of production and prices received in the future vary greatly across individuals. Thus, differing expectations should lead to differing farmland values, but the lack of positive relationship between output prices and willingness to pay for farmland or rental prices does potentially undermine this argument.
In Summary
A number of conclusions are apparent when analyzing the data from participants in terms of farmland value expectations, with the most obvious conclusion being that participant opinions about the value of farmland and its future income potential vary widely. There is also no clear relationship between participants’ individual assessments of farmland values and income potential. Furthermore, expectations of farmland auction values are generally higher than what individual participants are willing to pay for farmland. These results are very similar to earlier findings reported by Gloy et al. (2012). Of particular interest is the significantly higher willingness to accept to sell land compared to willingness to pay to purchase land, even after those opposed to selling were removed from the data set.
When asked at the very conclusion of the program whether or not they believed that farmland prices were in a bubble, slightly more than 54 percent of respondents indicated that yes, they do believe prices are in a bubble (Figure 8).
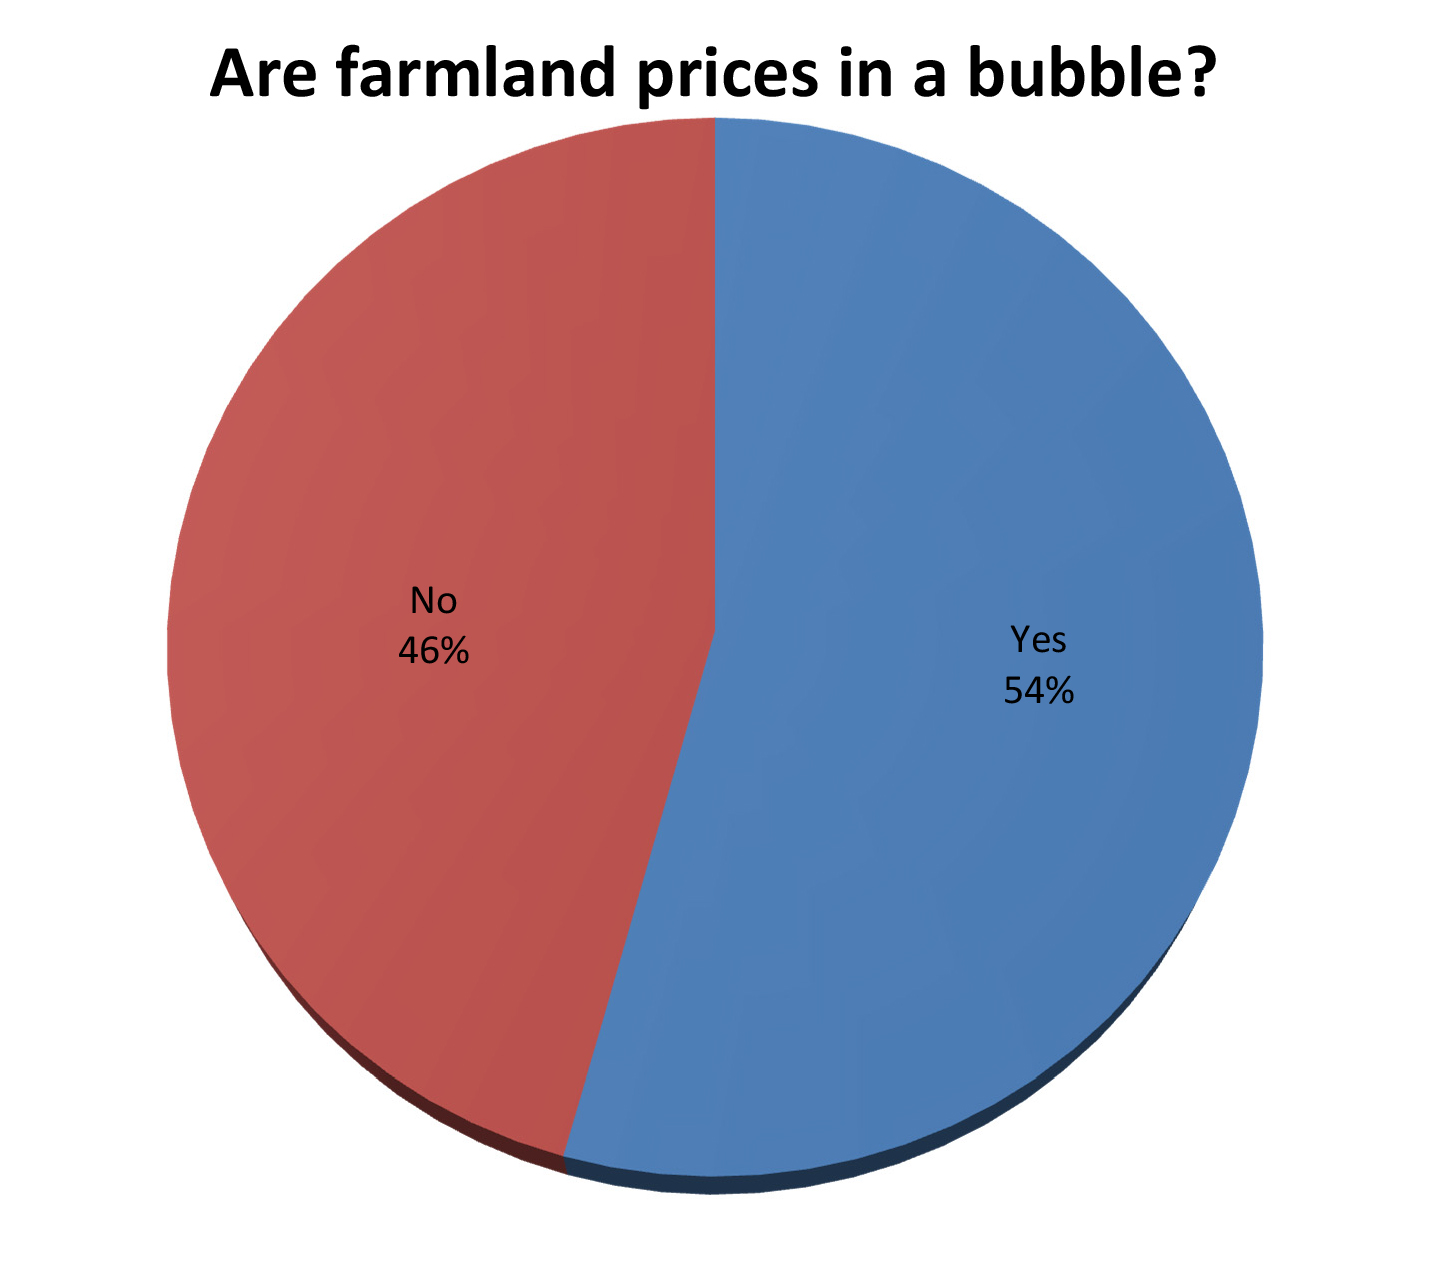
Figure 8. Do you believe that farmland prices are in a bubble?
Similar to previous work, another deduction surrounds the lack of evidence of a clear incorporation of revenue streams (especially corn price) into farmland values. While there was no positive relationship found between these factors, there was admittedly also no negative relationship. Certainly, expectations vary widely and, again, similar to previous studies (Gloy, 2013), expectations of corn prices at the high end of the distribution reported support farmland values reported in this survey, as well as in the market.
Works Cited & Further Information:
Dobbins, C., B. Gloy, M. Boehlje, and C. Hurt. “Are Current Farmland Values Reasonable?” Purdue Agricultural Economics Report, April 2011.
Gloy, B., 2013. “Thoughts on the Relationship between Corn Price Expectations and Farmland Values.” Center for Commercial Agriculture, Purdue University, April 2013. https://www.agecon.purdue.edu/commercialag/resources/finance/farmlandvalues/Corn_Prices_and_Land_Values.pdf
Gloy, B. et. al., 2012. “Farmland Value Expectations and Influences: Evidence from the Field.” Center for Commercial Agriculture, Purdue University, May 2012. http://www.agecon.purdue.edu/commercialag/resources/finance/farmlandvalues/Farmland_Values_Report_FINAL.pdf
Gloy, B.A. “Farmland Values: Will the Boom Turn Bust?” Center for Commercial Agriculture, Research Paper, (Also Published in Proceedings for 2012 Agricultural Symposium of the Kansas City Federal Reserve http://www.kansascityfed.org/publicat/rscp/2012/gloy-paper2012.pdf), July 20, 2012.
Gloy, B.A., C. Hurt, M. Boehlje, and C. Dobbins. “Farmland Values: Current and Future Prospects.” Center for Commercial Agriculture, Research Paper, January 11, 2011.
Gloy, B.A., M.D. Boehlje, C.L. Dobbins, C. Hurt, and T.G. Baker. “Are Economic Fundamentals Driving Farmland Values?” Choices, 26:2(2011).
Appendix A: Information provided to program participants surrounding farmland in question for survey:


![]()
![]()
![]()
![]()
![]()
TAGS:
TEAM LINKS:
RELATED RESOURCES
UPCOMING EVENTS
We are taking a short break, but please plan to join us at one of our future programs that is a little farther in the future.