May 1, 2026
Producer Sentiment and Land Value Expectations
By Michael Langemeier and Joana Colussi
![]()
![]()
![]()
![]()
![]()
While producer sentiment and farmland value expectations are influenced by a common set of economic drivers – such as interest rates, farm income, and policy uncertainty – they offer distinct perspectives on the agricultural outlook. Using results from the March 2026 Purdue University-CME Group Ag Economy Barometer (AEB) survey, this article examines differences in sentiment between producers who expect land values to decline over the next 12 months and those who expect land values to increase. The AEB index and land value expectations are reported monthly based on responses from approximately 400 U.S. Agricultural producers. The AEB index for March 2026 was 127, indicating that average sentiment was more positive than during the index’s base period, which includes the fourth quarter of 2015 and the first quarter of 2016. The AEB index is subdivided into two sub-indices: the Index of Current Conditions (ICC) and the Index of Future Expectations (IFE). Index values for March 2026 were 126 for the ICC and 128 for the IFE (Langemeier and Colussi, 2026).
Producer Sentiment by Land Value Expectation Group
Respondents to the March 2026 AEB survey were sorted into two categories: those who expect land values to be lower 12 months from now and those who expect land values to be higher 12 months from now. Approximately 10% of respondents expected land values to be lower while 35% expected them to be higher.
Table 1 presents characteristics and producer sentiment for the entire sample, for those who expect land values to be lower, and for those who expect land values to be higher. Producer sentiment, particularly the Index of Current Conditions was higher for those who expect higher land values.

Table 1. Producer Sentiment and Land Value Expectations
The Farm Capital Investment index measures whether respondents think now it is a good time or a bad time to make farm investments, including items such as machinery and buildings. An index below 100 indicates that more respondents think it is a bad time rather than a good time to make such investments. The Farm Capital Investment index was 34 for the respondents who expect lower land values and 72 for those who expect higher land values. Not surprisingly, a much higher percentage of those who expect land values to increase in the next 12 months also expect land values to be higher 5 years from now.
The Financial Performance index measures whether a farm expects its financial performance to be better than, worse than, or about the same over the next 12 months. An index below 100 indicates that more farms expect their performance to be worse rather than better in the next 12 months. The average index for March was 102. The average index for the farms that expect lower land values was 93, while the farms that expect higher land values, with a reading of 111, were more optimistic.
Another monthly AEB question asks respondents to identify their biggest concerns for their farm, using the following response choices: lower crop and/or livestock prices, high input costs, environmental policy, farm policy, interest rates, and availability of inputs. High input costs were the biggest concern for both groups of farms. However, the percentage of respondents that chose input costs as their biggest concern was higher for the respondents that expect lower land values.
Approximately one-third of respondents in the March 2026 AEB survey were livestock producers (i.e., derived more than 50% of their revenue from livestock production). The percentage of the respondents who expect higher land values that were livestock producers was 49%. In contrast, this percentage was only 15% for the group who expects lower land values.
Inflation and interest rate expectations were similar among the farm groups. A relatively higher percentage of the respondents that expect higher land values think the U.S. is generally headed in the right direction.
Factors Influencing Farmland Values
One of the monthly AEB survey questions asks respondents to indicate which of the following factors is having the most influence on farmland values in their area: net farm income, interest rates, alternative investments, inflation, liquidity, and agricultural policy. Figure 1 illustrates differences in responses to the land factor question between those who expect lower land values and those who expect higher land values. The most important factor identified by the group expecting lower land values was net farm income. In contrast, the most important factor for the group expecting higher land values was alternative investments.
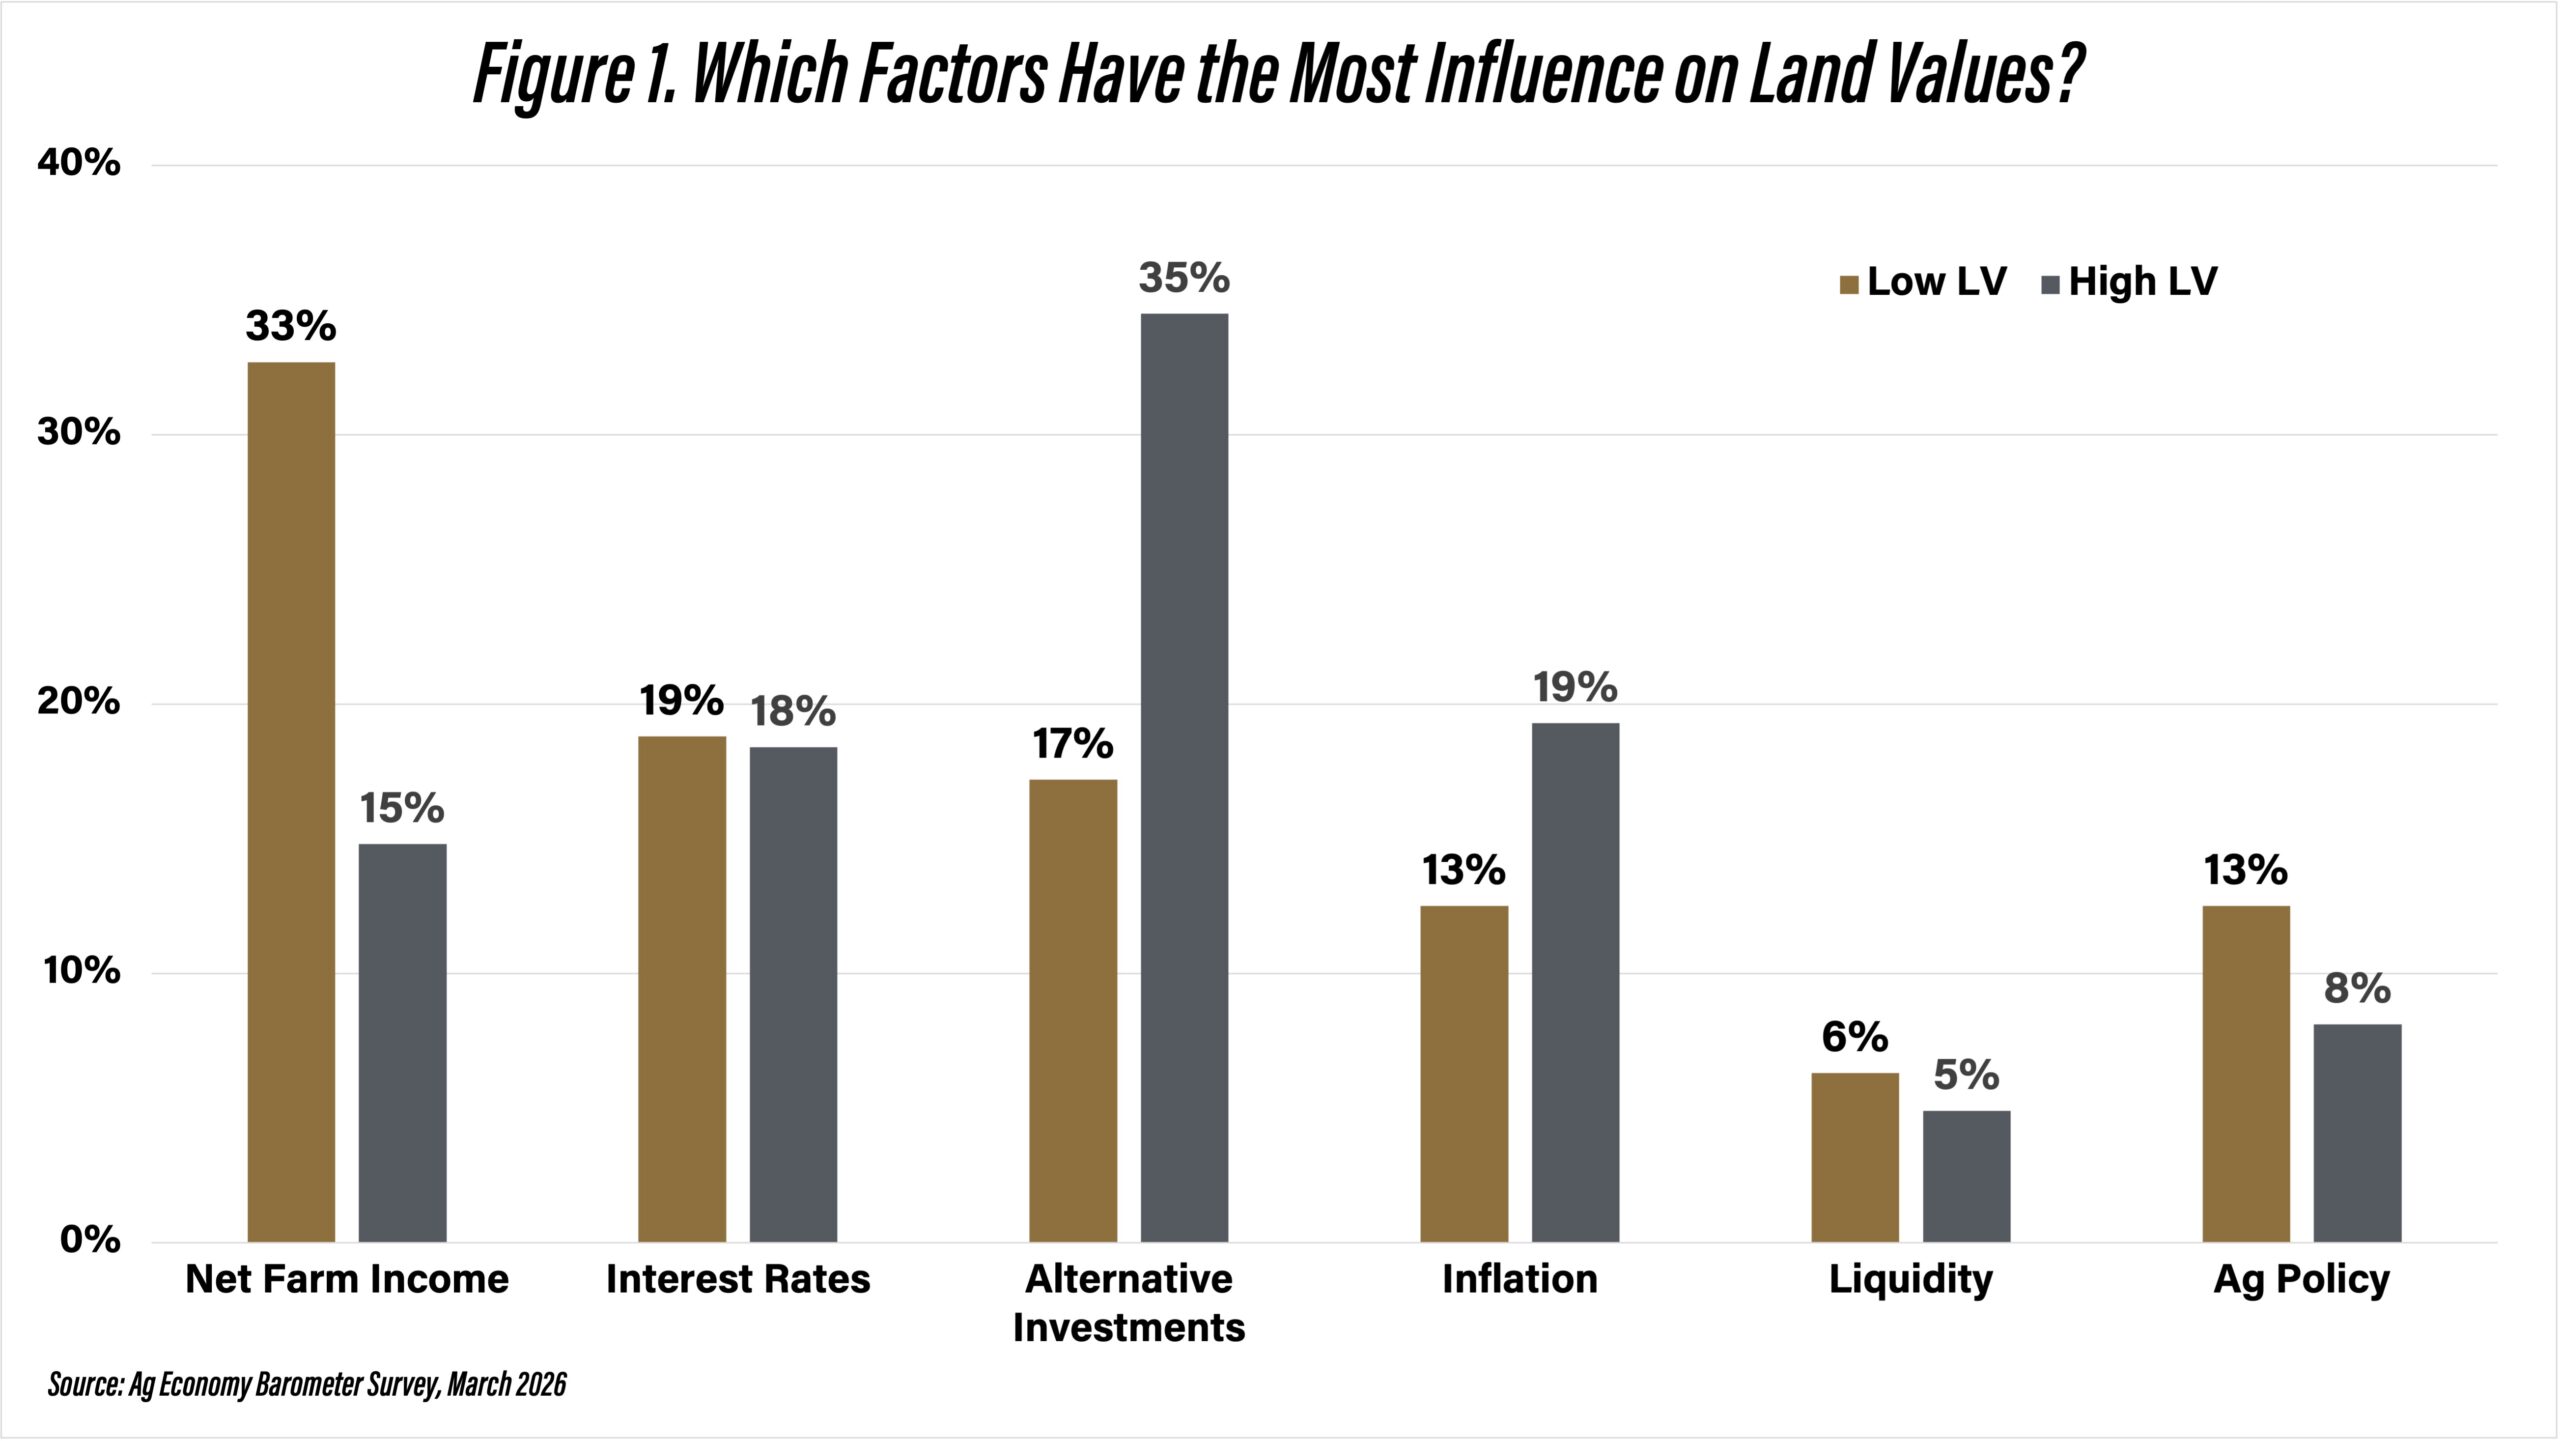
Figure 1. Which Factors Have the Most Influence on Land Values?
Respondents are not asked whether each of the six factors has a positive or a negative influence on land values. Based on the differences in producer sentiment and financial performance expectations, we presume that net farm income is a negative influence for the respondents who expect lower land values and that alternative investments are a positive influence for the group that expects higher land values. Regardless, the two groups clearly have different views regarding the factors influencing land values in their area.
Conclusions
Respondents to the March 2026 AEB survey who expect land values to decline in the next 12 months are less optimistic about producer sentiment and financial prospects than respondents who expect land values to increase. These respondents are also less optimistic regarding land values five years from now, are more concerned about input costs, and tend to be less optimistic about the direction the U.S. is heading. Going forward, tracking land value expectations alongside the AEB indices can provide additional context for interpreting changes in producer sentiment.
References
Langemeier, M. and J. Colussi. “Farmer Sentiment Improves Despite Rising Input Cost Concerns.” Purdue University-CME Group Ag Economy Barometer, April 7, 2026. Available at: https://ag.purdue.edu/commercialag/ageconomybarometer/.
![]()
![]()
![]()
![]()
![]()
TAGS:
TEAM LINKS:


RELATED RESOURCES
Producers continued to express concern about farm finances as the June Purdue University/CME Group Ag Economy Barometer recorded a 6-point decline in farmer sentiment to 113.
READ MOREUPCOMING EVENTS
We are taking a short break, but please plan to join us at one of our future programs that is a little farther in the future.