February 8, 2015
What is in Store for the Agricultural Land Market?
![]()
![]()
![]()
![]()
![]()
This article briefly discusses key factors driving potential changes in farm land values. These factors include cash rent, long-term interest rate on U.S. Treasuries, inflation, risk premium for the farming sector, and the growth rate of cash rent.
The investment in an asset, such as a stock or agricultural land, depends on the expected returns to that asset as well as the capitalization rate. Expected returns are received in the future so these returns have to be discounted so that they reflect current values. This discounting process is typically done using net present value analysis. The constant growth present value model provides a useful framework to capture the drivers of land values. This model yields the following equation:
(1) Value = R / (r – g)
where value is the asset value, R is the real return to an asset, r-g is the capitalization rate, r is the required real rate of return, and g is the anticipated real growth rate in earnings. For agricultural land, value is the land price, R is real cash rent, r is a long-term real interest rate for land, and g is the real growth rate in cash rent. The long-term real interest rate is determined by the risk free rate as reflected in government securities and a risk premium reflecting the volatility in farm returns.
Before plugging numbers into equation (1), we will examine trends in cash rents, land values, and interest rates. Figure 1 illustrates the trend in cash rents and land values for west central Indiana from 1960 to 2014. Obviously, cash rents and land values are highly correlated. During the period, cash rents and land values declined from 1981 to 1987 and again in 1999. Since 1999, both have increased steadily. The increase in cash rents and land values is particularly dramatic since 2005. Cash rents increased from $140 to $291 per acre from 2005 to 2014. Similarly, land values increased from $3,105 to $9,616 during this period. So, during the last decade cash rents doubled and land values tripled. Based on equation (1), there was something other than cash rents driving land values during the last decade – values increased by a factor of 3 while rents increased by only a factor of 2. Of course, this “something other” is the capitalization rate, which we discuss below.
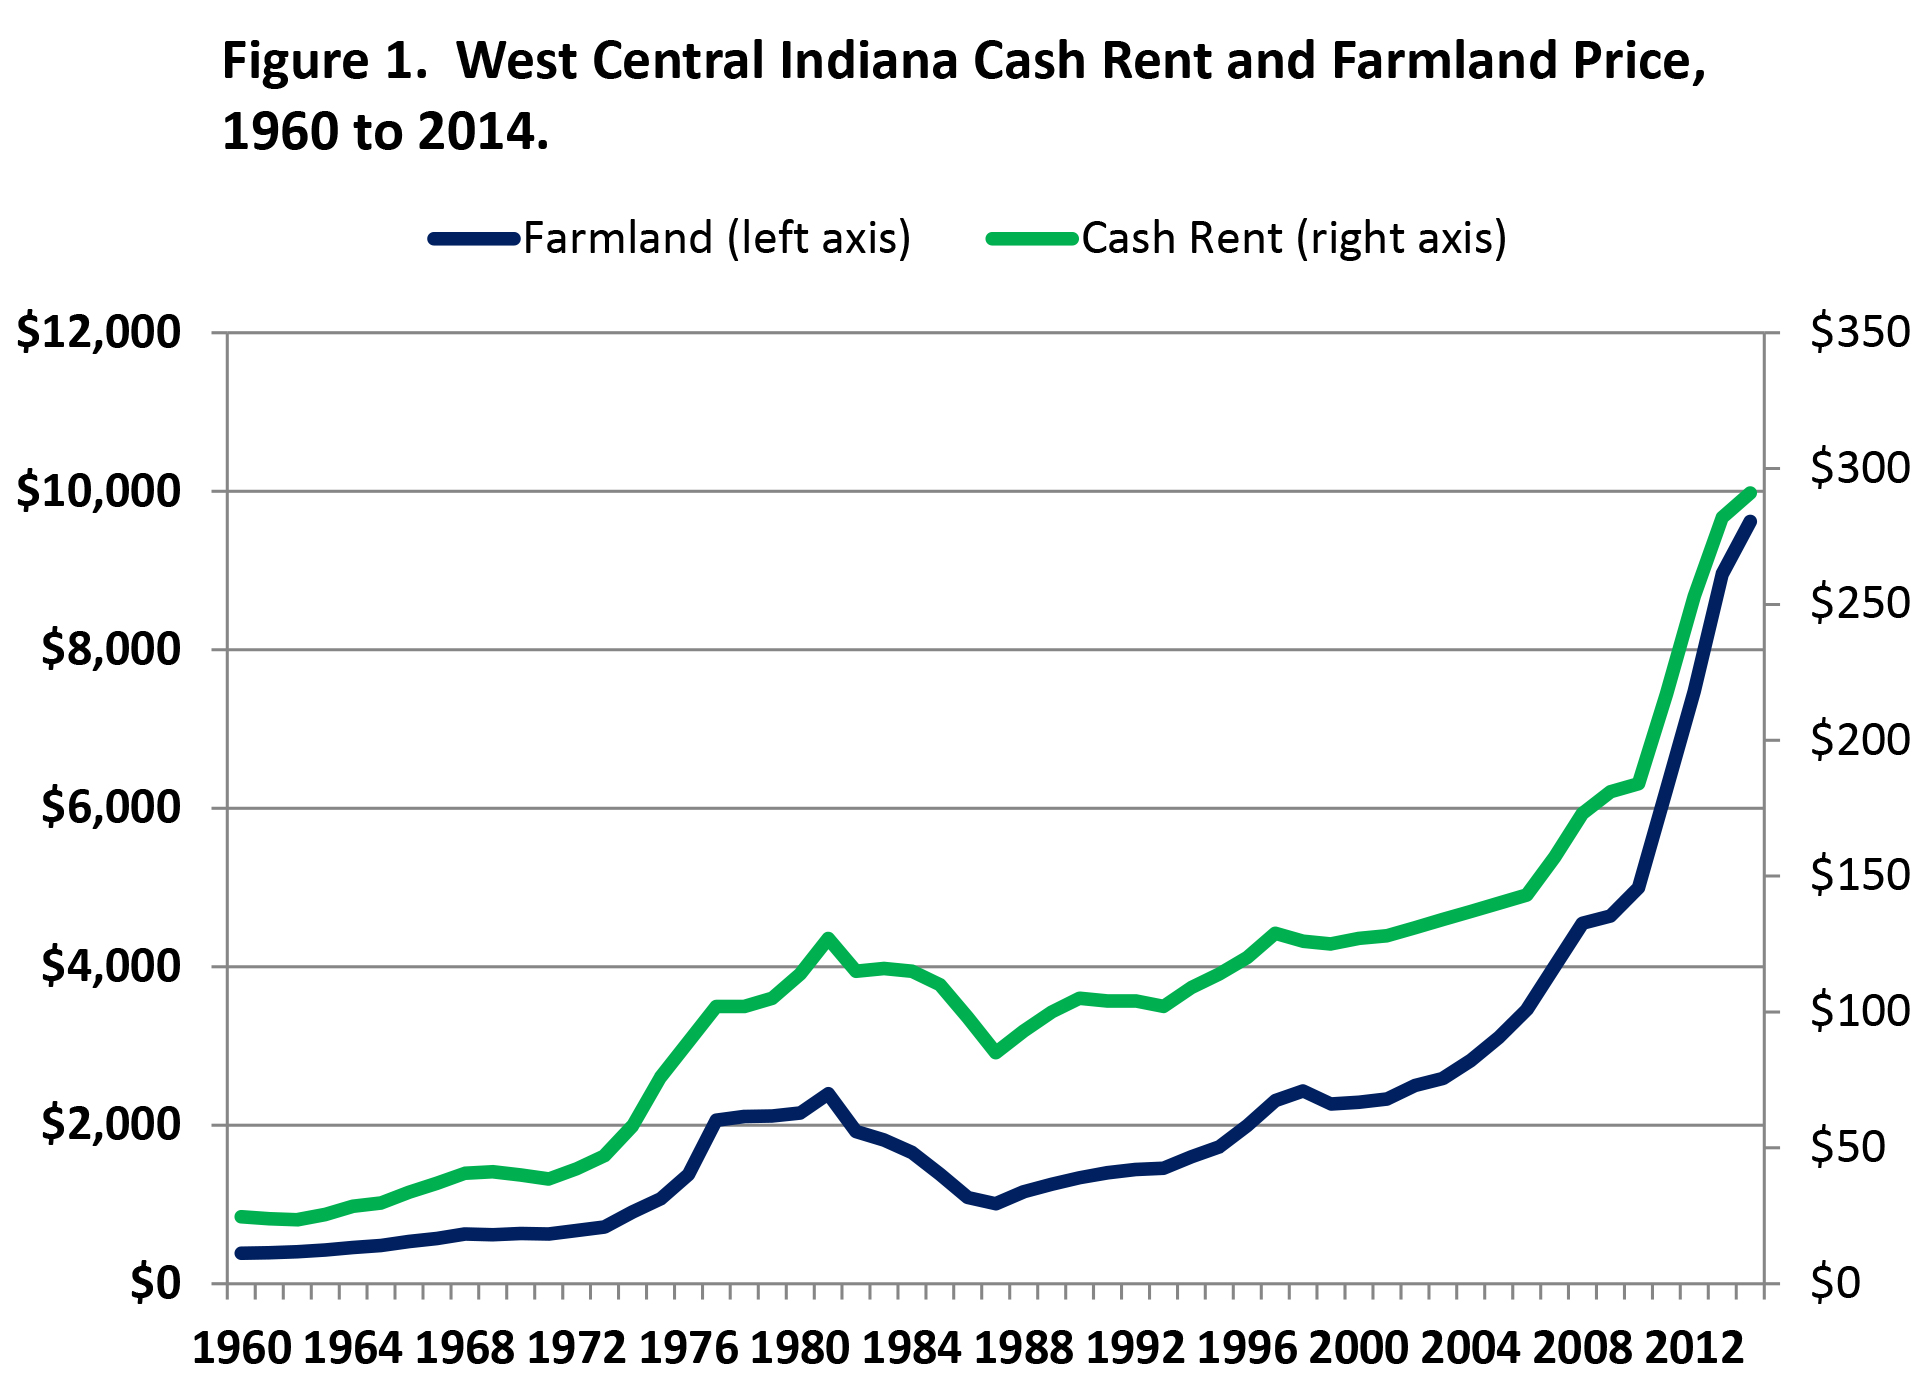
Figure 1. West Central Indiana Cash Rent and Farmland Price, 1960 to 2014.
The long-term real interest rate on land or the capitalization rate depends on the following factors: the long-term rate on U.S. Treasuries (the risk free interest rate), inflation, a risk premium between the long-term interest rate for land and the long-term U.S. Treasury rate, and the growth rate of cash rent. The first three factors can be used to compute the expected long-term interest rate on land. If any of these three factors increases (decreases), the interest rate on agricultural land is likely to increase (decrease). During the last decade, the long-term U.S. Treasury rate, inflation, and the risk premium have been relatively low. This has resulted in historically low agricultural interest rates. Figure 2 illustrates the long-term agricultural interest rates for operating loans and real estate from the first quarter of 1976 to the third quarter of 2014 as reported by the Federal Reserve Bank of Chicago. The real estate interest rates for the first three quarters of 2014 were approximately 4.5 percent below the long-term average. When adjusted for the current rate of inflation of 1.5-2.0 percent, the current real interest rate is closer to 3 percent.
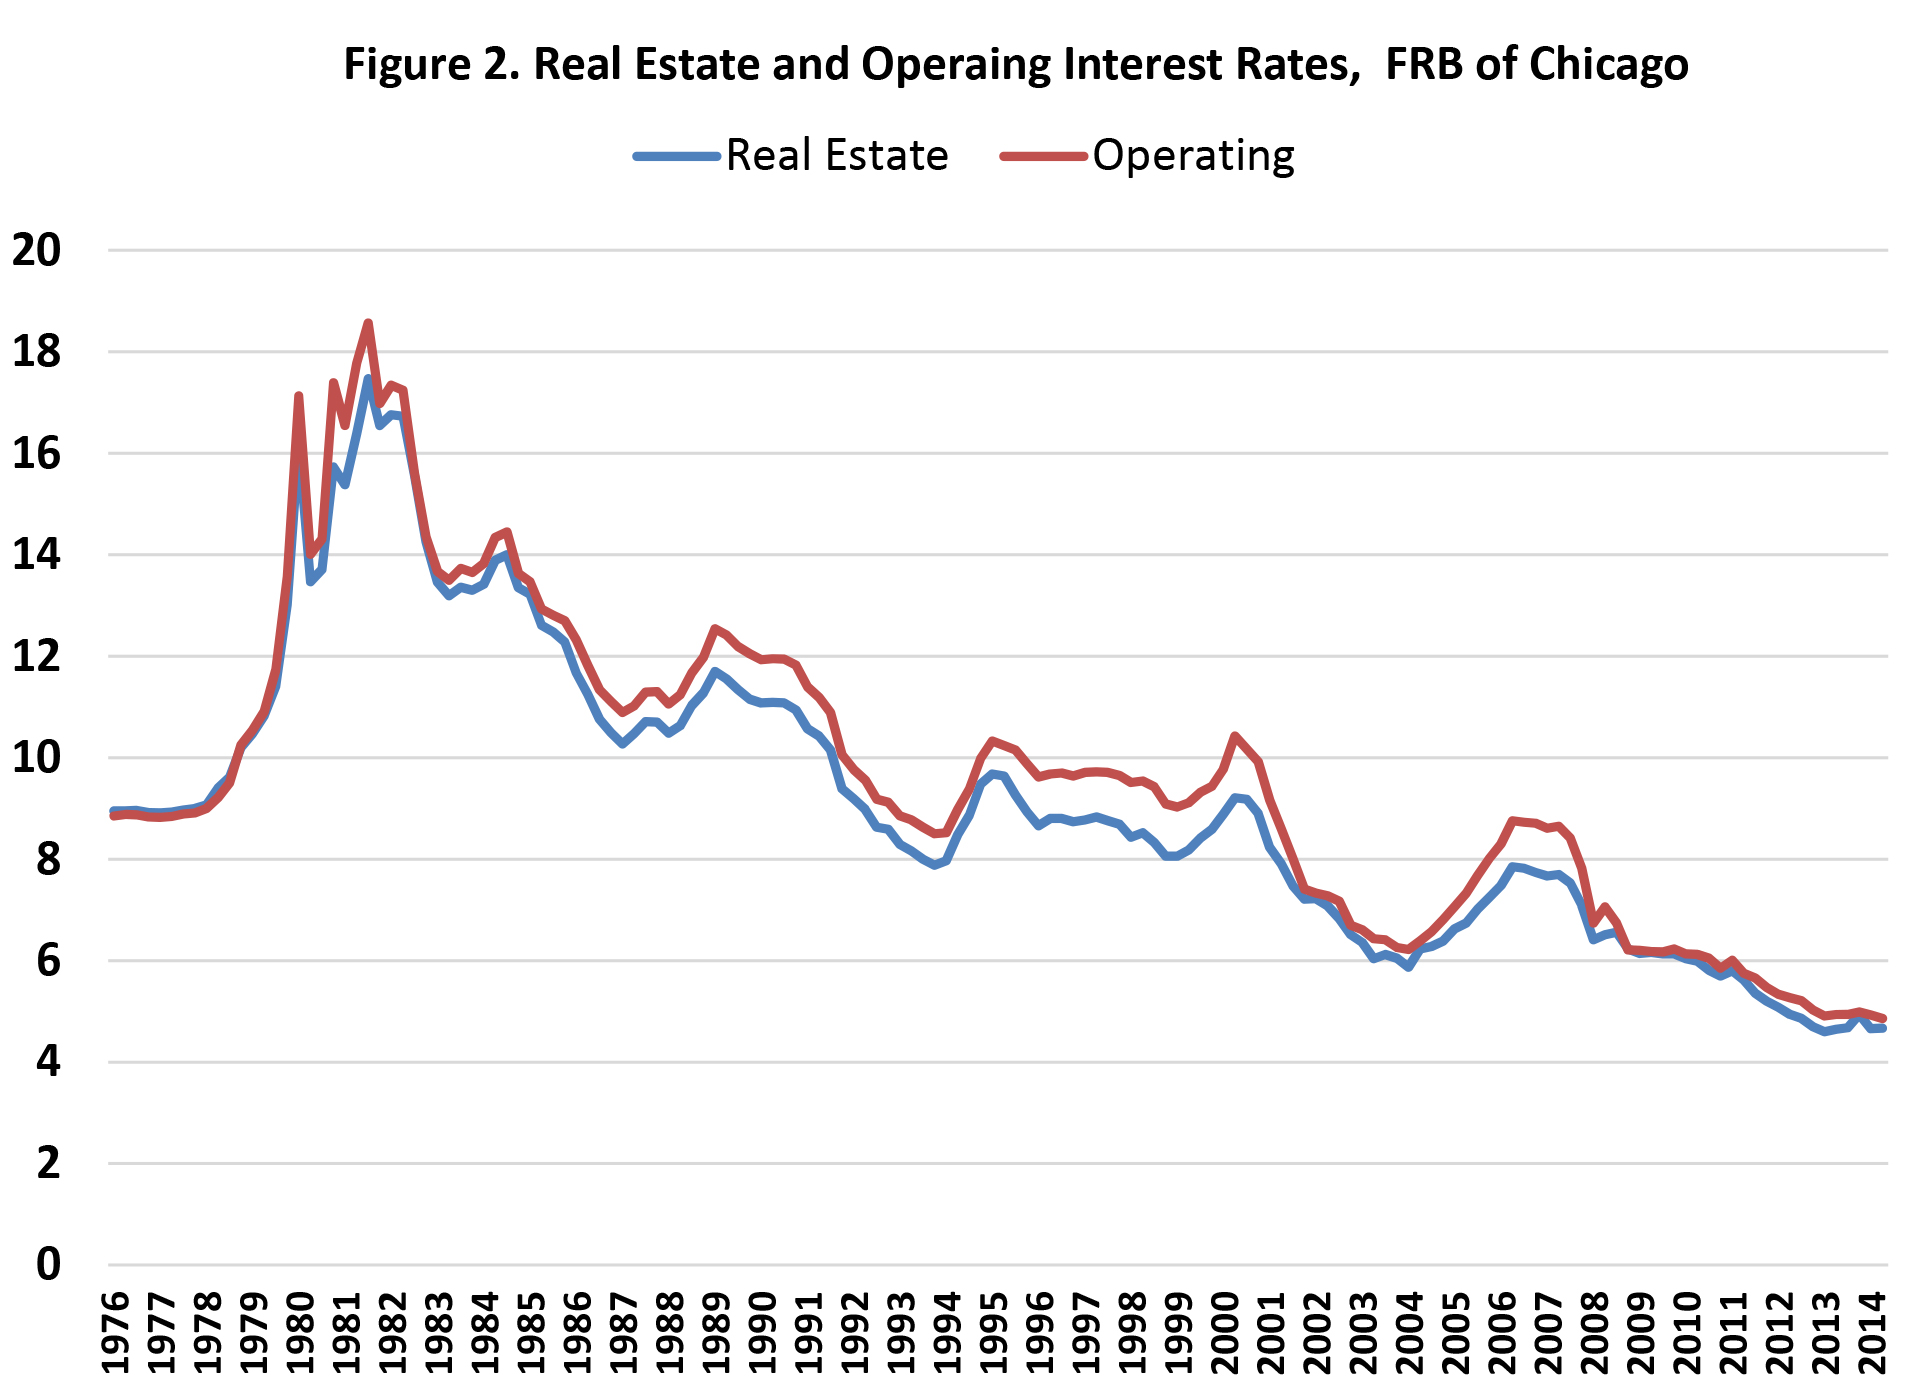
Figure 2. Real Estate and Operating Interest Rates, FRB of Chicago
As noted above, the capitalization rate is also impacted by the growth rate of cash rent. The growth rate of cash rent for west central Indiana farmland in nominal terms since 1960 was 4.6 percent. In real terms, the growth rate was 1.2 percent. The growth rate in cash rents since 2005 was 9.5 percent and 6.1 percent in nominal and real terms, respectively. Since the growth rate is subtracted from the long-term interest rate to obtain the capitalization rate (r-g), if an investor expects a relatively high growth rate, the capitalization rate will be smaller.
Now that we have discussed trends in land values, cash rents, and interest rates, let’s use equation (1) to show how farmland values might adjust in the future. Table 1 illustrates five examples. All of the examples use the long-term average real growth rate for cash rent. The examples differ based on their assumptions pertaining to real cash rent values, real U.S. Treasury rates, and inflation.
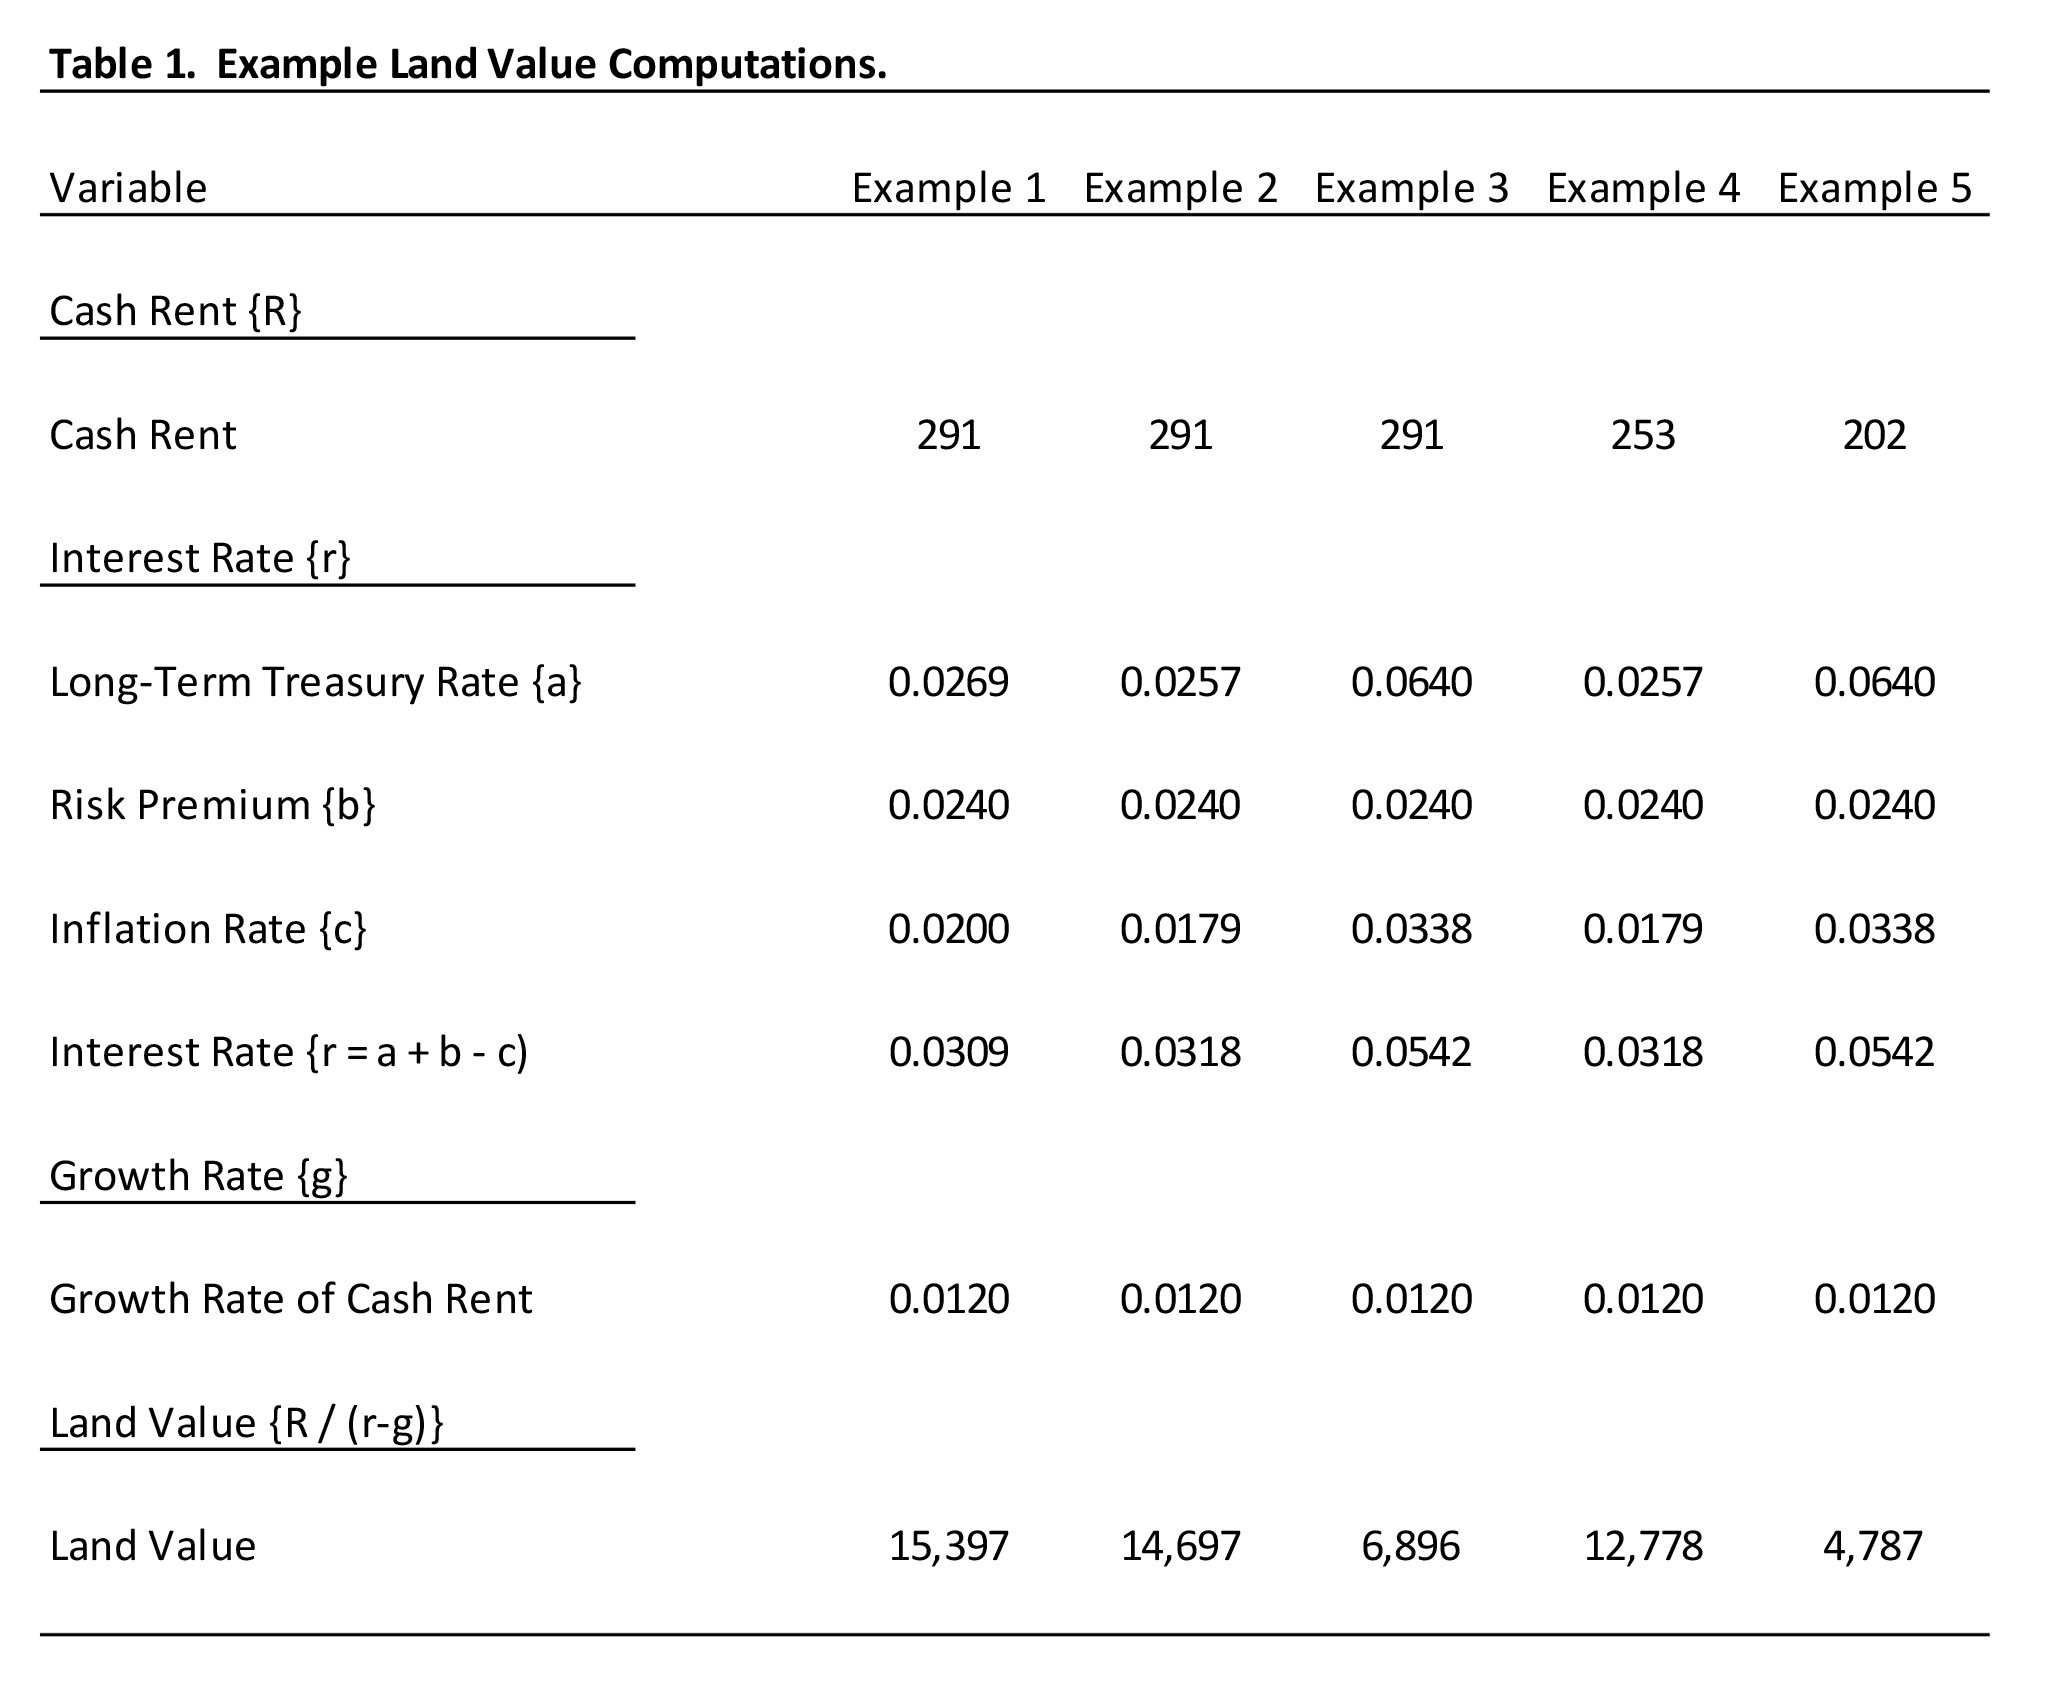
Table 1. Example Land Value Computations.
The first example uses current cash rent, and current interest and inflation rates. If we use these values, we come up with a land price of $15,397 per acre. This would certainly be an optimistic scenario. Given recent trends in crop net returns, there is likely to be some weakening of cash rents. In addition, as the Federal Reserve unwinds its quantitative easing program, there is likely to be an increase in interest rates.
The second example uses current cash rent, and five-year average interest and inflation rates. Land value for this scenario is $14,697, which is still relatively high compared to today’s value. Again for the reasons noted above for the first example, this example is optimistic.
The third example uses current cash rent and long-run average interest and inflation rates (i.e., the average interest and inflation rates for the 1960 to 2014 period). This example depicts what would happen to land values if interest rates returned to their long-run average, which given expected changes in Federal Reserve policy could easily happen. For this example, land value drops to $6,896 or approximately 28 percent lower than the current land value.
The fourth example uses five-year average cash rent, and five-year average interest and inflation rates. Under this scenario, land value is $12,778.
The final example uses long-run average cash rent, interest, and inflation values. This is a pessimistic scenario. It shows cash rent declining approximately 31 percent and interest rates increasing approximately 2.3 percent. The more unrealistic of these two assumptions is the drop in cash rents. Cash rents re likely to soften in the near future, but a drop of 31 percent would be rather large given historical changes. For this scenario, land value drops to $4,797 or less than one-half of the current value.
From the discussion of table 1 above, it is obvious that the interest rate has a large impact on land values. To drive this point home, table 2 illustrates estimated land values for interest rates varying from 3 percent to 7 percent. The cash rent is assumed to be $218 or 25% lower than the current cash rent, and growth rate in cash rent is assumed to be 1.2 percent. This lower cash rent reflects the downward pressure on current cash rent resulting from sharply lower crop net returns. The source of the higher rates is not shown in table 2. Higher rates could result from several factors. The two most likely factors are higher long-term U.S. Treasury rates and higher risk premiums. Land values in table 2 range from $3,759 for an interest rate of 7 percent to $12,111 for an interest rate of 3 percent. The lower rate reflects current rates and average rates for the last five years. The higher rate reflects what may happen if interest rates return to levels that occurred prior to the financial crisis.
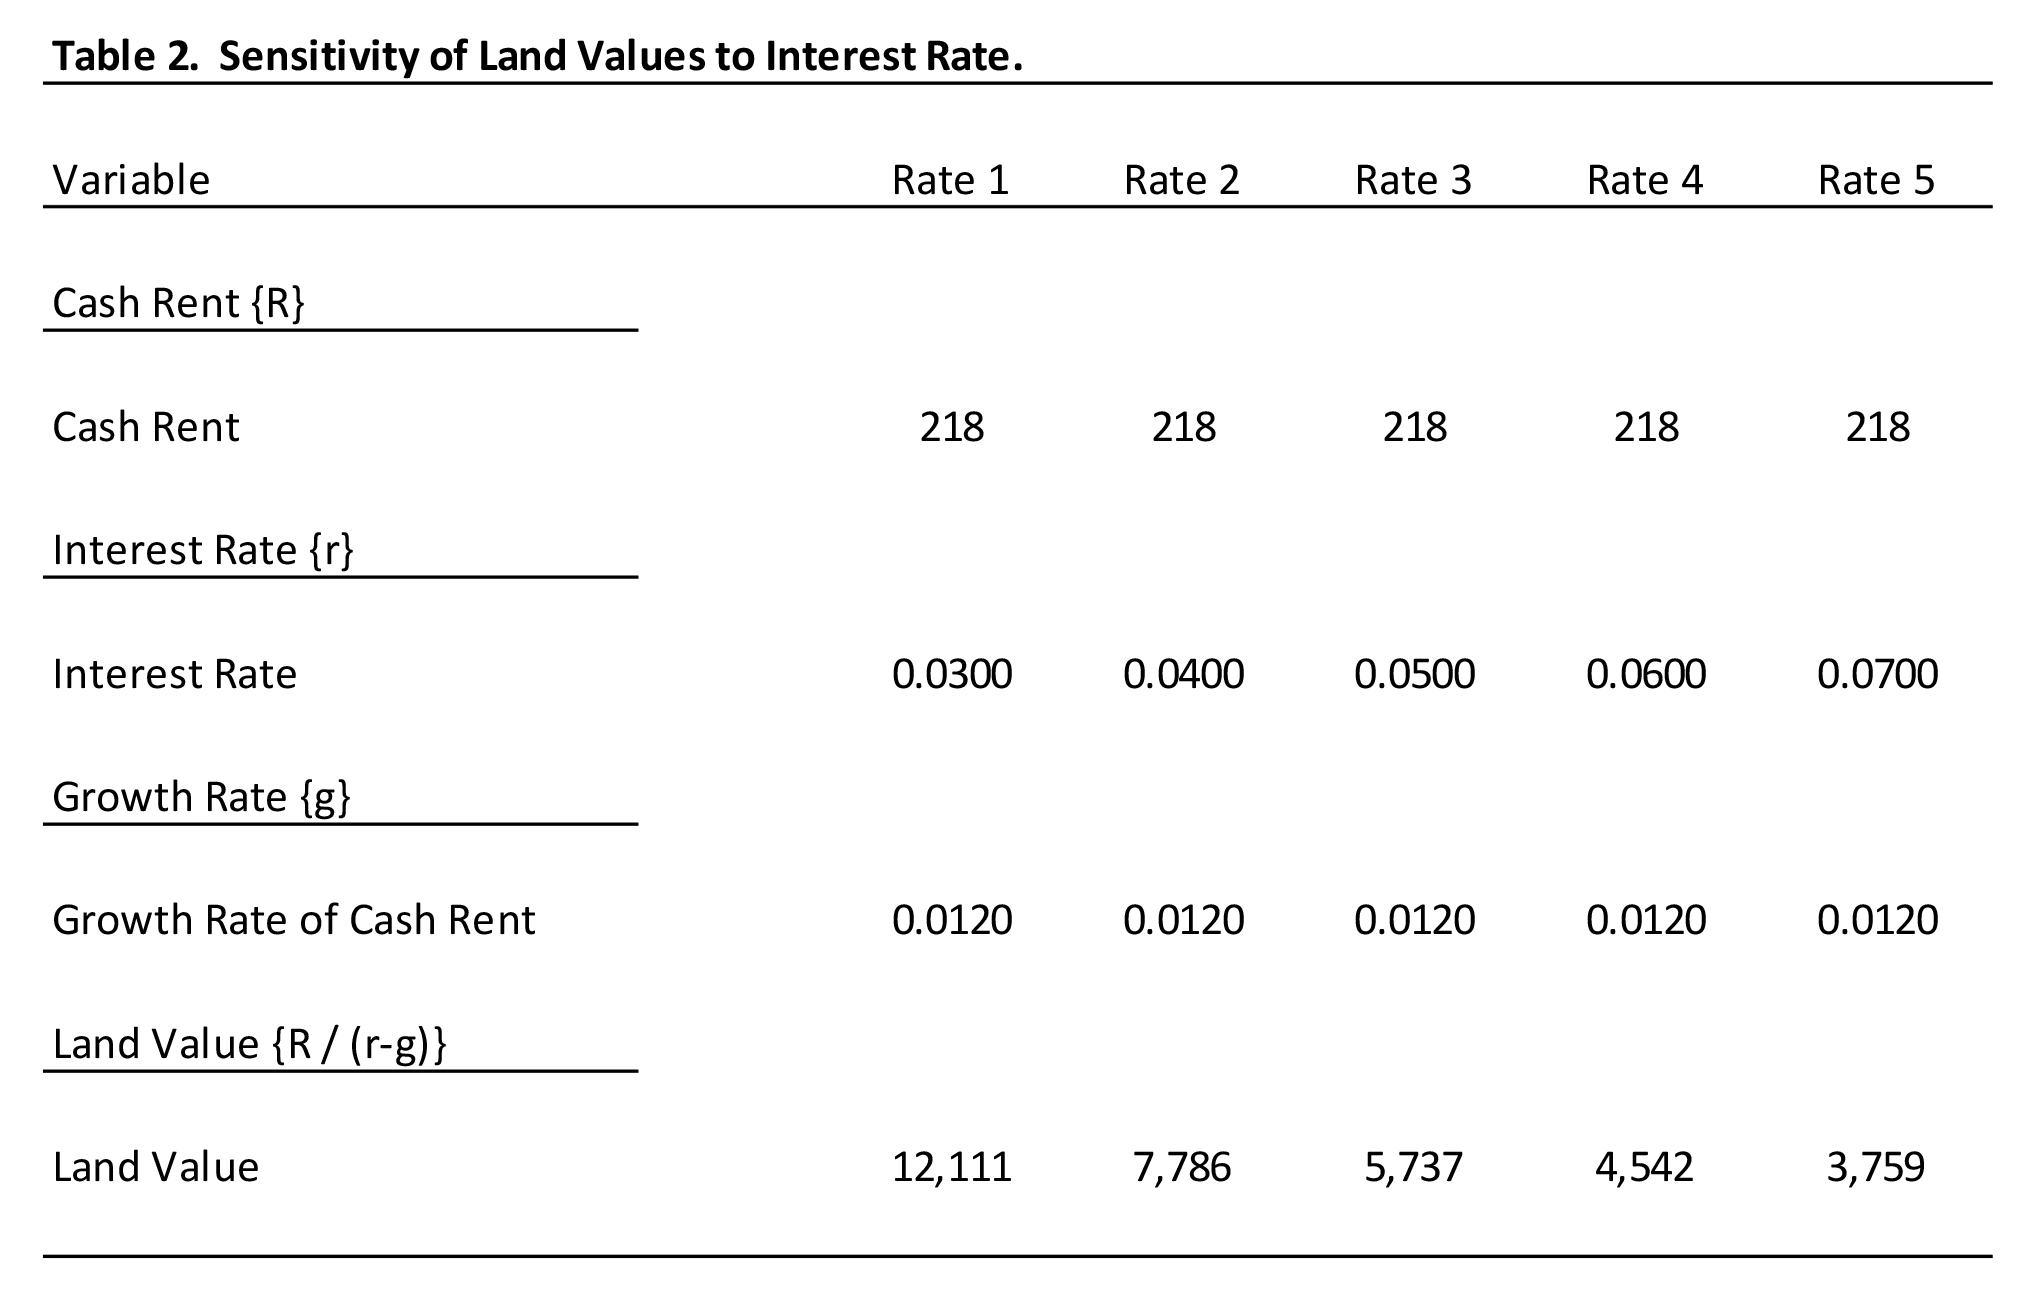
Table 2. Sensitivity of Land Values to Interest Rate.
Conclusion
This article illustrated the relationship between land values, cash rents, and the interest rate or capitalization rate. The determination of the capitalization rate was also discussed. The model used in this paper, though simplistic, illustrates the sensitivity of land values to expected cash rents and interest rates. Expected future trends in cash rents and the capitalization rate do not bode well for agricultural land values. The recent drop in crop net returns will put downward pressure on cash rents. As the Federal Reserve unwinds its quantitative easing program, upward pressure will be placed on real interest rates. This pressure on real interest rates for agricultural land will be compounded by the expected increase in the risk premium that is added to the U.S. Treasury rate to account for higher risk in the agricultural sector. This expected increase in the risk premium is based on the recent decline in crop prices and the deterioration in crop net returns. The combination of lower cash rents and higher interest rates suggest that land values are likely to move in one direction, downward.
![]()
![]()
![]()
![]()
![]()
TAGS:
TEAM LINKS:
RELATED RESOURCES
UPCOMING EVENTS
We are taking a short break, but please plan to join us at one of our future programs that is a little farther in the future.