October 8, 2016
An Update on the Farm Safety Net
![]()
![]()
![]()
![]()
![]()
In an earlier article (April 2016), we projected earnings for a case farm in west central Indiana, and examined the sensitivity of earnings and farm program payments to changes in price and yield. Using base corn and soybean prices of $3.75 and $8.73, projected earnings for a corn/soybean rotation in our earlier article was a loss of $126 per acre. This article updates projected earnings and reexamines the sensitivity of farm program payments to possible prices and yields for this fall’s crops.
The Public Sector Safety Net
The public sector safety net that is now in place to buffer crop farmers from the economic downturn has two dominant components (not including disaster assistance and other programs such as low interest emergency loans) – payments received under the farm program (ARC-CO, ARC-I, or PLC), and subsidized crop insurance. The majority of Midwest corn and soybean farmers chose the Agricultural Revenue Coverage – County Option (ARC-CO) farm program option which in essence provides a payment per base acre of corn and soybeans that depends on the level of yields and prices – more information pertaining to the program can be found in in Zulauf et al. (farmdoc daily, September 1, 2016). The crop insurance program provides an indemnity payment to farmers if prices and/or yields decline, depending on the program and coverage level chosen. The most common program choice is revenue protection (RP) which buffers gross revenue from price and/or yield reductions – coverage level choices range from 50 to 85 percent of market revenue.
When the crop insurance and farm programs were initiated, it was anticipated that they would provide an effective safety net for farmers who might encounter significant price and/or yield reductions due to changing market conditions or weather/disease events. But crop insurance indemnities adjust to market conditions over time. If prices systematically decline, the potential indemnity also declines. Farm program payments under the ARC-CO program are capped, and they decline as market prices increase. So in contrast to the most recent direct payment program that resulted in a pre-specified amount of income and cash irrespective of market prices, under the current program higher prices may result in more income from the market and less from the government in many circumstances (a “dead zone”). Also, it is important to note that cash payments from the ARC-CO program are not received until approximately a year after the crop is harvested, so they are not available to meet cash flow requirements in the year of actual production.
Given these characteristics of the safety net, how effective will it be in buffering the financial stress that crop farmers are currently facing? The numerical analyses below provide insight into the answer to that question.
Illustration Using an Indiana Case Farm
Average projected gross revenue and earnings for the 2014 to 2018 period are presented in table 1 for an Indiana case farm in west central Indiana (White County). Actual county yields were used for 2014 and 2015. Crop prices for the 2014/15, 2015/16, and 2016/17 crop years were estimated using the September 2016 WASDE report (USDA, 2016). Yields for 2016 were assumed to be 10 percent above trend yields. Base prices (medium price scenario in table 1) for corn and soybeans in 2016 were $3.20 and $9.05 per bushel, respectively. Trend yields were used to estimate 2017 and 2018 crop yields. The medium price forecasts for the 2017 and 2018 crop years were obtained from FAPRI; these prices are $3.57 and $3.80 for corn, and $9.44 and $9.64 for soybeans, respectively. The low price scenario and the high price scenario assumed that corn (soybean) price was $0.25 ($0.60) lower and higher, respectively, from 2016/17 to 2018/19, than the medium price forecasts. Purdue crop budgets for average productivity soil (Dobbins et al., 2016) and cash rent estimates reported in the latest Purdue cash rent and land value survey (Dobbins and Cook, 2016) were used to estimate production costs for 2014, 2015, and 2016. With the exception of cash rents, the other production costs were assumed to remain constant in 2017 and 2018. Cash rent per acre was assumed to decline 5 percent in 2017 and an additional 5 percent in 2018.
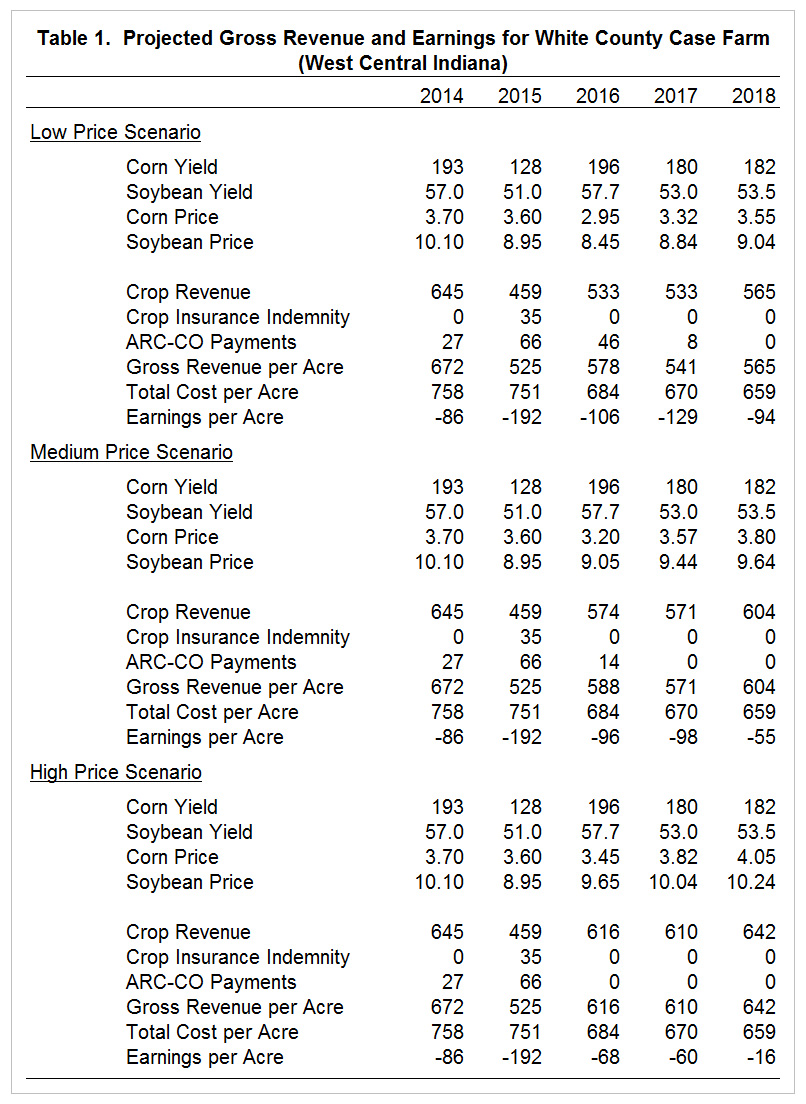
Table 1. Projected Gross Revenue and Earnings for White County Case Farm (West Central Indiana)
Crop insurance indemnity payments and ARC-CO program payments in table 1 were computed using the price and yield estimates described above. The crop revenue, crop insurance indemnity, ARC-CO payment, gross revenue, total cost, and earnings per acre figures presented in table 1 assume a corn/soybean rotation. The corn yield in 2015 was low enough to trigger a crop insurance indemnity payment. Estimated earnings in 2014 and 2015 for the corn/soybean rotation were -$86 and -$192 per acre, respectively. For 2016, projected ARC-CO payments for the different price scenarios presented in table 1 range from $0 to $46 per acre, and earnings per acre from -$106 to -$68 per acre. ARC-CO payments in 2017 are expected to be relatively small. ARC-CO payments are not expected in 2018 for any of the price scenarios reported in table 1. Estimated earnings per acre for the different price scenarios in table 1 range from -$60 to -$129 for 2017 and from -$16 to -$94 for 2018.
Sensitivity of ARC-CO Program Payments to Prices and Yields
Table 2 examines the sensitivity of earnings and ARC-CO payments per acre for different price and yield scenarios for 2016. The corn and soybean yields in table 1 (i.e., 10 percent higher yields) and the medium price scenario in table 1 were used for the base yield and base price combination in table 2. It is also important to note that table 2 excludes crop insurance premiums and indemnity payments. Five yield and five price scenarios or 25 price/yield combinations are illustrated in table 2. Figure 1 illustrates the sensitivity of ARC-CO payments to changes in price and yield. The maximum ARC-CO payments for corn and soybeans in 2016 are $65 and $51, respectively. Maximum program payments, or the cap, occur for all of the yield scenarios under the 20 percent lower price scenario, and for the two lowest yield scenarios under the 10 percent lower price scenario. Conversely, the ARC-CO payments would be zero for the highest yield scenario under the base price scenario; for the two highest yield scenarios under the 10 percent higher price scenario; and for all of the yield scenarios under the 20 percent higher price scenario. Earnings per acre in table 2 range from -$192 per acre for the lowest price and lowest yield combination to $80 per acre for the highest price and highest yield combination.
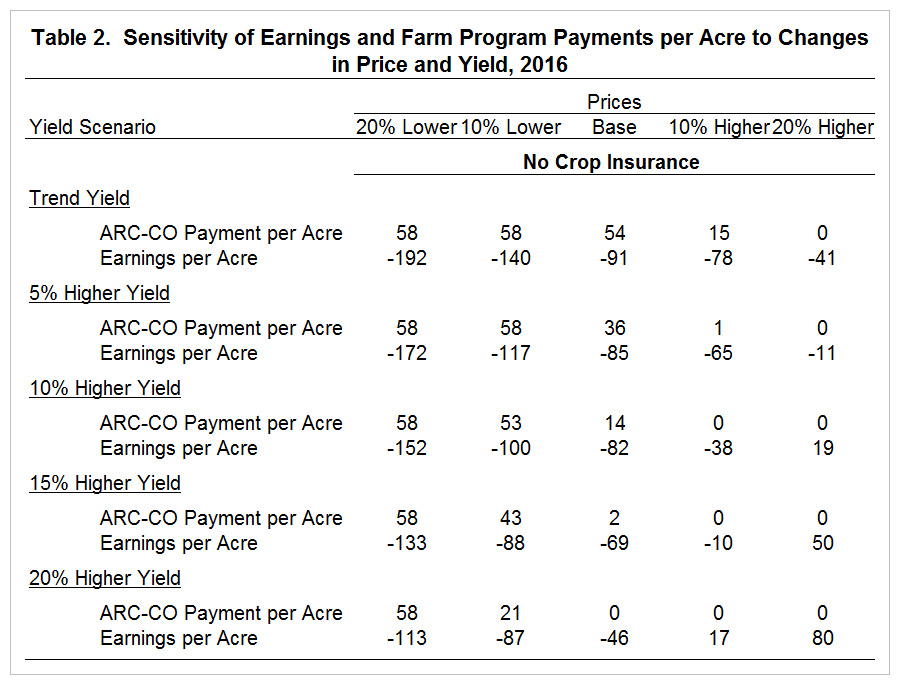
Table 2. Sensitivity of Earnings and Farm Program Payments per Acre to Changes in Price and Yield, 2016
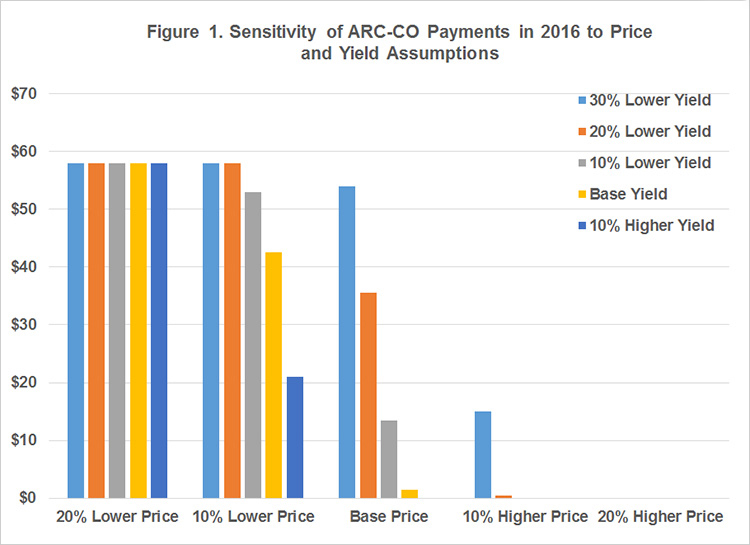
Figure 1. Sensitivity of ARC-CO Payments in 2016 to Price and Yield Assumptions
To gauge the interaction between ARC-CO payments and market price increases in more detail, let’s examine the results in the first and second columns of table 2. The difference in earnings per acre when prices increase from 20 percent lower to 10 percent lower than the base depends on the yield scenario examined. This difference in earnings (ARC-CO payment) averages $46 per acre ($11 per acre), and ranges from $26 per acre ($37 per acre) for the 20 percent higher yield scenario to $52 per acre ($0 per acre) for the trend yield scenario. To understand what is going on here it is important to remember that the ARC-CO payments depend on national prices and county yields. For some yield scenarios, the increase in gross revenue and margins resulting from a price increase is partially muted by a decline in the ARC-CO payments. As an example, for the 20 percent higher yield scenario, the ARC-CO payment declines from $58 for the 20 percent lower price scenario to $21 per acre under the 10 percent lower price scenario. In essence, the improvement in gross revenue and earnings from higher prices is partially offset by reduction in government payments, so the effect on earnings is partially muted. Specifically, because of the reduction in the ARC-CO payments, the resulting increase in earnings per acre resulting from the price increase is only one half as large as it was under the trend yield scenario.
Sensitivity of Farm Safety Net to Prices and Yields
Table 3 examines the sensitivity of the farm safety net (ARC-CO program payments plus crop insurance) in 2016 to changes in price and yield. As in table 2, there are 25 price/yield combinations. An 80 percent revenue protection coverage level is used for the illustrations in table 3. The farm safety net per acre in table 3 is computed by adding the ARC-CO payment to the crop insurance indemnity. Earnings per acre for each combination are illustrated in figure 2. Due to the strong yields expected in 2016, expected crop insurance indemnity payments are relatively small. Indemnity payments are received for all of the yield scenarios under the 20 percent lower price scenario and for the two lowest yield scenarios under the 10 percent lower price scenario. Though ARC-CO and crop insurance was very helpful for several combinations of prices and yields, earnings per acre are still below a negative $150 per acre for 2 of the 25 price/yield combinations and below a negative $100 per acre for 11 of the 25 price/yield combinations in table 3. For the price/yield combinations for which a crop insurance indemnity payments were made, earnings per acre ranged from -$125 per acre to -$159 per acre. For these same combinations in table 2 (which excluded crop insurance premiums and indemnity payments), earnings per acre ranged from -$113 per acre to -$192 per acre. There were only 4 price/yield combinations in table 3 with a positive projected earnings per acre.
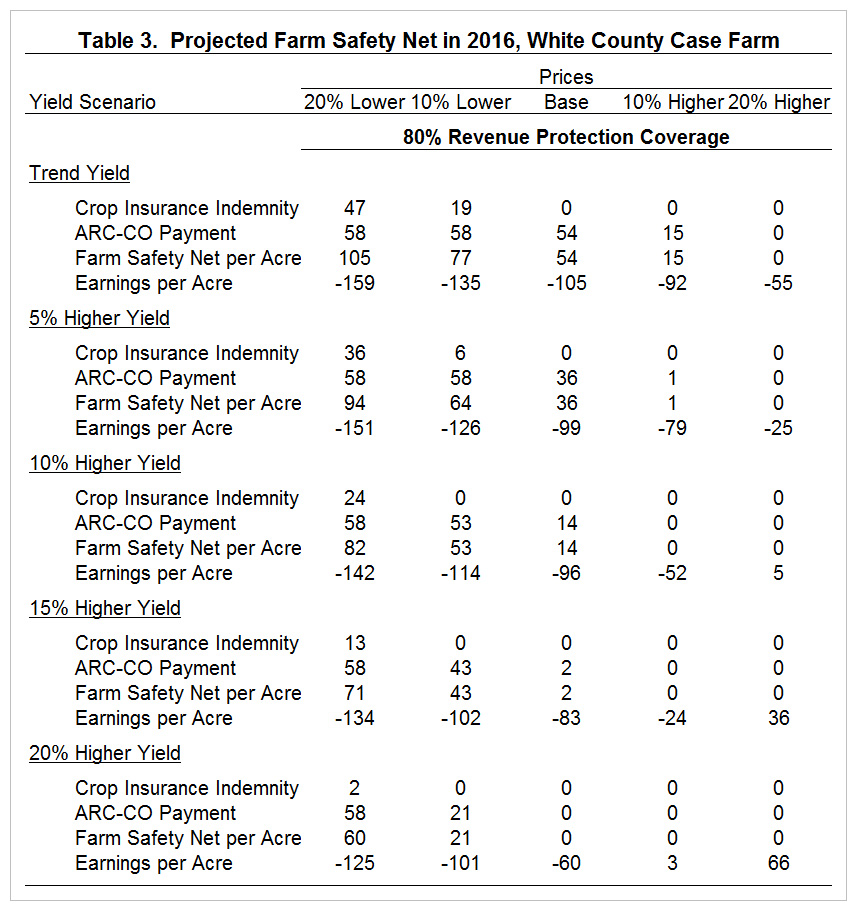
Table 3. Projected Farm Safety Net in 2016, White County Case Farm
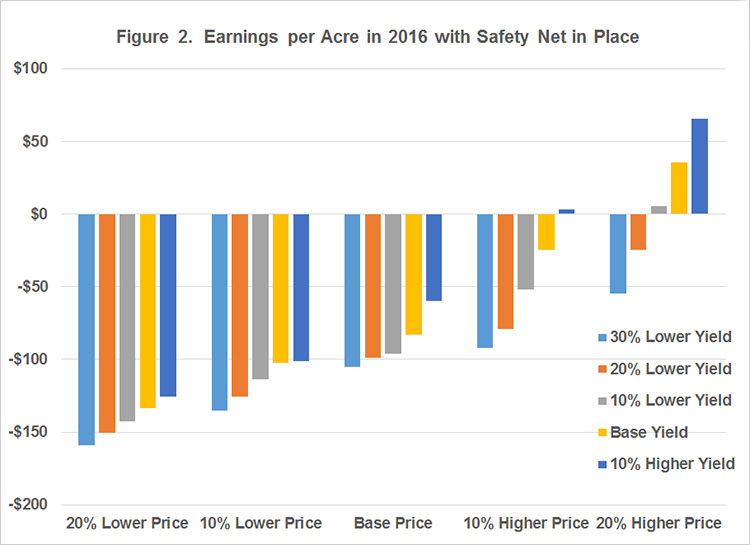
Figure 2. Earnings per Acre in 2016 with Safety Net in Place
Summary and Conclusions
This article examined earnings per acre projections for a case farm in west central Indiana. Under the price and yield combinations or scenarios examined in this paper, annual projected earnings per acre were negative from 2014 to 2018 for the case farm. The results also illustrated the gaping holes in the farm safety net. The safety net for 2016 was of particular interest in this article. The strong expected yields this fall have improved the outlook for earnings in 2016 from previous estimates. However, expected earnings are still relatively low. Even with ARC-CO payments and crop insurance indemnity payments, 44 percent of the 2016 price/yield combinations examined had negative earnings that exceeded $100 per acre. Using base corn and soybean prices of $3.20 and $9.05 per bushel, projected earnings for a corn/soybean rotation was a loss of $96 per acre, which is $30 higher than our April projection.
In summary, there are three issues related to the farm safety net we are currently facing. First, the ARC-CO payment caps limit mitigation of downside risk. Second, as crop prices increase, the ARC-CO payments often decline, resulting in a less effective safety net. Third, the decline in the crop insurance revenue guarantee since 2012 has contributed to the large decline in the case farm’s ability to mitigate downside risk. Further adjustment of the ARC-CO payments and crop insurance indemnities to expected future continued weak market conditions suggest that the farm safety net will likely be lowered further in 2017 and 2018.
References
Boehlje, M., and M. Langemeier. “The Farm Safety Net: The Good and Not So Good.” farmdoc daily (6):81, Department of Agricultural and Consumer Economics, University of Illinois at Urbana-Champaign, April 28, 2016.
Dobbins, C., and K. Cook. “Indiana Farmland Values and Cash Rents Continue Downward Adjustments.” Center for Commercial Agriculture, Purdue University, August 2016. https://ag.purdue.edu/commercialag/Pages/Resources/Farmland/Land-Prices/Indiana-Farmland-Values-and-Cash-Rents-Continue-Downward-Adjustments.aspx
Dobbins, C.L., M.R. Langemeier, R. Nielsen, T.J. Vim, S. Casteel, W. Johnson, and K. Wise. “2016 Purdue Crop Cost & Return Guide.” ID-166-W, March 2016. https://ag.purdue.edu/commercialag/Documents/Resources/Mangagement-Strategy/Crop-Economics/Crop%20Budget/2015_09_01_Langemeier_Purdue_Crop_Budgets.pdf
Food and Agricultural Policy Research Institute. “Baseline Update for U.S. Agricultural Markets.” FAPRI-MU Report #05-16, August 2016. https://www.fapri.missouri.edu/wp-content/uploads/2016/08/Report-05-16.pdf
USDA, Office of the Chief Economist. World Agricultural Supply and Demand Estimates. WASDE-557. Released September 12, 2016. http://usda.mannlib.cornell.edu/usda/waob/wasde/2010s/2016/wasde-09-12-2016.pdf
Zulauf, C., G. Schnitkey, J. Coppess, and N. Paulson. “Explaining ARC-CO Payments with Illustrations for the 2016 and 2017 Crops.” farmdoc daily (6):166, Department of Agricultural and Consumer Economics, University of Illinois at Urbana-Champaign, September 1, 2016.
![]()
![]()
![]()
![]()
![]()
TAGS:
TEAM LINKS:
RELATED RESOURCES
UPCOMING EVENTS
We are taking a short break, but please plan to join us at one of our future programs that is a little farther in the future.