June 5, 2020
Comparison of Conventional and Organic Crop Rotations
by Michael Langemeier and Xiaoyi Fang
![]()
![]()
![]()
![]()
![]()
Due to continued increases in demand for certified organic grains, crop farmers that have transitioned from conventional to certified organic grains report higher net returns per acre (McBride et al., 2015; Greene et al., 2017; Greene and Vilorio, 2018; Center for Farm Financial Management, 2020). Despite this, certified organic land accounts for less than 2 percent of U.S. farmland (U.S. Agricultural Census, 2017). Information pertaining to the relative profitability of conventional and organic production is often lacking. This article compares the long-run net returns to land of conventional corn/soybean and corn/soybean/wheat crop rotations to that of an organic corn/soybean/wheat rotation. Ten-year enterprise budgets for each crop rotation were developed so that we could capture the net returns of both the transition years and organic production years for the organic crop rotation.
**A corresponding spreadsheet tool used to compare conventional and organic rotations over a ten-year horizon can be found here.
Price, Yield, and Cost Comparisons
Certified organic grains tend to receive higher crop prices and have lower crop yields (McBride et al., 2015 and Center for Farm Financial Management, 2020). Using FINBIN data for the 2014 to 2018 period, organic corn and soybean prices were more than double the corresponding prices for their conventional counterparts. Organic wheat prices were approximately double the average winter wheat price. The crop yield drags for organic corn, organic soybeans, and organic wheat were approximately 32 percent, 33 percent, and 24 percent, respectively. Combining crop prices, crop yields, government payments, crop insurance indemnity payments, and miscellaneous revenue for both conventional and organic crops, gross revenue for the organic crops was higher, with the most significant difference associated with corn.
Organic crop production often involves higher manure, machinery, and labor costs, and lower fertilizer, herbicide, and insecticide costs. Using FINBIN data for the 2014 to 2018 period, total expenses for organic production in comparison to conventional production were slightly higher for corn, and from 30 to 40 percent higher for soybeans and wheat.
Enterprise Budget Summary
Enterprise budgets were developed for conventional, transition, and organic corn, soybeans, and wheat for a ten-year period. Conventional corn, soybean, and wheat enterprises were used to estimate net returns per acre for a corn/soybean and a corn/soybean/wheat rotation. Transition soybeans and wheat were used along with organic corn, soybeans, and wheat to estimate net returns per acre for an organic corn/soybean/wheat rotation. Soybeans and wheat were used as transition crops, and the transition was assumed to take place over time rather than just the first two years of the ten-year period. The organic crop rotation was set-up to ensure that the first organic crop would be corn, which has historically been the most profitable organic crop. More detail pertaining to the enterprise budgets can be found here.
Table 1 illustrates the crop prices that were used for year 1 and years 2 through 10. After being lower in the first year (i.e., 2020), crop prices were assumed to stabilize and reach a long-run equilibrium. The historical difference between conventional and organic prices was used to estimate the organic prices. Sensitivity analysis related to organic crop price assumptions can be found below. 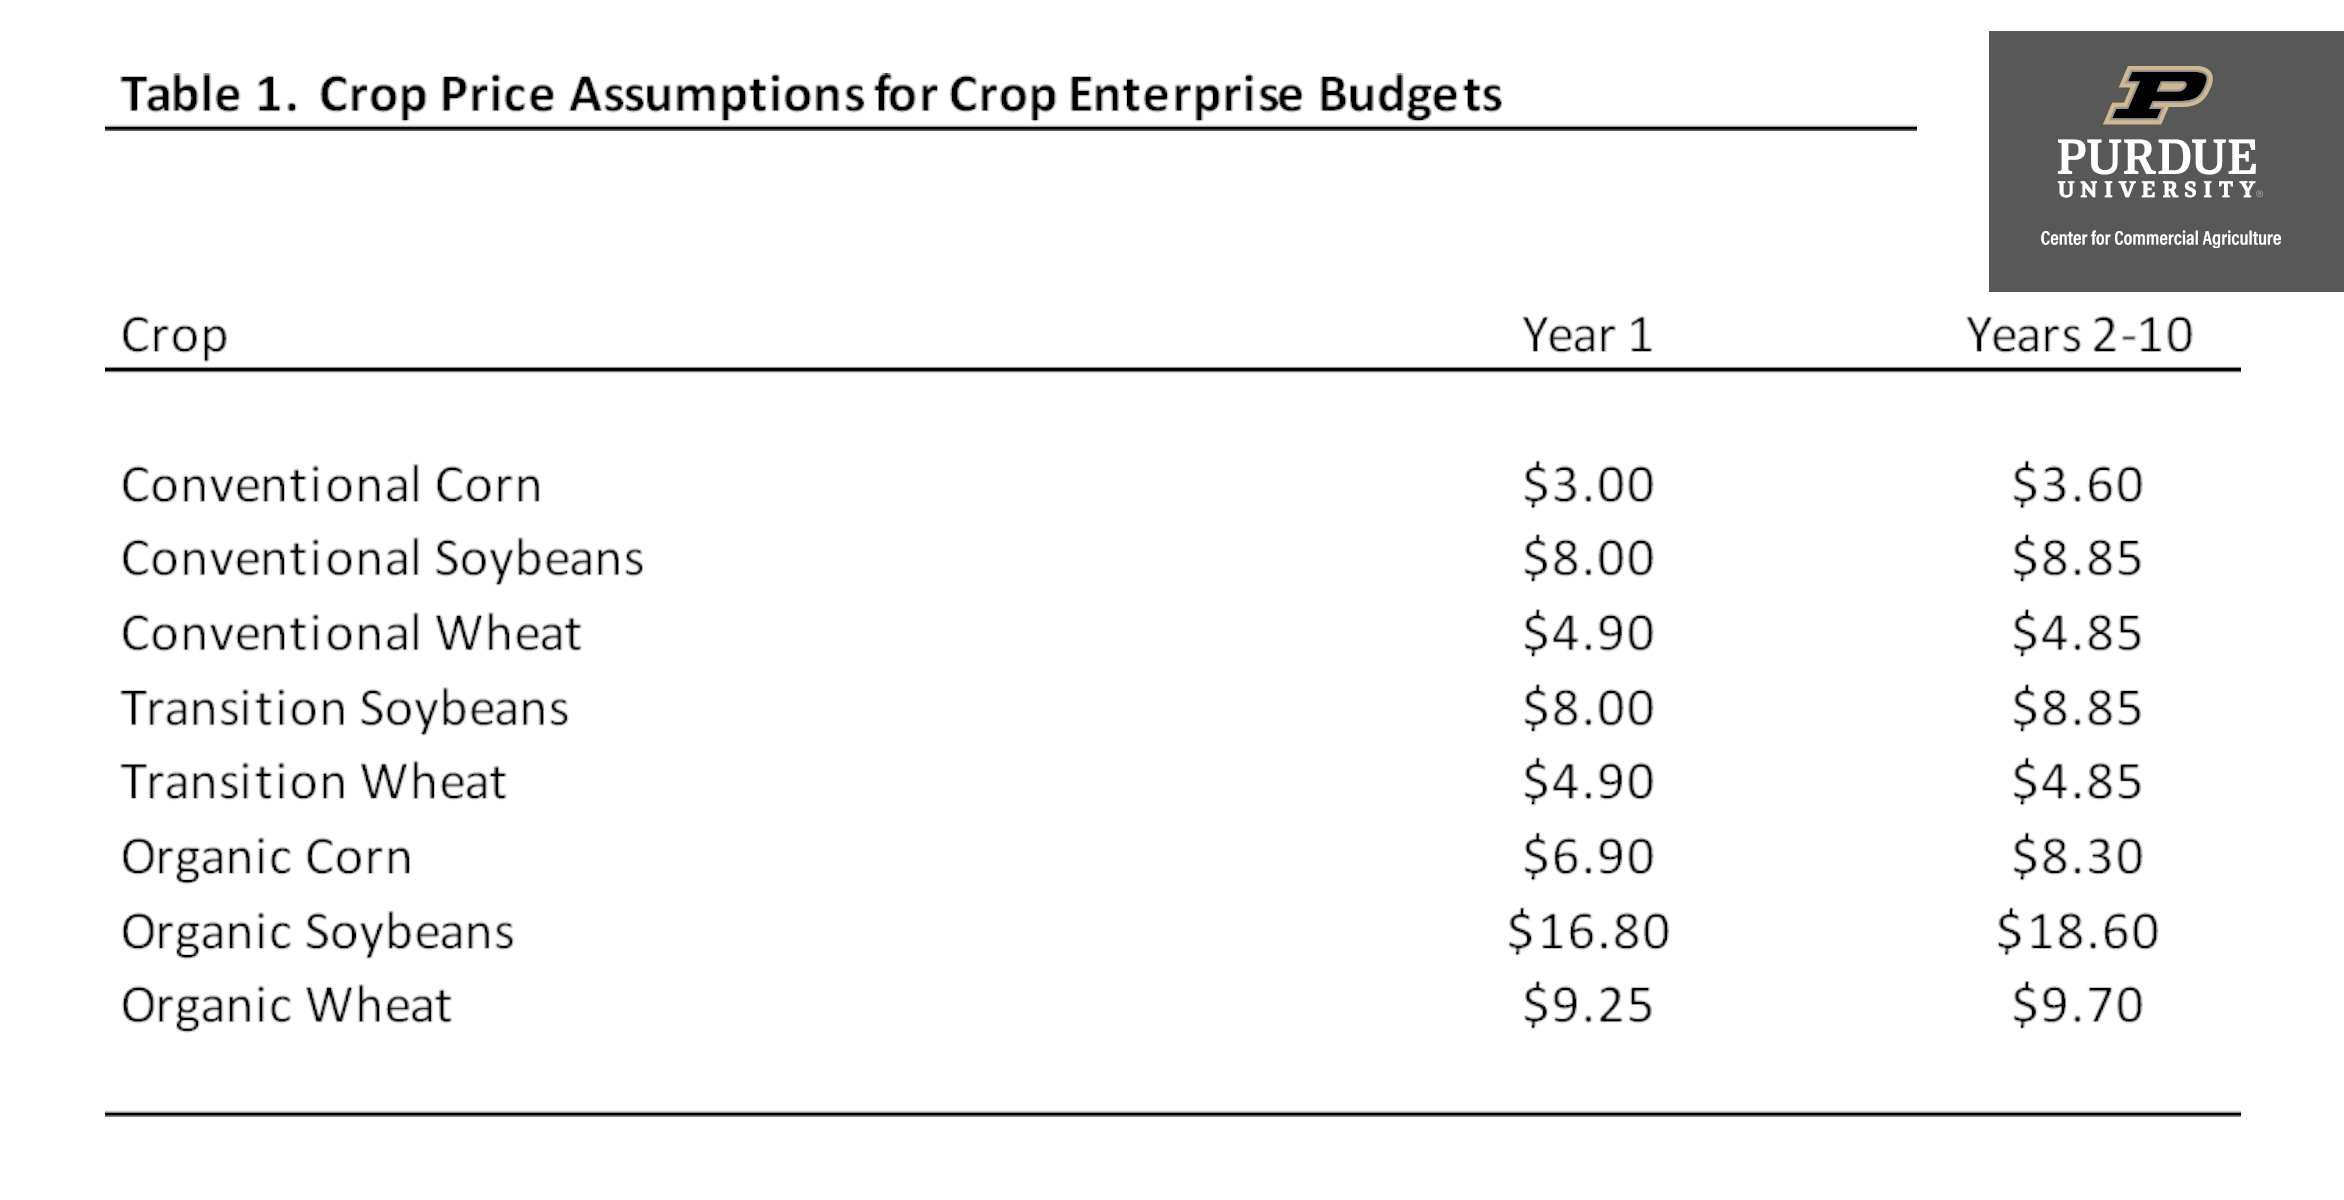
Average net returns per acre for conventional and organic crop rotations are presented in table 2. The contribution margin is computed by subtracting variable cost from gross revenue, which includes crop revenue, government payments, and crop insurance indemnity payments. Earnings are computed by subtracting variable and fixed costs from gross revenue. The gross revenue for the organic crop rotation was significantly higher than the gross revenue for a corn/soybean rotation and a corn/soybean/wheat rotation. Variable cost per acre was relatively lower for the organic crop rotation, but fixed costs were relatively higher. Essentially, the organic crop rotation substitutes manure and machinery costs for fertilizer, herbicide, and insecticide. Labor costs are higher for the organic crop rotation. The net return to land for the organic rotation was $268 per acre, or approximately $110 and $120 higher than that of the conventional corn/soybean and conventional corn/soybean/wheat rotations. 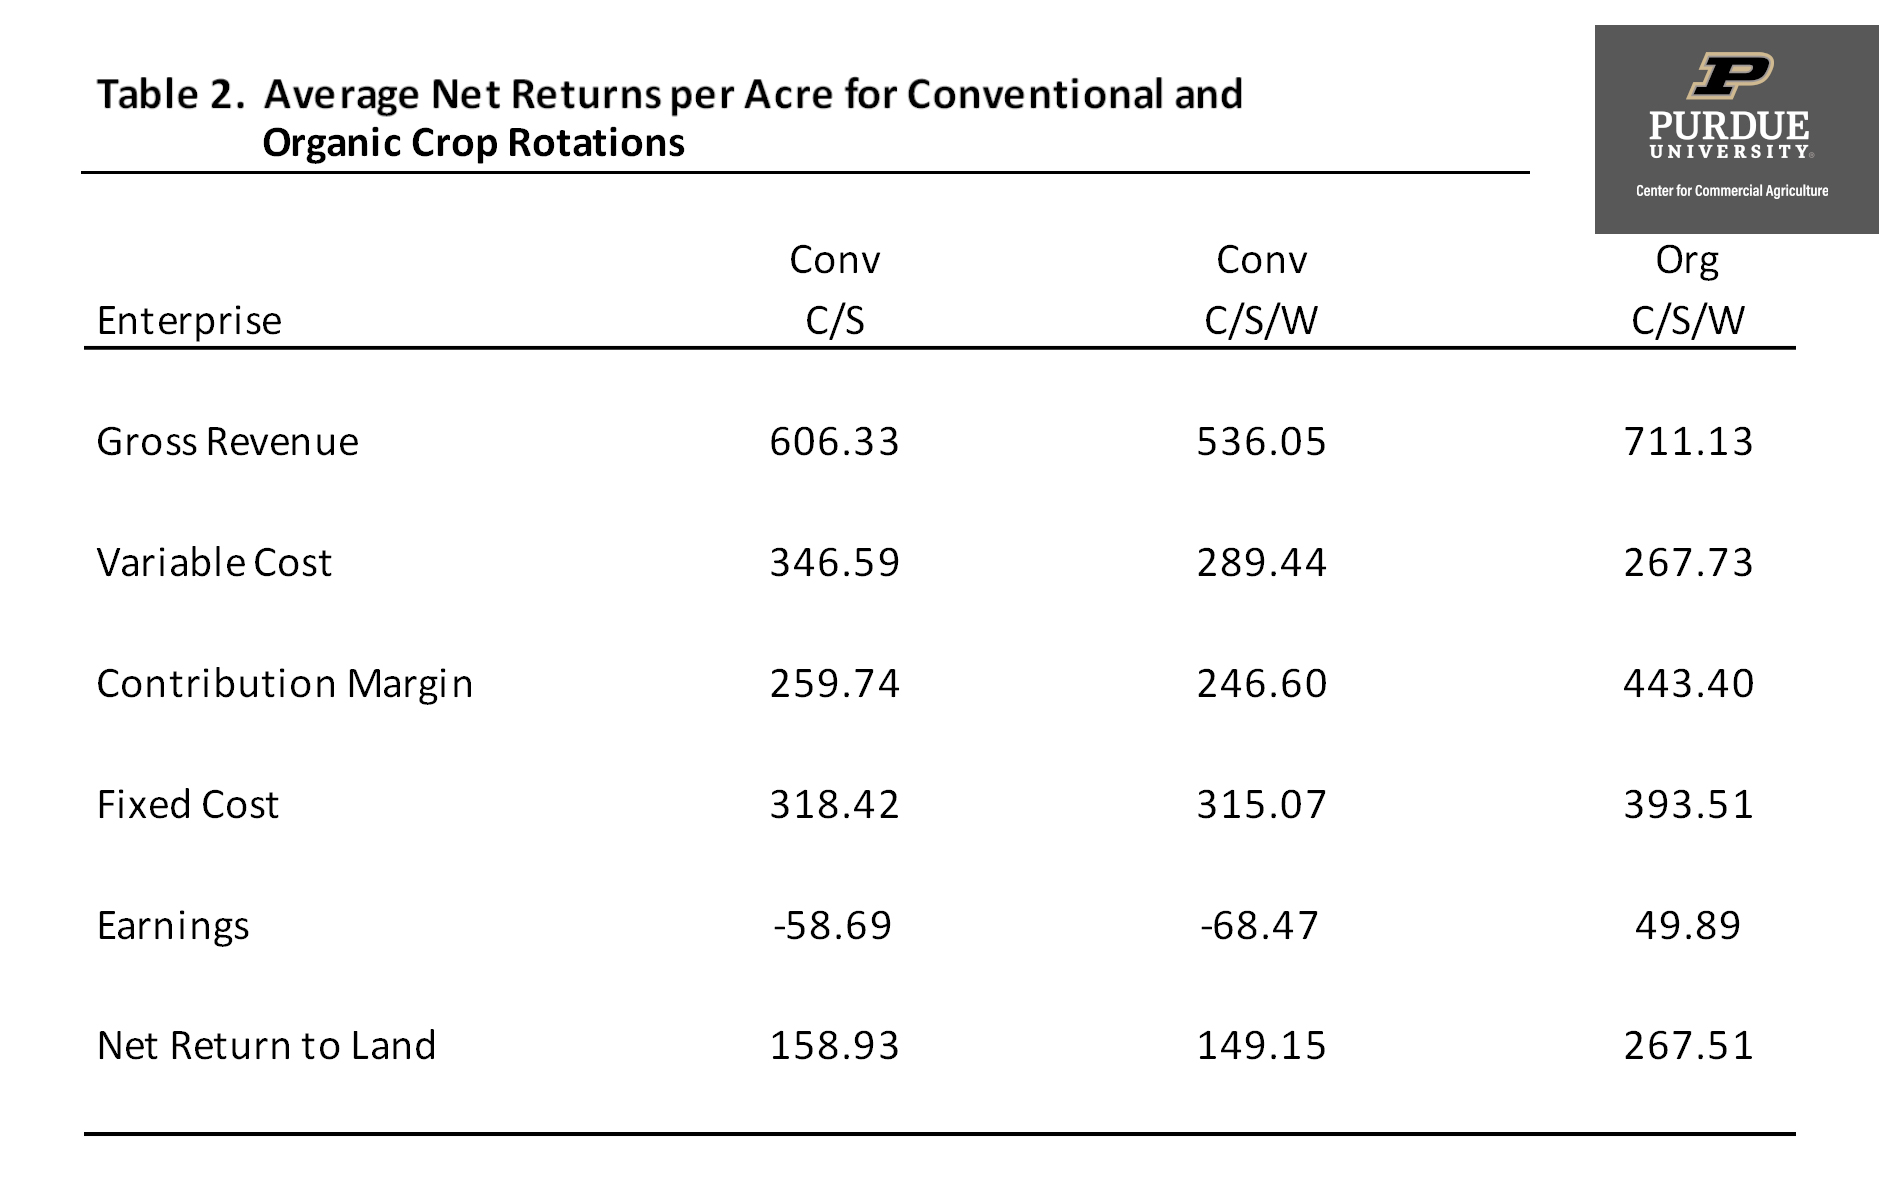
Sensitivity Analysis for Crop Prices and Yields
The average net returns per acre for the three crop rotations illustrated in table 2 are sensitive to changes in relative prices, relative yields, and relative costs. The analysis in this section examines breakeven organic crop prices and breakeven organic crop yields. Breakeven prices and yields were computed by comparing the net present value of net returns to land among the three crop rotations.
The first part of table 3 shows the organic crop prices used in table 2 for years 2 through 10, and what the prices would need to be for the net returns for the organic crop rotation to equal those of the conventional corn/soybean rotation. Holding crop yields and costs constant, organic crop prices would need to be reduced 17.8 percent for the average net return to land to equal that of the average net return for the conventional corn/soybean crop rotation. Though not shown in table 2, for the net return to land for the organic rotation to be equal to that of the conventional corn/soybean/wheat crop rotation, organic crop prices would need to be reduced 19.5 percent. 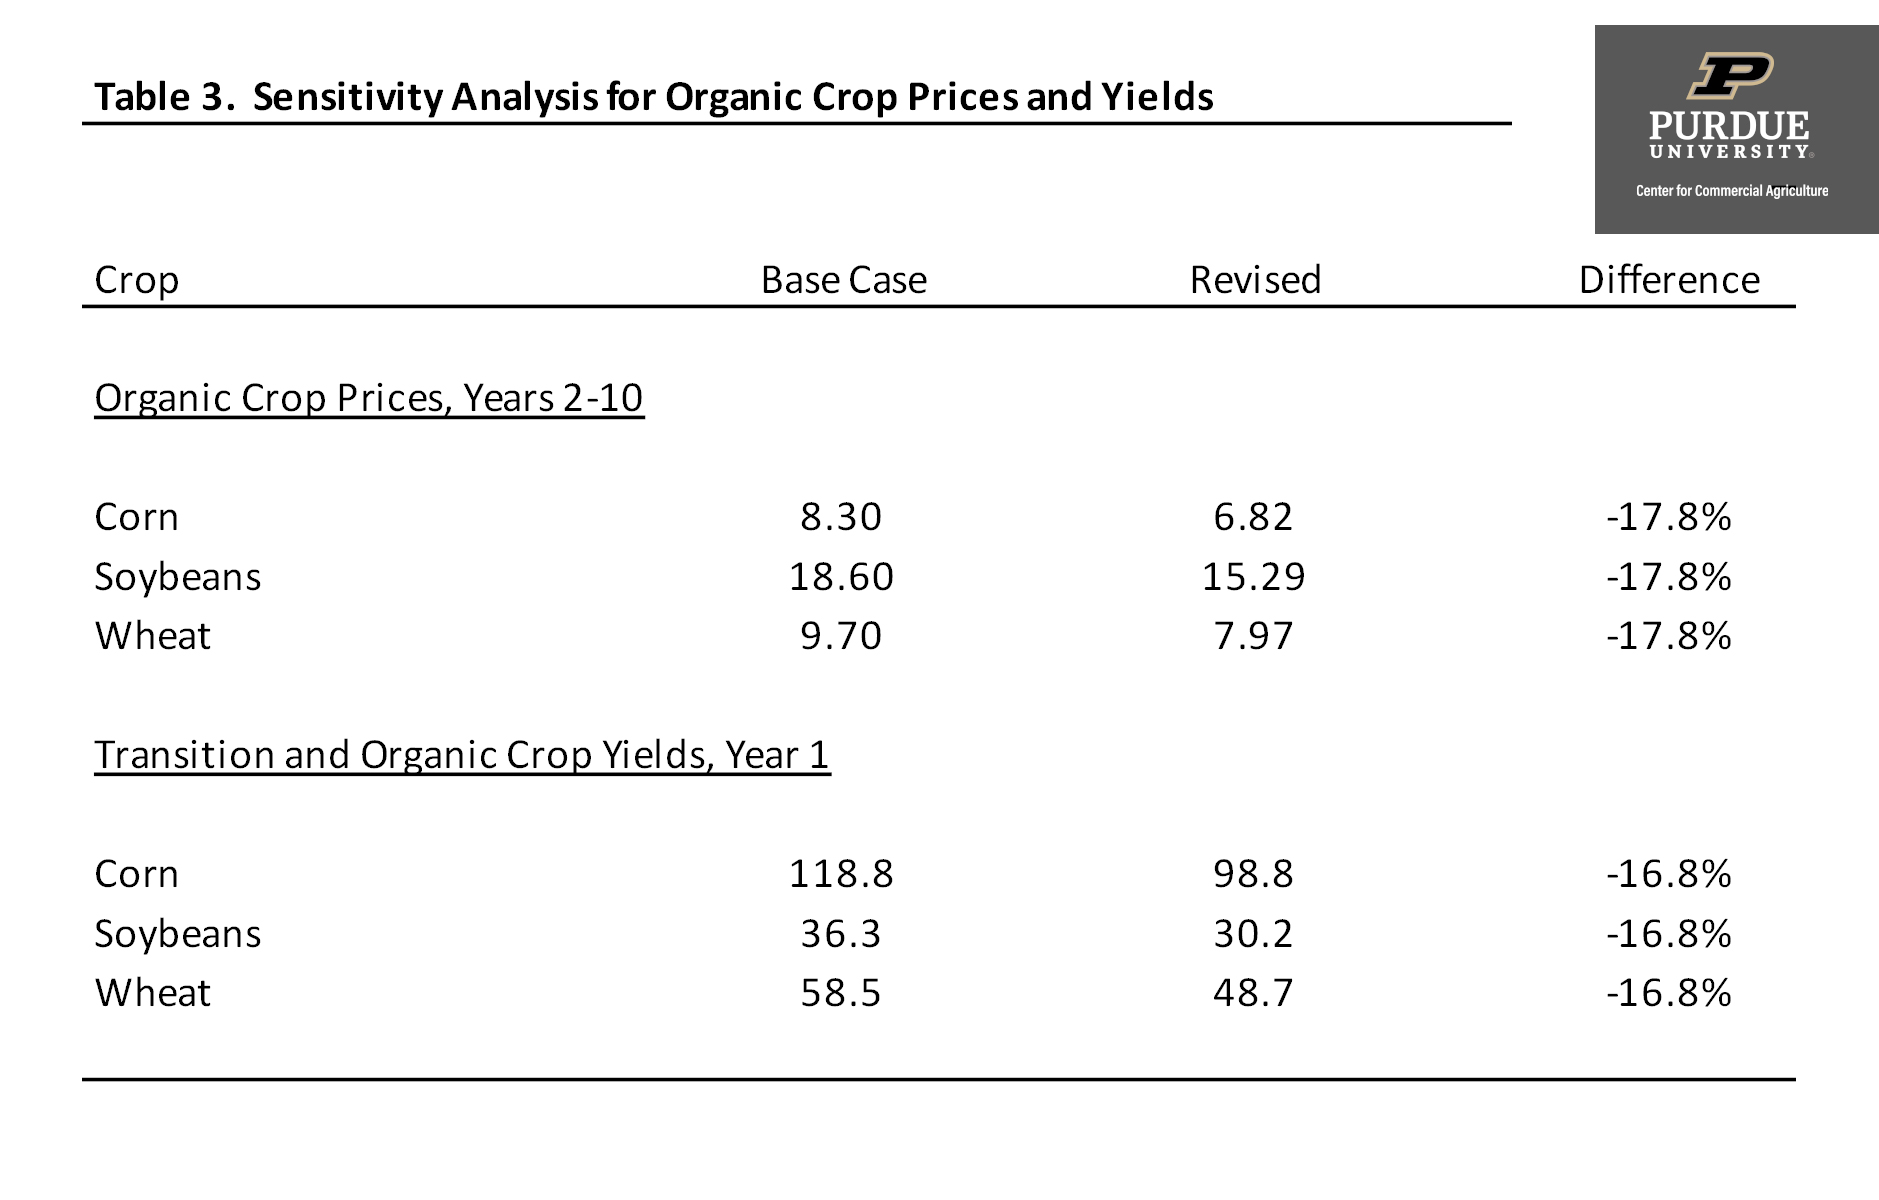
The second part of table 3 presents the transition and organic crop yields used for the base case as well as breakeven yields. The table only shows yields for the first year. Trend adjustments are made to project yields in Years 2 through 10, so any change in the projections for the first year will change yields for the entire ten-year period. Holding crop prices and costs constant, transition and organic crop yields would need to decrease 16.8 percent for the average net return to land for the organic crop rotation to equal that of the conventional corn/soybean crop rotation. To be equal to the net return to land for the conventional corn/soybean/wheat crop rotation, organic yields would need to be reduced by 18.4 percent.
Summary and Conclusions
This article compared the long-run net returns to land for conventional and organic crop rotations. An analysis of this sort requires a lot of assumptions. Producers considering transitioning a portion of their acres to certified organic crop production should carefully examine the sensitivity of net returns using alternative price, yield, and cost assumptions. It is also important to recognize that the crops grown, manure used, and tillage practices vary substantially among organic crop farms. Furthermore, the FINBIN data shows a much wider difference in enterprise net returns among organic crop farms than their conventional counterparts. This wider difference is likely due to the difficulty of managing an organic crop system, and the learning curve associated with growing organic crops.
References
Center for Farm Financial Management, University of Minnesota, FINBIN web site, accessed May 31, 2020.
Greene, C., G. Ferreira, A. Carlson, B. Cooke, and C. Hitaj. “Growing Organic Demand Provides High-Value Opportunities for Many Types of Producers.” USDA-ERS, Amber Waves, February 6, 2017.
Greene, C. and D. Vilorio. “Lower Conventional Corn Prices and Strong Demand for Organic Livestock Feed Spurred Increased U.S. Organic Corn Production in 2016.” USDA-ERS, Amber Waves, June 4, 2018.
McBride, W.D., C. Greene, L. Foreman, and M. Ali. “The Profit Potential of Certified Organic Field Crop Production.” USDA-ERS, Economic Research Report Number 188, July 2015.
![]()
![]()
![]()
![]()
![]()
TAGS:
TEAM LINKS:

RELATED RESOURCES
UPCOMING EVENTS
We are taking a short break, but please plan to join us at one of our future programs that is a little farther in the future.