November 2, 2020
Differences in Working Capital among Farms
By Michael Langemeier and Allen Featherstone
![]()
![]()
![]()
![]()
![]()
A recent article by Langemeier and Featherstone (2020) examined the trends in liquidity for a sample of Kansas farms. Liquidity, measured using the current ratio, has declined substantially since its peak in 2013. The percentage of farms with a current ratio below 1.0 and 2.0 was 7.9% and 37.6% in 2019. Obviously, liquidity varies substantially among farms. This article examines differences in the characteristics for farms with a current ratio above and below 2.0. In addition, we examine the correlation between the current ratio and farm characteristics.
A sample of Kansas Farm Management Association (KFMA) farms with continuous data from 2000 to 2019 are used in our analysis. There were 178 KFMA farms with continuous data for the 20-year period. Farm types represented in this sample of farms include crop farms, crop/beef farms, and beef farms.
Estimating and Analyzing Liquidity
Commonly used liquidity measures include working capital to value of farm production, working capital per acre, and the current ratio. Working capital is measured by subtracting current liabilities from current assets. Current assets include cash, accounts receivable, supply inventories, crop inventories, and market livestock inventories. Current liabilities include accounts payable, operating lines of credit, and the portion of non-current loans due within the next year. The current ratio is computed by dividing current assets by current liabilities. The working capital to value of farm production measure can also be computed using gross income, gross revenue, or total expenses. Value of farm production is considered a more appropriate measure of gross income when the sample of farms includes both crop and livestock farms. This article uses the current ratio to measure liquidity.
Liquidity thresholds are typically used by analysts to determine whether a farm has an adequate liquidity position. A current ratio above 2.0 is considered adequate. A farm with a current ratio below 1.0 is not able to cover their current liabilities by selling all of their current assets, and therefore may have trouble repaying loans. In this study, we use 1.0 and 2.0 as current ratio thresholds.
Trends in Liquidity Measures
Trends in the average current ratio for the sample of KFMA farms are depicted in Figure 1. The average current ratio during the 20-year period was 2.83. The current ratio was above the average ratio from 2009 to 2015. The current ratio peaked in 2013 at 4.04, and dropped to 2.60 in 2019. Though relatively lower in 2019 compared to its peak value, the current ratio in 2019 was still higher than the averages experienced prior to 2008.
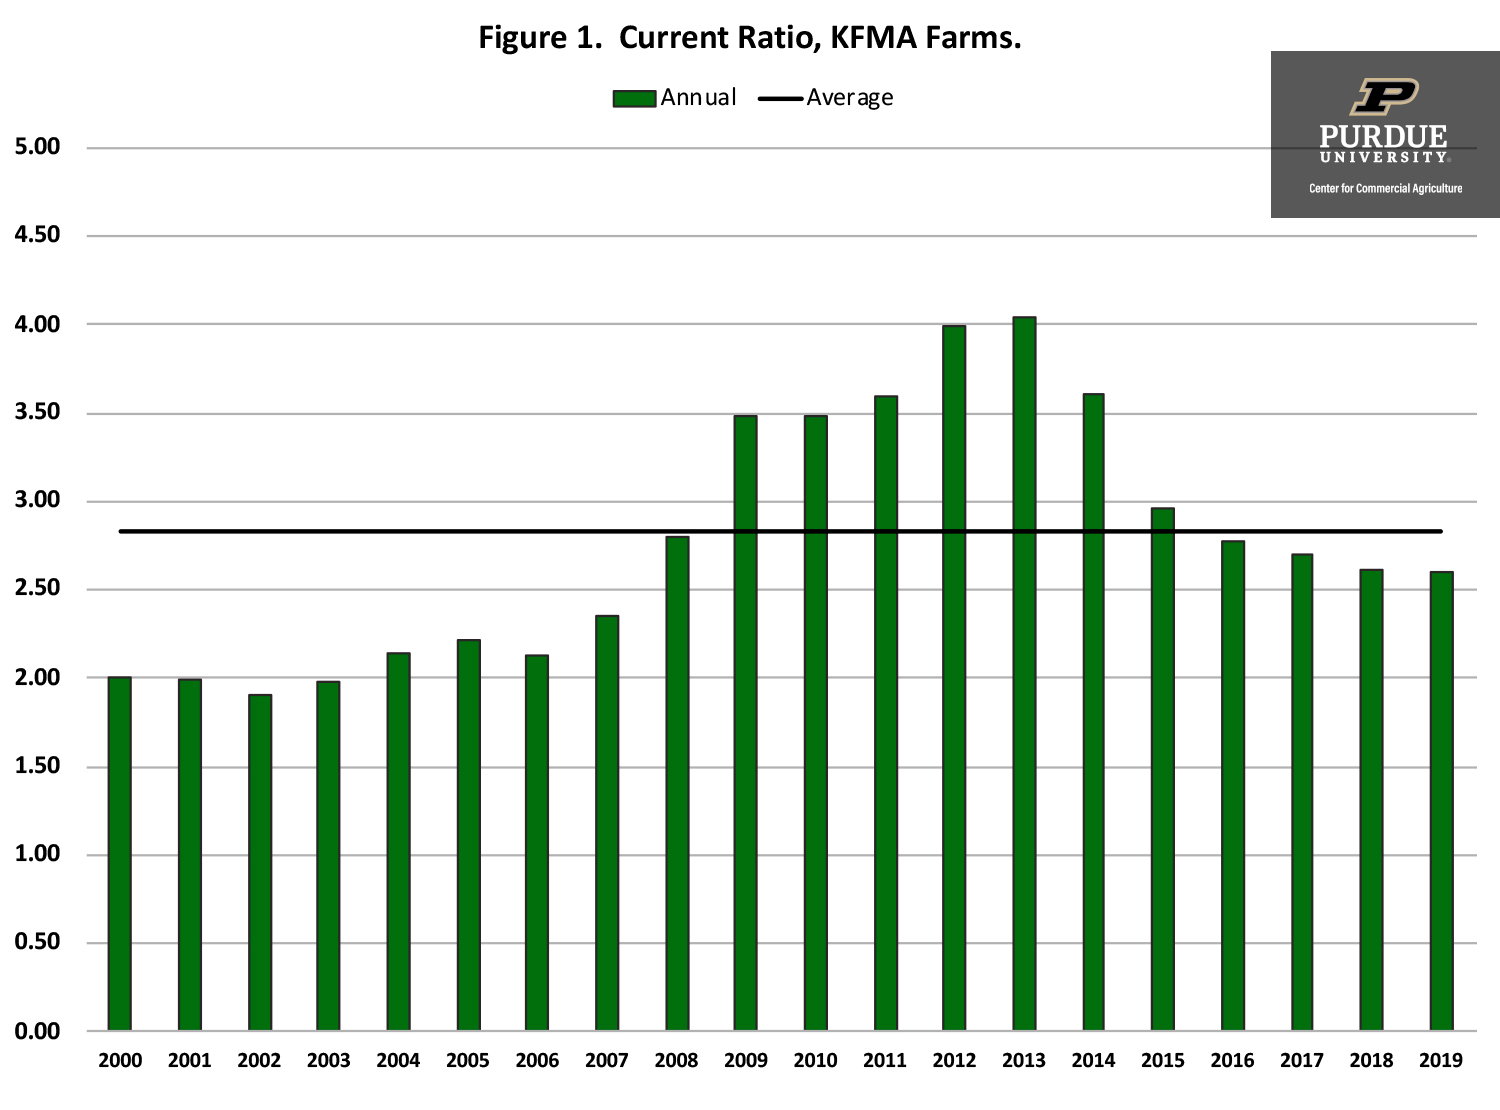
Figure 1. Current Ratio, KFMA Farms.
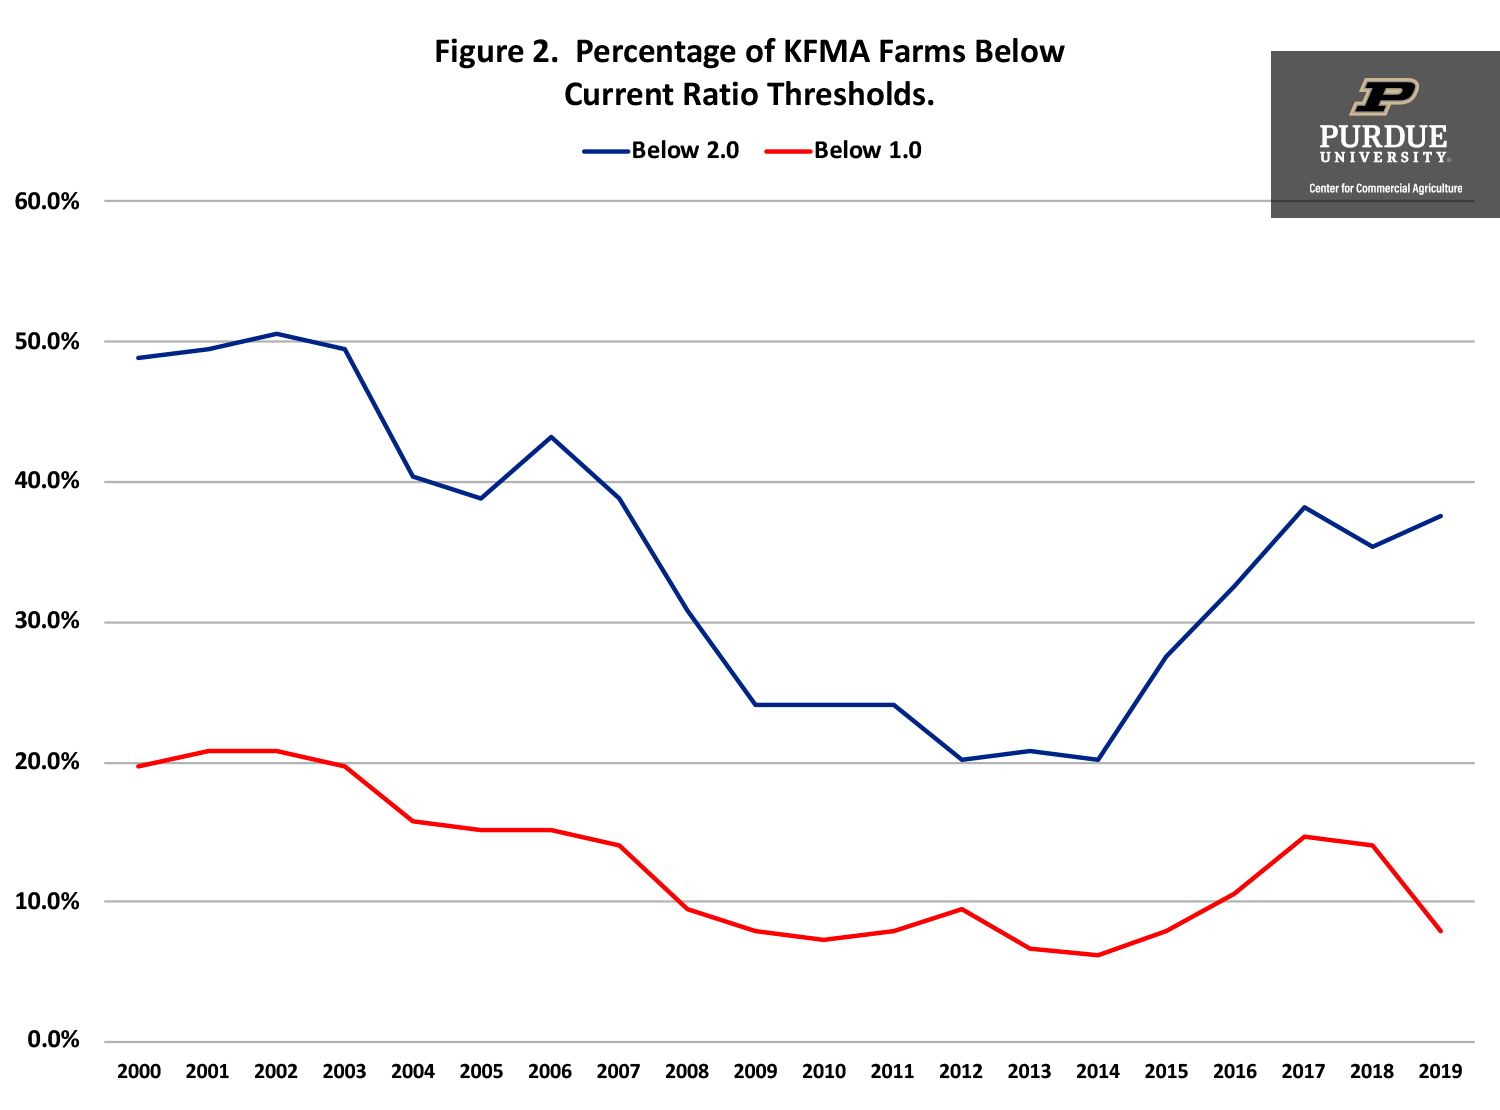
Figure 2. Percentage of KFMA Farms Below Current Ratio Thresholds.
The two thresholds examined for the current ratio were 1.0 and 2.0. The trends in these two thresholds are illustrated in Figure 2. On average, over the 20-year period, the percentages of farms with a current ratio below 1.0 and 2.0 were 12.6% and 34.8%, respectively. Farms with a current ratio below 1.0 are in a difficult situation. To repay debt, these farms would need to increase value of farm production, reduce expenses, refinance intermediate or long-term debt, sell intermediate or long-term assets, or infuse capital from off-the-farm to ensure that the current debt obligations are repaid. The percentage of farms with ratios below 1.0 and 2.0 were above average from 2000 to 2007 and below average from 2008 to 2016. The percentage of farms with a ratio below 1.0 increased dramatically in 2017 and 2018, but declined in 2019. The percentage of farms with a ratio below 2.0 was above the 20-year average in 2017, 2018, and 2019.
Characteristics of Farms with Low and High Current Ratios
Table 1 illustrates farm characteristics for farms with an average current ratio above and below 2.0 during the sample period. The first two columns of table 1 contain the averages for the two current ratio categories. The third column (p-value) indicates whether the averages between the two groups of farms are significantly different from zero. A p-value below 0.05 would indicate that the values are significantly different at the 5 percent level.
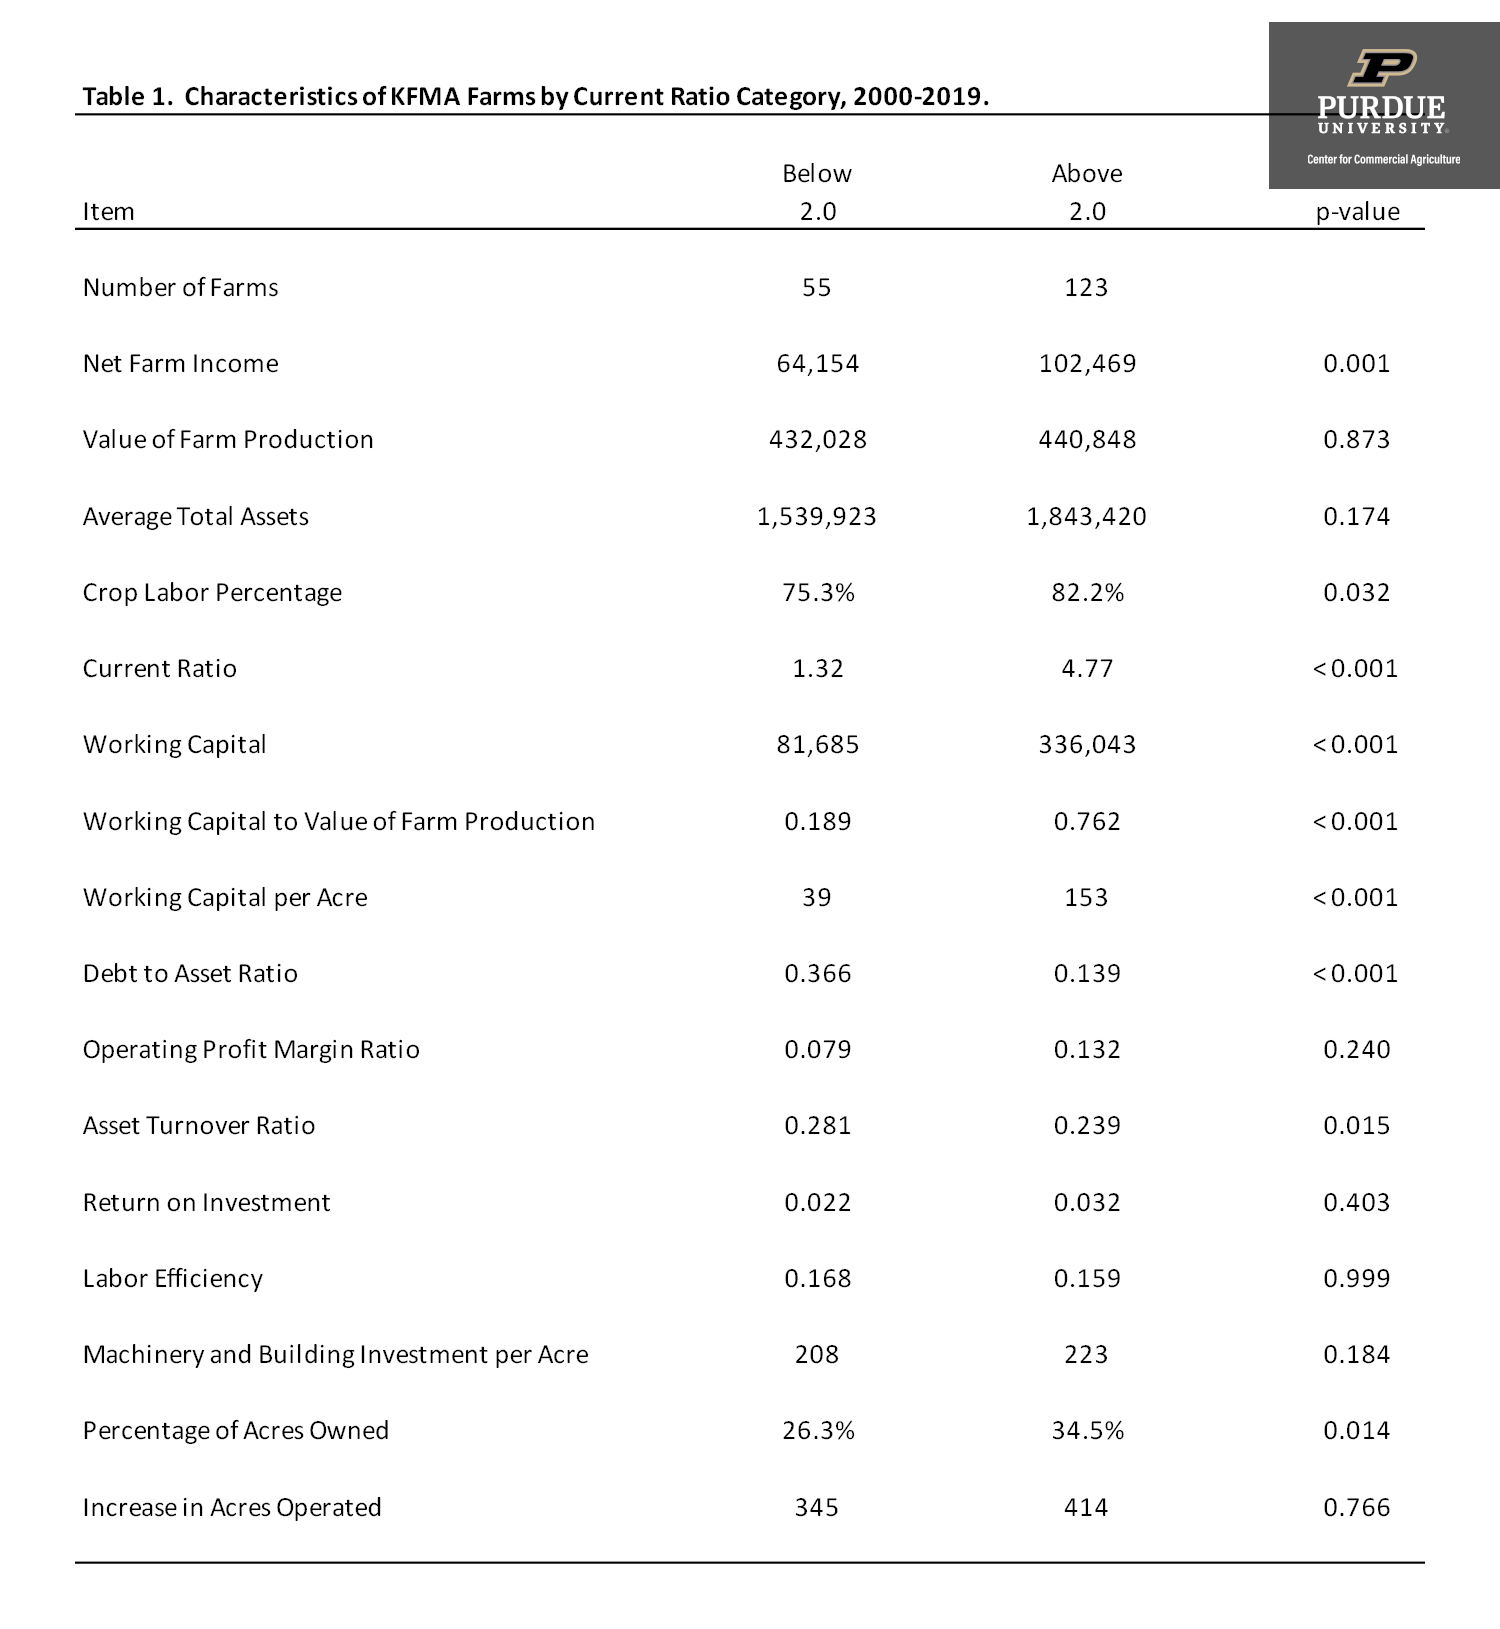
Table 1. Characteristics of KFMA Farms by Current Ratio Category, 2000-2019.
As expected, all of the working capital variables were significantly different between the two groups of farms. The current ratio for the group with an average current ratio above 2.0 was 4.77. In contrast, the average current ratio for the group of farms with an average current ratio below 2.0 was only 1.32. The average working capital to value of farm production was 0.189 for the low average current ratio group and 0.762 for the high average current ratio group.
The debt to asset ratio for the low average current ratio group was significantly higher. So, in addition to having more liquidity, the high average current ratio group has lower leverage. Farm size, measured using value of farm production and average total assets, was not significantly different between the two groups of farms. The high current ratio group tended to devote more of their labor to crop production, indicating that farms with more livestock were more liquidity constrained during the sample period.
The asset turnover ratio was higher for the low average current ratio group. This result was likely due to the lower land ownership percentage for this group. Unlike the asset turnover ratio, the profit margin and the return on investment were not significantly different between the two groups of farms.
To more fully explore the relationship between the current ratio and farm characteristics, the correlation coefficients between the inverted current ratio and farm characteristics are presented in table 2. The inverted current ratio is used rather than the current ratio due to the fact that it is not possible to compute the current ratio for farms with no current liabilities. By flipping the sign in table 2, we can analyze the relationship between the current ratio and farm characteristics. The first column in table 2 represents the correlation coefficient between the current ratio and the farm characteristic in question. The second column indicates whether the correlation coefficient is significantly different from zero (i.e., less than 0.05).
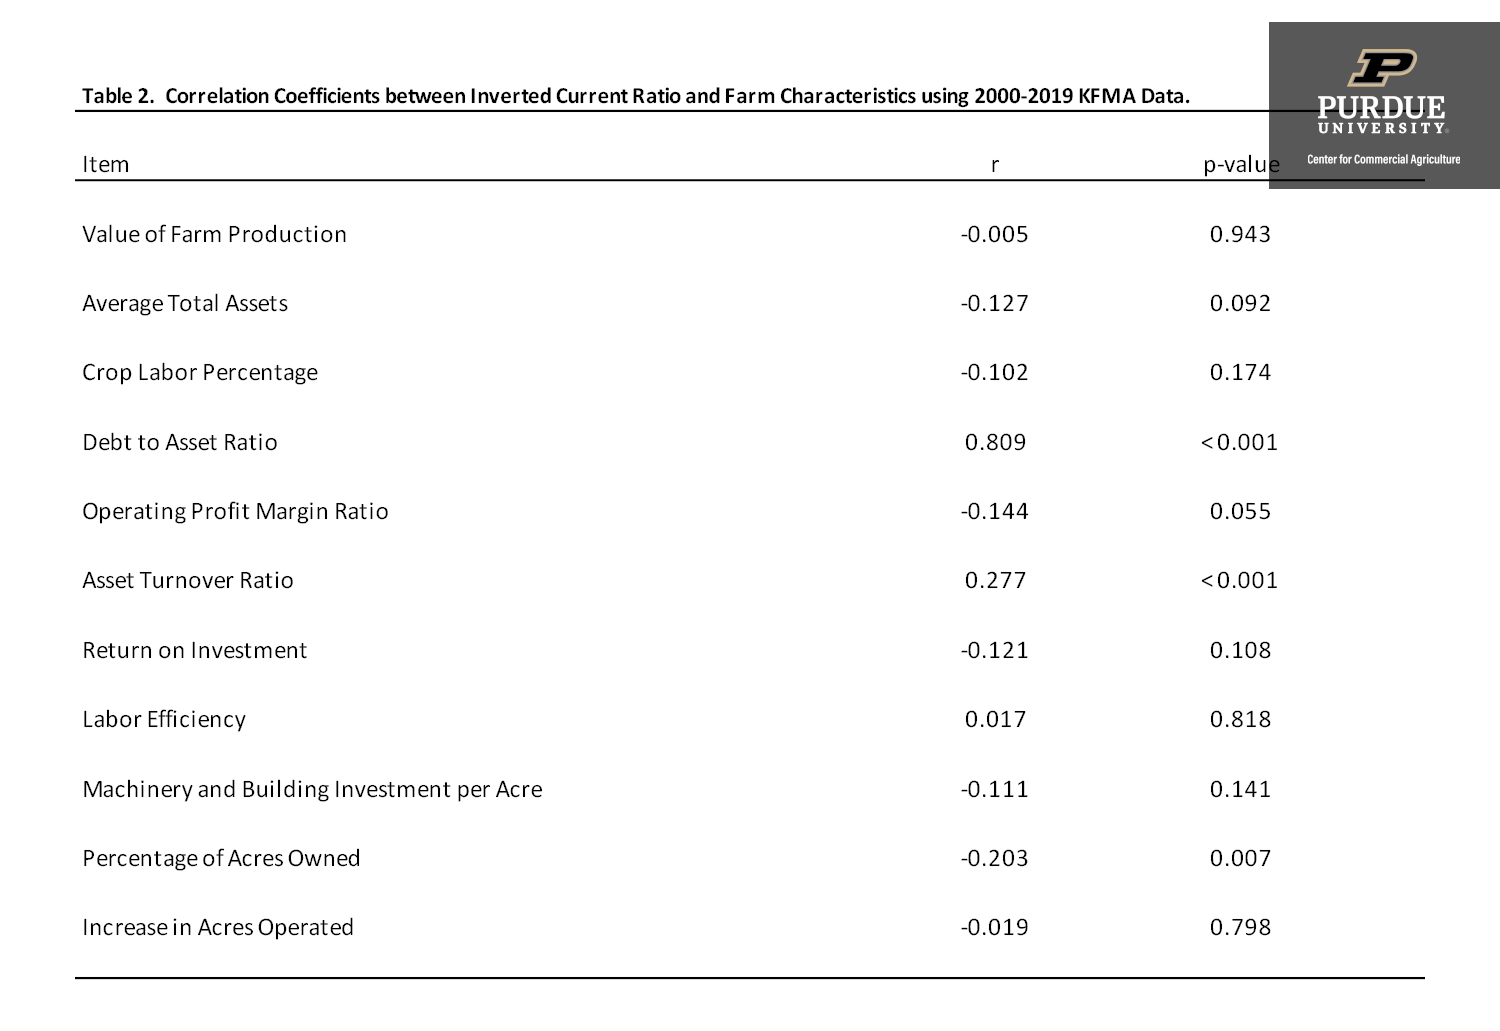
Table 2. Correlation Coefficients between Inverted Current Ratio and Farm Characteristics using 2000-2019 KFMA Data.
The debt to asset ratio and the asset turnover ratio were significant and negatively correlated with the current ratio, while the percentage of acres owned was significant and positively correlated with the current ratio. Farm size and type, as well as farm growth, measured using the increase in acres operated over the sample period, were not significantly correlated with the current ratio.
Concluding Comments
This article examined trends in liquidity for a sample of KFMA farms. Liquidity, measured using the current ratio, has declined substantially since its peak in 2013. The percentage of farms with a current ratio below 1.0 and 2.0 was 7.9% and 37.6% in 2019. In contrast, these percentages were only 6.2% and 20.2% in 2014. This suggests that farms are finding it increasingly difficult to repay loans in a timely fashion.
We documented the large difference in current ratios among farms, and examined the relationship between current ratios and farm characteristics. Farms with higher average current ratios during the sample period had a lower debt ratio, a lower asset turnover ratio, and owned a higher percentage of their acres operated. It is important to note that farm size and financial performance, measured using the operating profit margin and the return on investment, were not significantly related to the average current ratio for the sample of farms.
Citations
Langemeier, M. and A. Featherstone. “Examining Trends in Liquidity for a Sample of Kansas Farms.” Center for Commercial Agriculture, Purdue University, October 2020.
![]()
![]()
![]()
![]()
![]()
TAGS:
TEAM LINKS:


RELATED RESOURCES
UPCOMING EVENTS
We are taking a short break, but please plan to join us at one of our future programs that is a little farther in the future.