September 1, 2021
Comparisons of Net Returns for Crop Share Leases and a Fixed Cash Rent Lease
by Michael Langemeier
![]()
![]()
![]()
![]()
![]()
A recent article used a case farm in west central Indiana to illustrate net returns to land derived from crop share, fixed cash rent, and flexible cash lease arrangements. This article updates net return projections for 2021, and compares the net returns of two crop share leasing arrangements with a fixed cash rent leasing arrangement.
Crop Share and Fixed Cash Rent Lease Arrangements
Net return to land from 1996 to 2021 from a landowner perspective were computed for a case farm in west central Indiana. The case farm had 3000 crop acres and utilized a corn/soybean rotation. The case farm participated in the ARC-CO program and purchased 80 percent revenue protection coverage. The three leasing arrangements compared in this article are briefly discussed below.
With the first crop share leasing arrangement the landlord receives one-third of all revenue (crop revenue, government payments, and crop insurance indemnity payments). Where this crop arrangement differs from most crop share arrangements is the splitting of costs. Under this arrangement, the landlord does not split or share any of the non-land costs.
The landlord receives 50 percent of all revenue (crop revenue, government payments, and crop insurance indemnity payments) with the second crop share leasing arrangement. In addition to providing the land, the landowner pays 50 percent of seed, fertilizer, and chemical (herbicides, insecticides, and fungicides) expenses as well as 50 percent of crop insurance premiums.
A fixed cash rent lease is compared to the two crop share leasing arrangements. Fixed cash rents are obtained from the annual Purdue Farmland Value survey. Specifically, cash rents for average productivity land in west central Indiana is used.
Net Return Comparisons
Pairwise comparisons were used to compare the three leasing arrangements. Figure 1 compares the one-third crop share leasing arrangement to the fixed cash rent lease. The landowner net return for the crop share lease was more variable. As would be expected, net return for the crop share lease increased faster when gross revenue was increasing, but also decreased more rapidly when gross revenue was declining. The net return for the crop share lease was higher than the net return for fixed cash rent lease in 1996, 2006 through 2012, and in 2020 and 2021. During the 2006 to 2012 period, the annual net return for the crop share lease was on average $43 per acre higher than the annual net return for the fixed cash rent lease. In contrast, the average annual net return for the crop share lease was $37 per acre below that of the fixed cash rent lease during the 2013 to 2019 period. Projections for 2021 suggest that the net return for the crop share lease will be approximately $25 higher than the net return for the fixed cash rent lease.
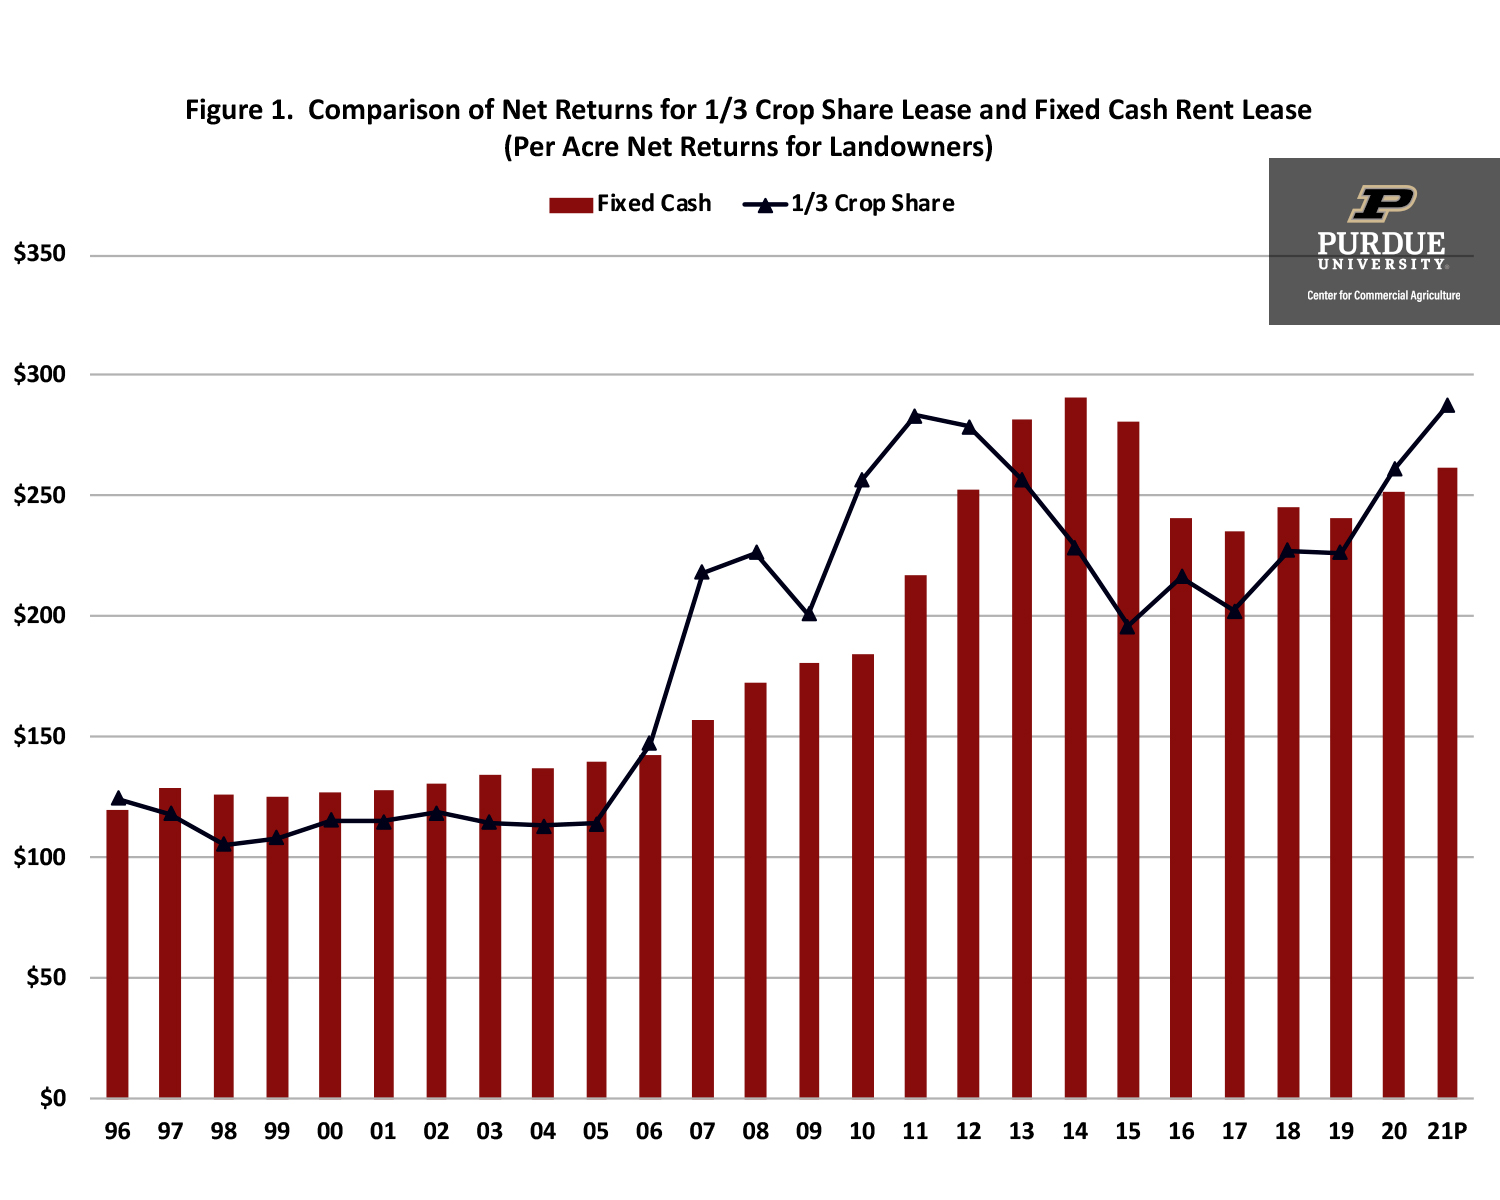
Figure 1. Comparison of Net Returns for 1/3 Crop Share Lease and Fixed Cash Rent Lease
(Per Acre Net Returns for Landowners)
Figure 2 presents a comparison of the annual net returns for the two crop share leasing arrangements. On average, the annual net return for the one-third crop share lease was $6 per acre higher than the annual net return for the one-half crop share lease. However, the net returns for the two crop share leasing arrangements were highly correlated (correlation coefficient between the two net return series was 0.98).
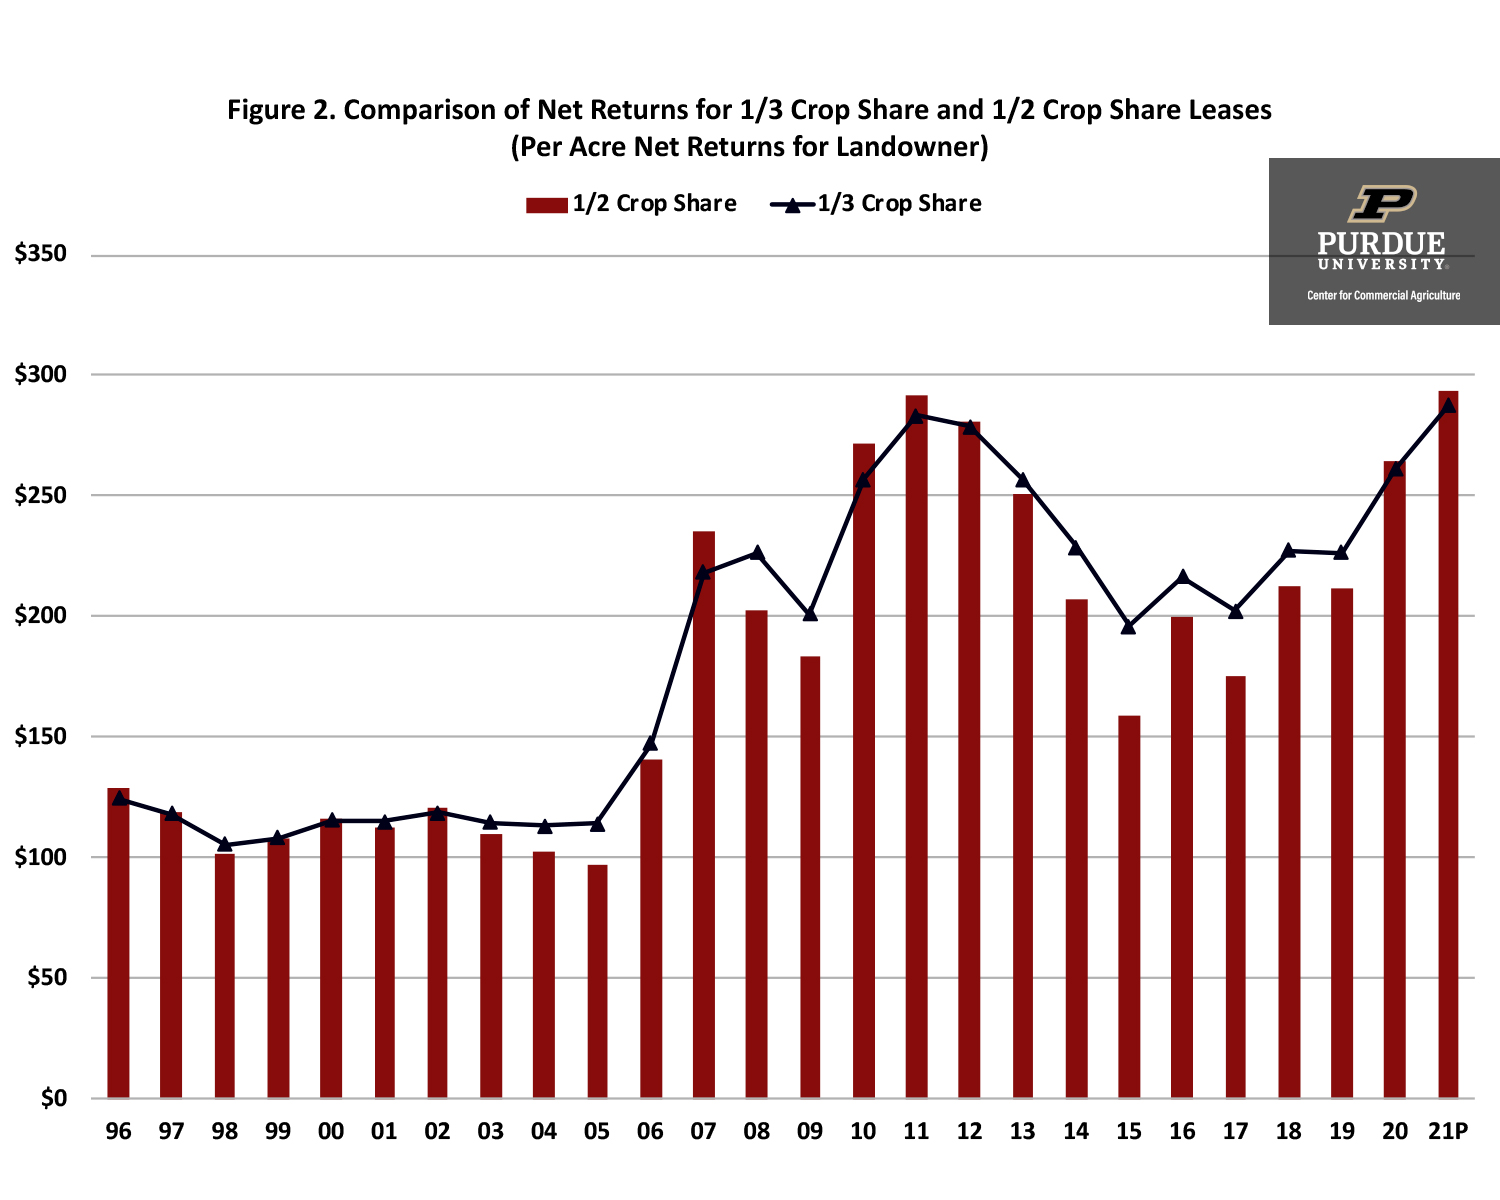
Figure 2. Comparison of Net Returns for 1/3 Crop Share and 1/2 Crop Share Leases
(Per Acre Net Returns for Landowner)
Differences between the two crop share leases and the fixed cash rent lease are illustrated in figure 3. This chart was created by subtracting the net returns for the one-half crop share lease and the net returns for the fixed cash rent lease from the net returns for the one-third crop share lease. As was noted above, the net returns for the two crop share leases are highly correlated. Net returns for these two leases tend to increase faster as gross revenue is increasing and decrease more rapidly when gross revenues are declining. In other words, the fixed cash rent lease does not react as strongly as the two crop share leasing arrangements to changes in gross revenue and crop profitability.
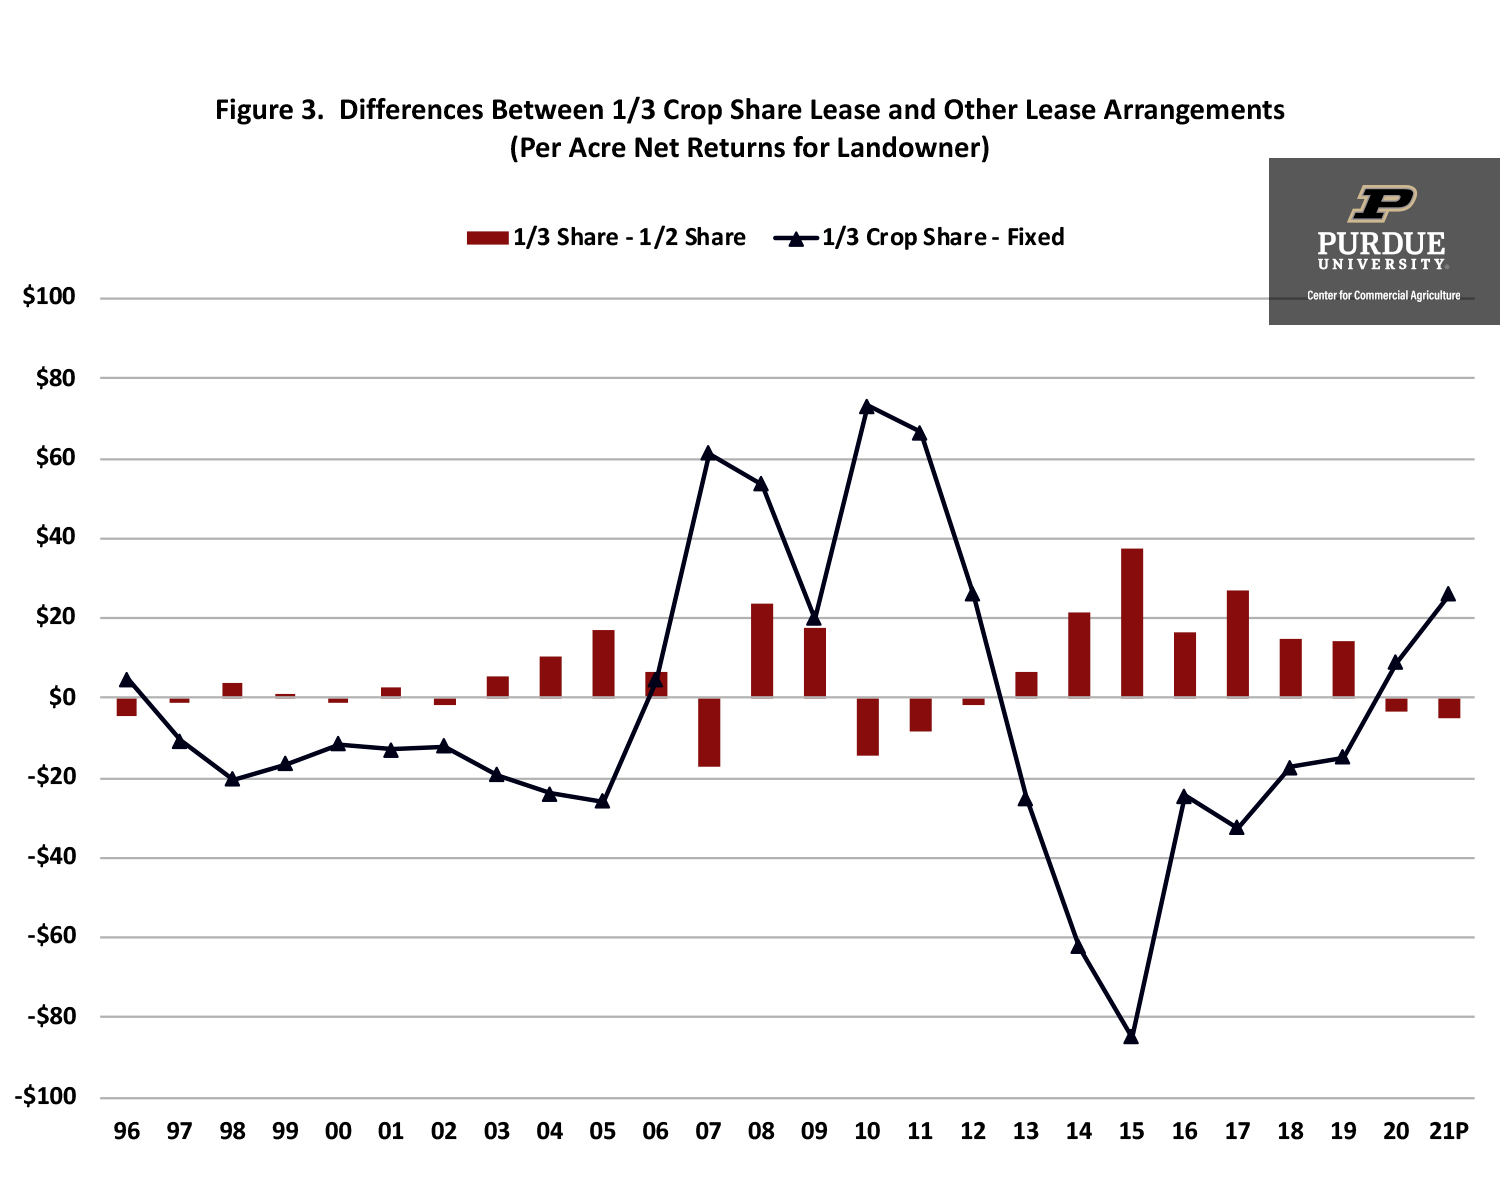
Figure 3. Differences Between 1/3 Crop Share Lease and Other Lease Arrangements
(Per Acre Net Returns for Landowner)
Summary and Conclusions
This article used a case farm in west central Indiana to compare the net return to land for two crop share leases with the net return for a fixed cash rent lease. Using the results of a previous article (here) along with those from this article, provide important insights. First, a landowner that is searching for a lease arrangement that combines the features of a traditional cash rent lease and a crop share lease should examine the flexible cash lease with a 90 percent base rent. This lease arrangement provides protection against downside risk and provides bonus payments in years where gross revenue is relatively high. Second, there are minor differences between a one-third crop share lease for which non-land expenses are not shared, and a one-half crop share lease for which seed, fertilizer, and chemical expenses are shared. One of the advantages of the fixed cash rent lease is that expenses are not shared. The one-third crop share lease shares this advantage, but also more closely reflects changes in gross revenue and crop profitability over time. For landlords that are interested in this feature and can withstand rapid changes in net returns, the one-third crop share lease may be an attractive leasing arrangement.
References
Kuethe, T.H. “Indiana Farmland Prices Hit New Record High in 2021.” Purdue Agricultural Economic Report, July 2021.
Langemeier, M. “Comparing Net Returns for Alternative Leasing Arrangements.” Center for Commercial Agriculture, Purdue University, August 2021.
![]()
![]()
![]()
![]()
![]()
TAGS:
TEAM LINKS:

RELATED RESOURCES
UPCOMING EVENTS
We are taking a short break, but please plan to join us at one of our future programs that is a little farther in the future.