July 12, 2024
Corn & Soybean Basis Strengthen Through June & July
by Josh Strine


In June, we discussed the unpredictability of summer basis, the possibility of large swings in basis, and the historical pattern of weakening basis as the growing season progresses. Depending on where you are located, Indiana corn and soybean basis have seen large swings in the last six weeks. Unlike history suggests, the movement has generally been a strengthening in basis. For example, SE Indiana corn basis was -$0.13/bu. in the first week of June but was $0.03/bu. on July 10th (figure 1). Strengthening in other regions, such as NE Indiana, has been less significant, with an increase in basis as low as $0.01/bu. over the last six weeks (figure 2). In all of Indiana, the gap between this year’s corn basis and the historic three-year average has decreased. Indiana ethanol basis follows a similar trend to the regional corn basis.
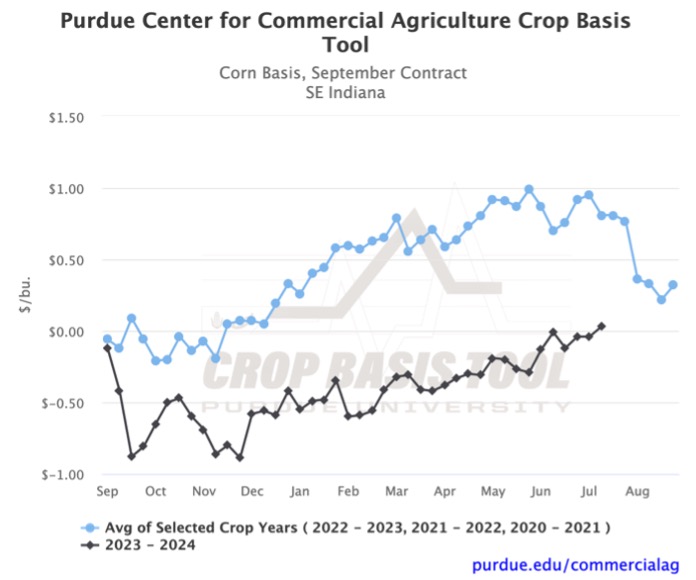
Figure 1. Southeast Indiana Corn Basis, September Contract
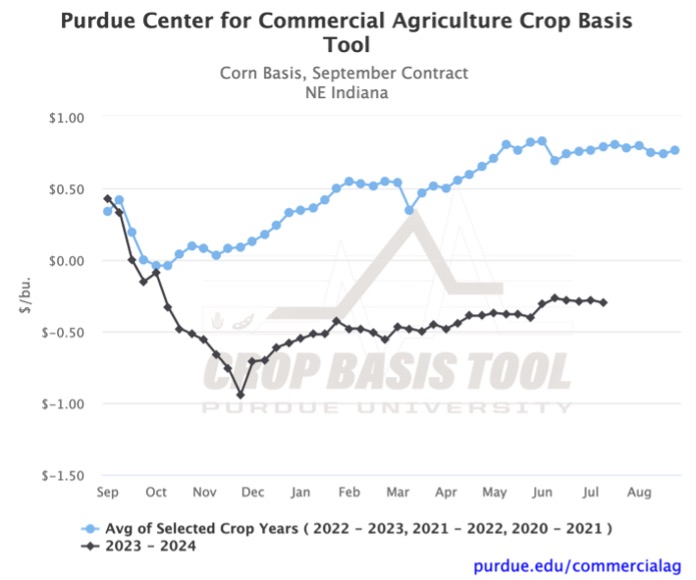
Figure 2. Northeast Indiana Corn Basis, September Contract
Like corn basis, soybean basis has seen varying levels of strengthening over the past six weeks. The greatest increase in basis was in SW Indiana, -$0.06/bu. in the first week of June to $0.22/bu. on July 10th (figure 3). NW Indiana had the least significant strengthening, an increase of $0.02/bu., in June and July. In NW Indiana, there was a peak in the middle of June in which the basis was $0.13/bu. greater than its current level as of July 10th. The change in corn and soybean basis ($/bu.) for each Indiana region over the past six weeks is included in Table 1.

Figure 3. Southwest Indiana Soybean Basis, August Contract
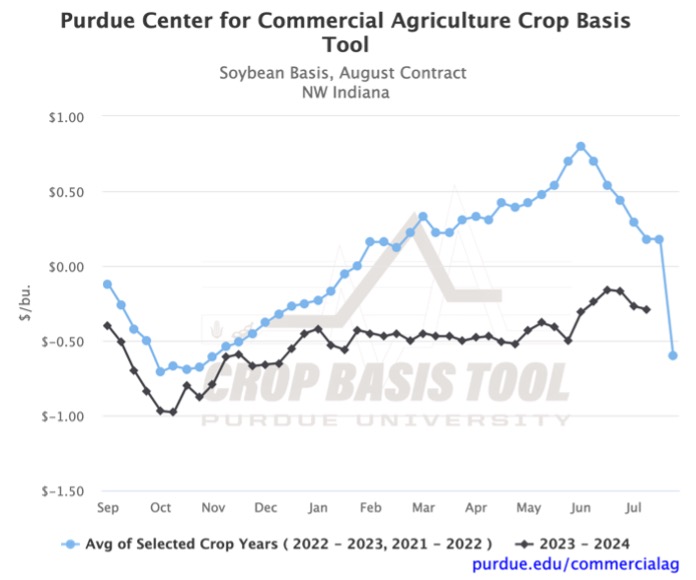
Figure 4. Northwest Indiana Soybean Basis, August Contract

Table 1. Indiana Regional Changes in Corn and Soybean Basis
There has also been movement in Indiana soybean processor basis and Ohio River basis through the first two months of summer. Indiana soybean processor basis has increased from $0.11/bu. to $0.35/bu. over the past six weeks (figure 5). During the same timeframe, the gap between this year’s basis and the three-year average has decreased by over $1.00/bu. The current $0.14/bu. gap is the smallest it has been since the first week of January. A similar trend is observed in the Ohio River soybean basis (figure 6). Over the past six weeks, the Ohio River soybean basis has strengthened by $0.23/bu., and the gap to the historical trend has decreased by $0.89/bu.
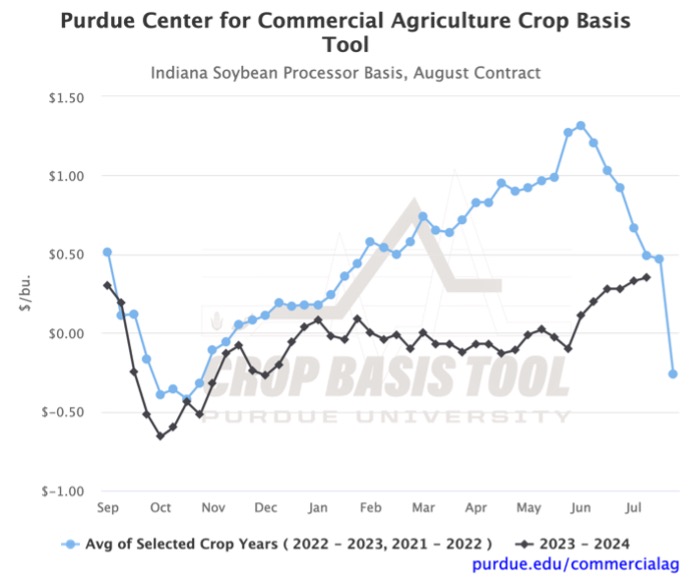
Figure 5. Indiana Soybean Processor Basis, August Contract
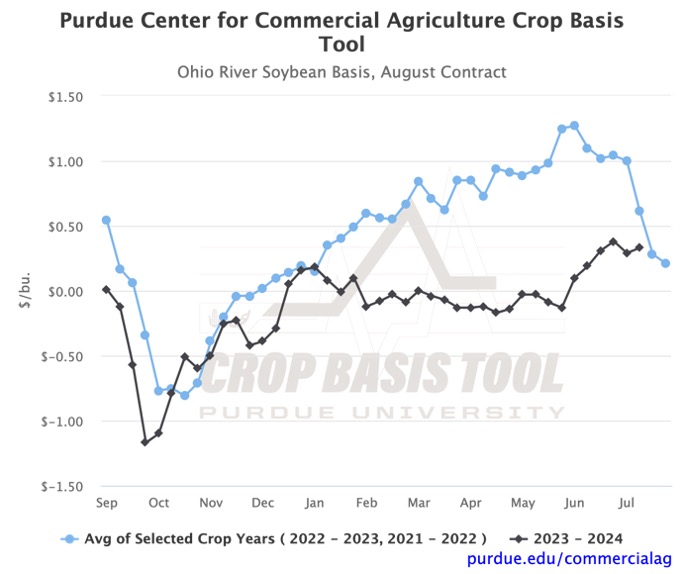
Figure 6. Ohio River Soybean Basis, August Contract
Through early summer, we have seen a strengthening in the basis for both corn and soybeans. As a result, many basis levels are the highest they have been since September of last year for corn (September contracts) and soybeans (August contracts). The recent strengthening of soybean basis diverges from the significant weakening found in the three-year average. While basis levels this year have not closely followed the three-year trend, the historic average still suggests a weakening in basis as we progress through summer and into fall. As always, be sure to visit the Purdue Center for Commercial Agriculture Crop Basis Tool to check current corn and soybean basis levels and historical basis trends in your local area.
TAGS:
TEAM LINKS:

RELATED RESOURCES
UPCOMING EVENTS
Join educators from across the Midwest to build skills for communicating soil health concepts on Nov. 4-5, 2026. In the field, we’ll evaluate the relationship between soil health and water management focusing on irrigation and edge of field practices. The in-service will have both classroom and on farm demonstrations.
The Land of Opportunity: A Conference for Farmland Owners will be held at two locations on October 5 and October 6, providing farmland owners with valuable information and resources to help them make informed decisions about their land. The conference will feature keynote presentations, educational breakout sessions, and networking opportunities designed specifically for those who own, manage, or have an interest in farmland.