June 13, 2025
Corn Basis Continues to Improve as Soybean Basis Varies
by Josh Strine


As July futures near expiration, corn basis across the Eastern Corn Belt continues to strengthen. In Central Ohio, the basis has improved by $0.12/bu over the past three weeks to $0.26/bu, reaching a ten-year high for the second week of June (Figure 1). This diverges from the historical average, which typically shows a flat or weakening basis into June. Indiana has seen more modest gains, though most areas remain above the three-year average. In Illinois and Iowa, corn basis has historically continued to increase through the first half of June, and the trend has persisted this year. For example, the Central Illinois corn basis increased by $0.04/bu over the past three weeks, while the historical average increased by $0.01/bu (Figure 2). Across Illinois and Iowa, basis levels are still consistently below the three-year average.
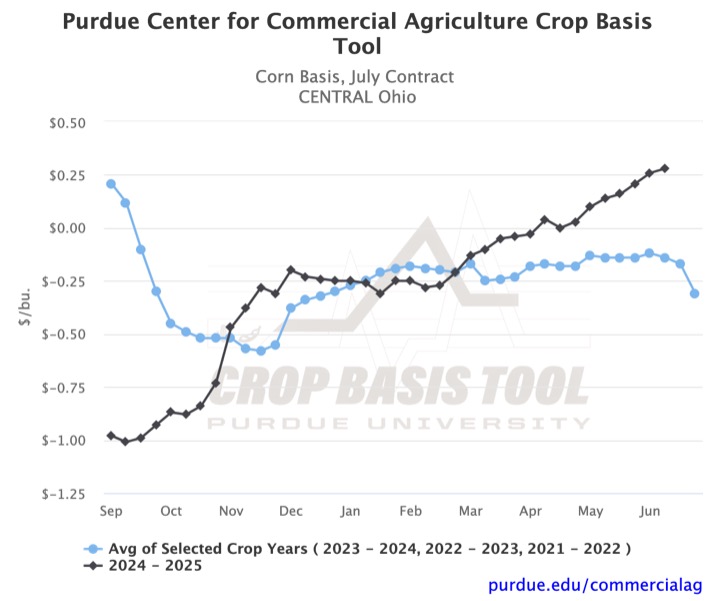
Figure 1. Corn Basis, July Contract for Central Ohio
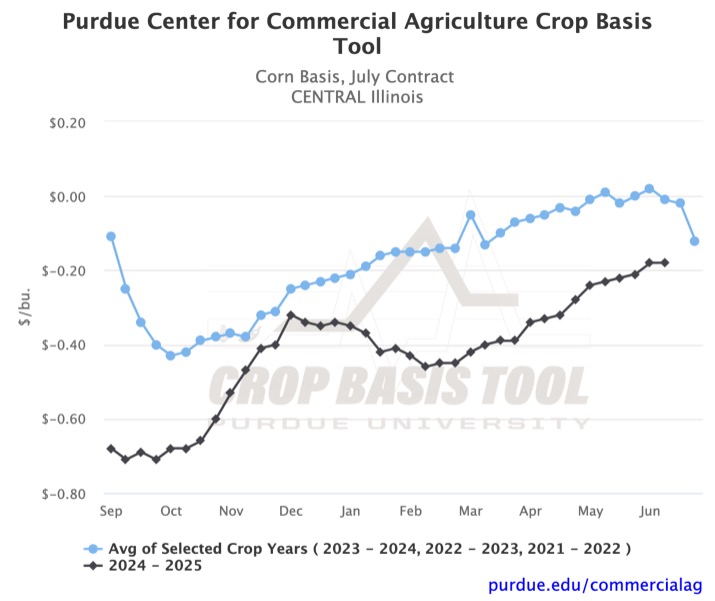
Figure 2. Corn Basis, July Contract for Central Illinois
While corn basis movement has been consistent across the region, soybean basis movement has been volatile. Many districts show either flat or slightly rising basis. For example, Southern Indiana saw the basis increase by $0.08/bu since the third week of May (Figure 3). Similarly, the soybean basis on the Ohio River increased by $0.08/bu in the past three weeks (Figure 4). However, parts of the region have also seen soybean basis drop off in the past week. The most significant basis weakening in Indiana has been in the West Central district, where the basis has dropped $0.15/bu, falling back below the two-year average (Figure 5). The recent volatility is unusual. Figures 3 and 5 show week-to-week swings of $0.20/bu and $0.10/bu in the historical averages, respectively.
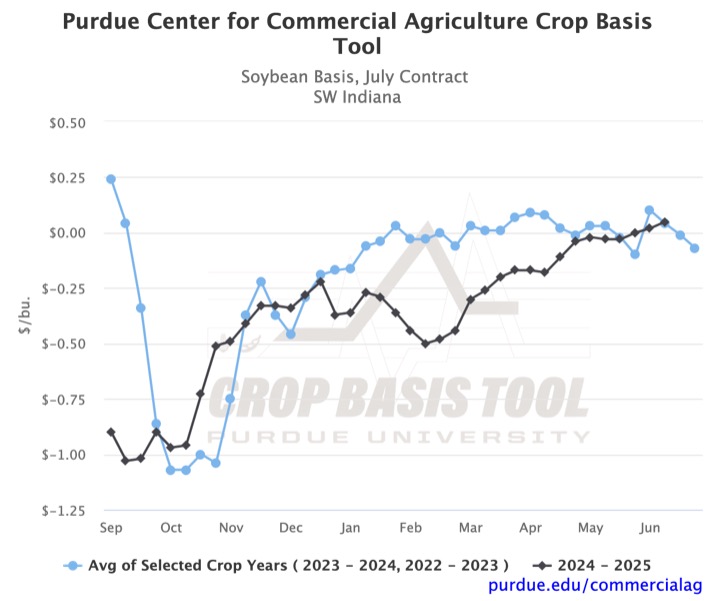
Figure 3. Soybean Basis, July Contract for South West Indiana
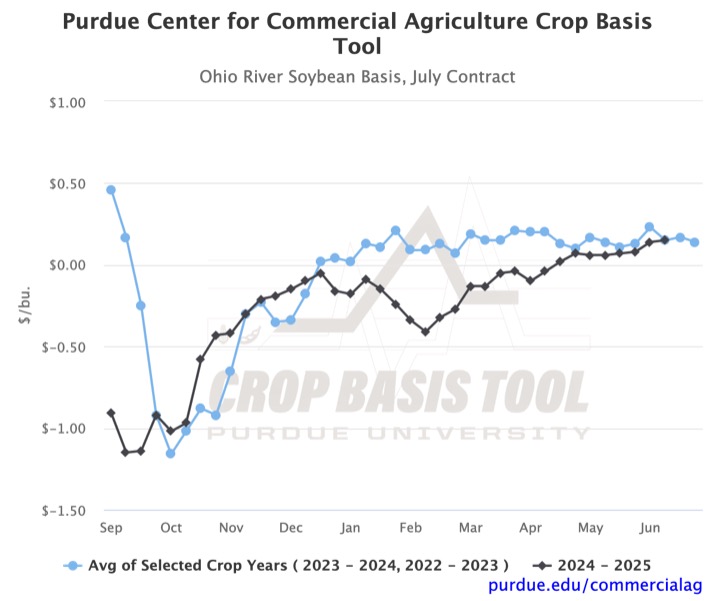
Figure 4. Ohio River Soybean Basis, July Contract
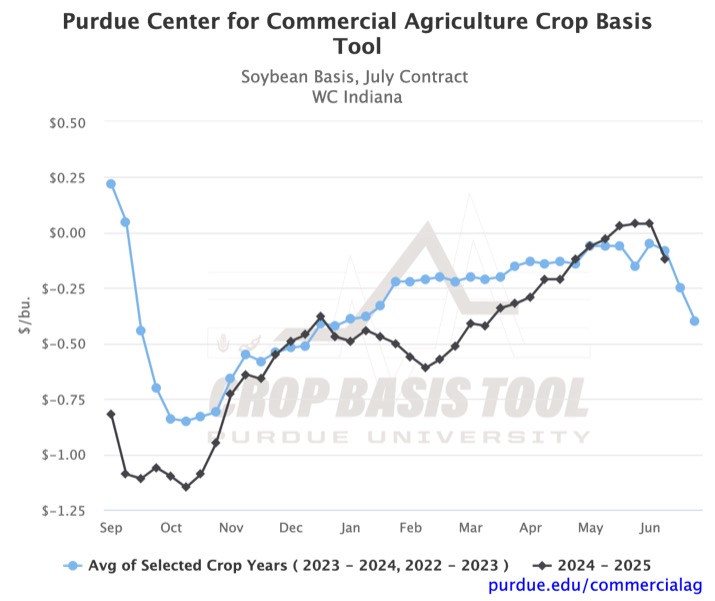
Figure 5. Soybean Basis, July Contract for West Central Indiana
The most significant basis movement over the past month has occurred at soybean processors across the region. In Indiana, processor bids dropped $0.28/bu in just one week to an average of $0.03/bu (Figure 6). This coincides with ADM rolling their basis pricing from July to November futures at soybean crush plants. As a result of the sharp fall in Indiana and Ohio, the average cash bid on the Ohio River is now higher than the average soybean processor cash bid in either state. The premiums soybean processors offered over local elevators have also narrowed.
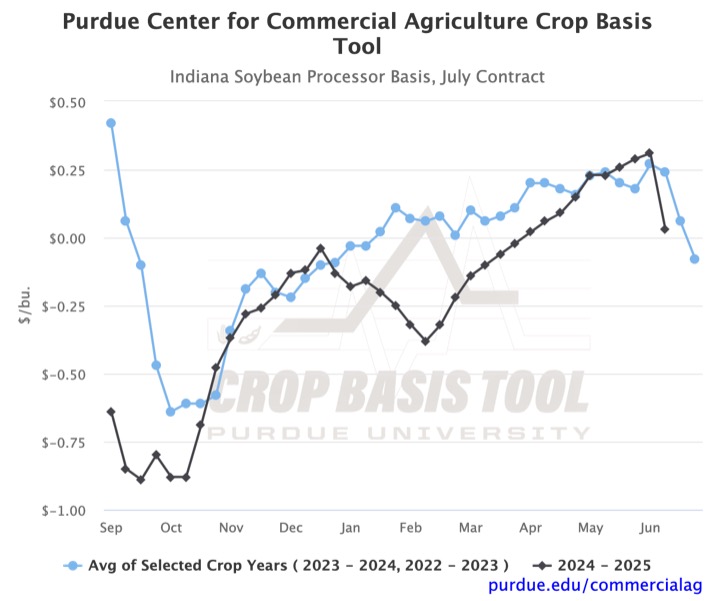
Figure 6. Indiana Soybean Processor Basis, July Contract
Looking forward, historical trends suggest that the basis will weaken through the end of June. While some local soybean basis levels have weakened, the drop in processors’ prices has been more dramatic. As the price premium offered by soybean crushers has fallen, local basis weakening may be more severe in the coming weeks. To explore local basis trends, visit the Purdue Center for Commercial Agriculture’s Crop Basis Tool.
TAGS:
TEAM LINKS:

RELATED RESOURCES
UPCOMING EVENTS
Join educators from across the Midwest to build skills for communicating soil health concepts on Nov. 4-5, 2026. In the field, we’ll evaluate the relationship between soil health and water management focusing on irrigation and edge of field practices. The in-service will have both classroom and on farm demonstrations.
The Land of Opportunity: A Conference for Farmland Owners will be held at two locations on October 5 and October 6, providing farmland owners with valuable information and resources to help them make informed decisions about their land. The conference will feature keynote presentations, educational breakout sessions, and networking opportunities designed specifically for those who own, manage, or have an interest in farmland.