November 21, 2025
Corn and Soybean Basis Stabilizes After Seasonal Post-Harvest Rise
by Josh Strine
![]()
![]()
![]()
![]()
![]()
As harvest wraps up across the Eastern Corn Belt, we have observed substantial increases in soybean and corn basis. This post-harvest increase is consistent with historical patterns; however, its magnitude has kept this year’s basis above the historical trend in Indiana, Ohio, and Michigan. For example, in central Ohio, recent corn basis movement has pushed the basis to March futures to -$0.16/bu, which is $0.30/bu higher than the historical average (Figure 1). In west central Indiana, soybean basis to March futures has increased by $0.46/bu over the past four weeks, reaching a marketing year high of -$0.34/bu (Figure 2).
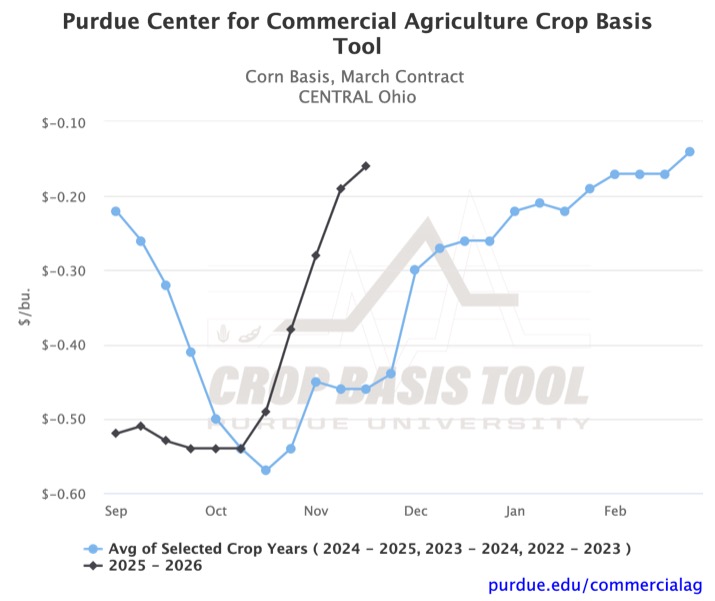
Figure 1. Corn Basis, March Contract for Central Ohio
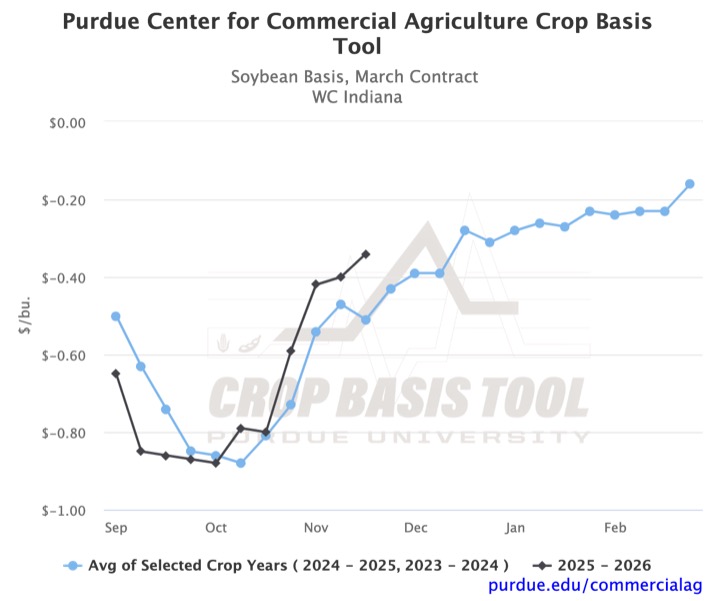
Figure 2. Soybean Basis, March Contract for West Central Indiana
In contrast to the substantial basis increase in the easternmost states monitored in the Crop Basis Tool, Iowa has experienced a more gradual post-harvest improvement. While basis has increased across much of the state, a weak start to the marketing year has kept several locations at seven-year lows. Figure 3 provides an example using the central Iowa corn basis to March futures. Although the basis for the third week of November is a marketing year high, it is still $0.22/bu below the three-year average.
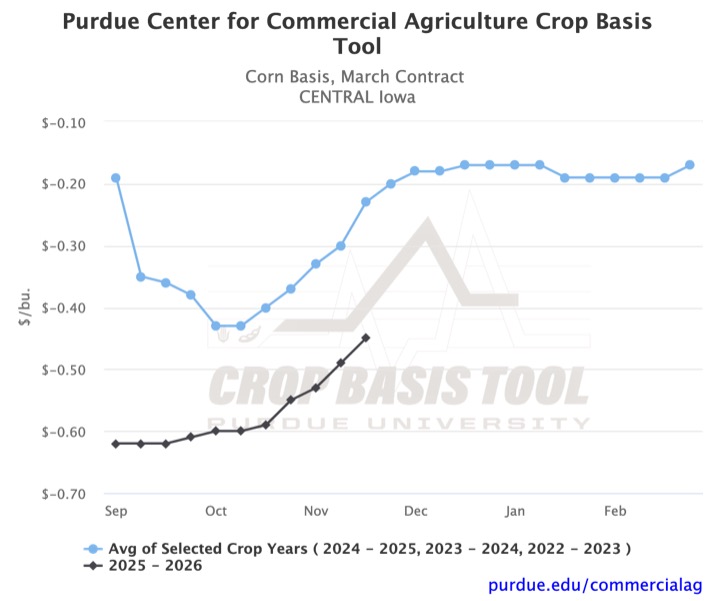
Figure 3. Corn Basis, March Contract for Central Iowa
In Illinois, we observe a transition from the below-trend basis in Iowa to the above-trend basis in Indiana. The basis is below the historical average in the southwestern part of the state and above it in the southeastern part. In the rest of the state, both corn and soybean basis are within a few cents of the historical trend. For example, corn basis in central Illinois has been within $0.02/bu of the historical average since the second week of October (Figure 4). When we look at Figures 3 and 4 together, we see that the historical corn basis to March futures in central Iowa and central Illinois are very similar. In fact, Iowa’s historical trend is slightly higher than Illinois’s, further highlighting this year’s relative weakness in Iowa.

Figure 4. Corn Basis, March Contract for Central Illinois
As we head into winter, historical trends suggest a slowing of the recent strengthening and a relatively stable basis over the next couple of months. Looking at recent basis movement in Figures 1 and 2, strengthening in the last week or two is already much less than that observed in October. However, in-season divergences in this year’s basis from the historical trend, as shown in Figure 1, remind us that the historical average is not a perfect predictor of future basis.
To stay up to date on your local corn or soybean basis, you can visit the Purdue Center for Commercial Agriculture’s Crop Basis Tool.
![]()
![]()
![]()
![]()
![]()
TAGS:
TEAM LINKS:

RELATED RESOURCES
UPCOMING EVENTS
We are taking a short break, but please plan to join us at one of our future programs that is a little farther in the future.