November 5, 2025
Explaining Fluctuations in DDG Prices
by Michael Langemeier
![]()
![]()
![]()
![]()
![]()
Distiller’s dried grains (DDGs) are a co-product of dry-milled ethanol production. U.S. ethanol plants have the capacity to produce more than 17.5 billion gallons of ethanol and 35.3 million tons of DDG (Ag MRC). DDGs from corn contain, on average, 30 percent protein, 10 percent fat, and 7 percent fiber. Approximately 18 pounds of DDGs (10 percent moisture content) are produced from one bushel of corn. Because their protein content is higher than that of corn, DDGs can be substituted for corn and soybean meal in livestock diets. More information pertaining to the substitution of DDG for corn and soybean meal in the U.S. can be found in Hoffman and Baker (2011).
Given the substitutability of DDGs for corn and soybean meal; we would expect DDG prices to be significantly related to these feedstuffs. To help explain fluctuations in DDG prices, this article examines the relationship between DDG prices, and corn and soybean meal prices. Price data used below were obtained from monthly issues of Feed Outlook, which reports DDG, corn, and soybean meal prices for central Illinois.
Variability of DDG Prices and Other Feedstuffs
Figure 1 depicts monthly DDG and corn prices from January 2007 to December 2024. The average DDG and corn prices over this period were $173 per ton and $167 per ton, respectively. These two price series are highly correlated (r = 0.851). The positive correlation indicates that corn and DDG prices tend to move in the same direction. However, there are times when the two prices diverge. For example, in December of 2008 and January 2009, corn prices were 33% to 37% higher than DDG prices, while from March 2020 to July 2020, during the heart of the COVID outbreak, corn prices were from 25% to 46% lower than DDG prices.
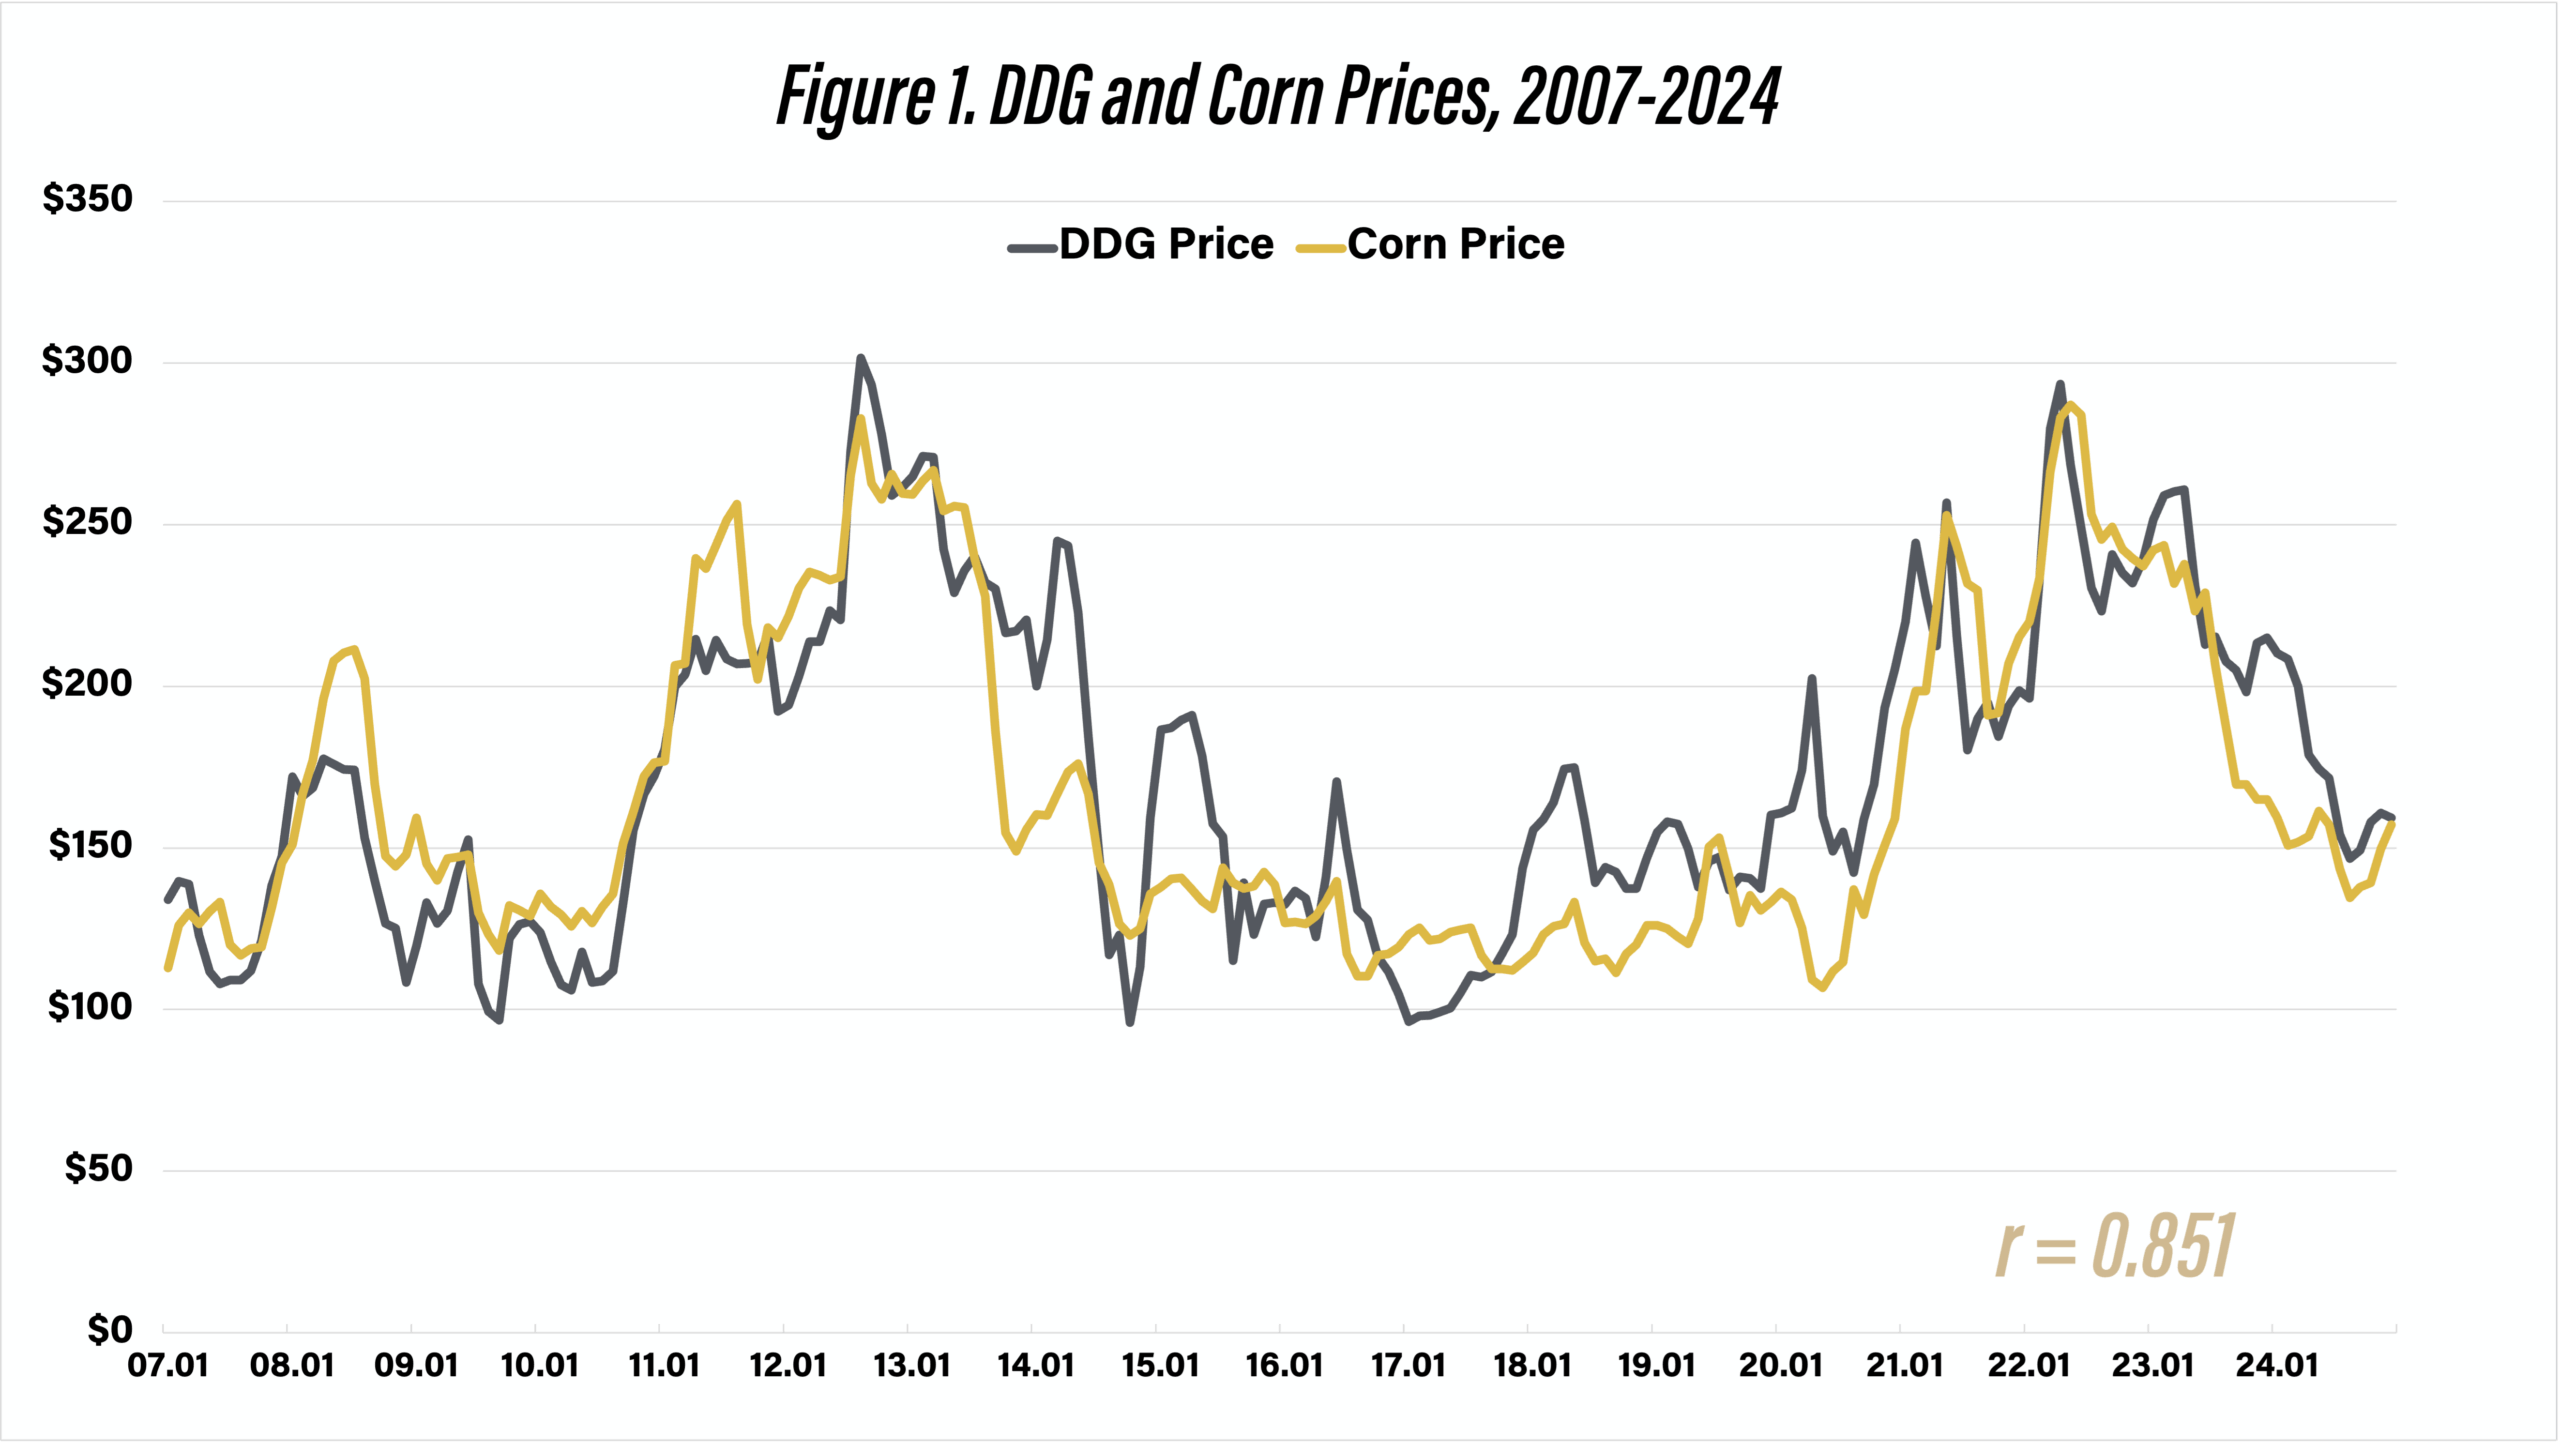
Figure 1. DDG and Corn Prices, 2007-2024
Monthly DDG and soybean meal (SBM) prices from January 2007 to December 2024 are illustrated in figure 2. Average DDG and soybean meal prices over the period were $173 per ton and $363 per ton, respectively. On average, soybean meal prices were 119 percent higher than DDG prices. Though soybean meal prices tend to be higher than DDG prices, these two price series are highly correlated (r = 0.727). Note that the correlation between soybean meal and DDG prices is lower than the correlation between corn prices and DDG prices. However, the correlation between corn and SBM prices is 0.615, lower than the correlation between soybean meal and DDG prices. The difference between soybean meal and DDG prices ranged from 35 percent in November 2011 to 338 percent in September 2014.
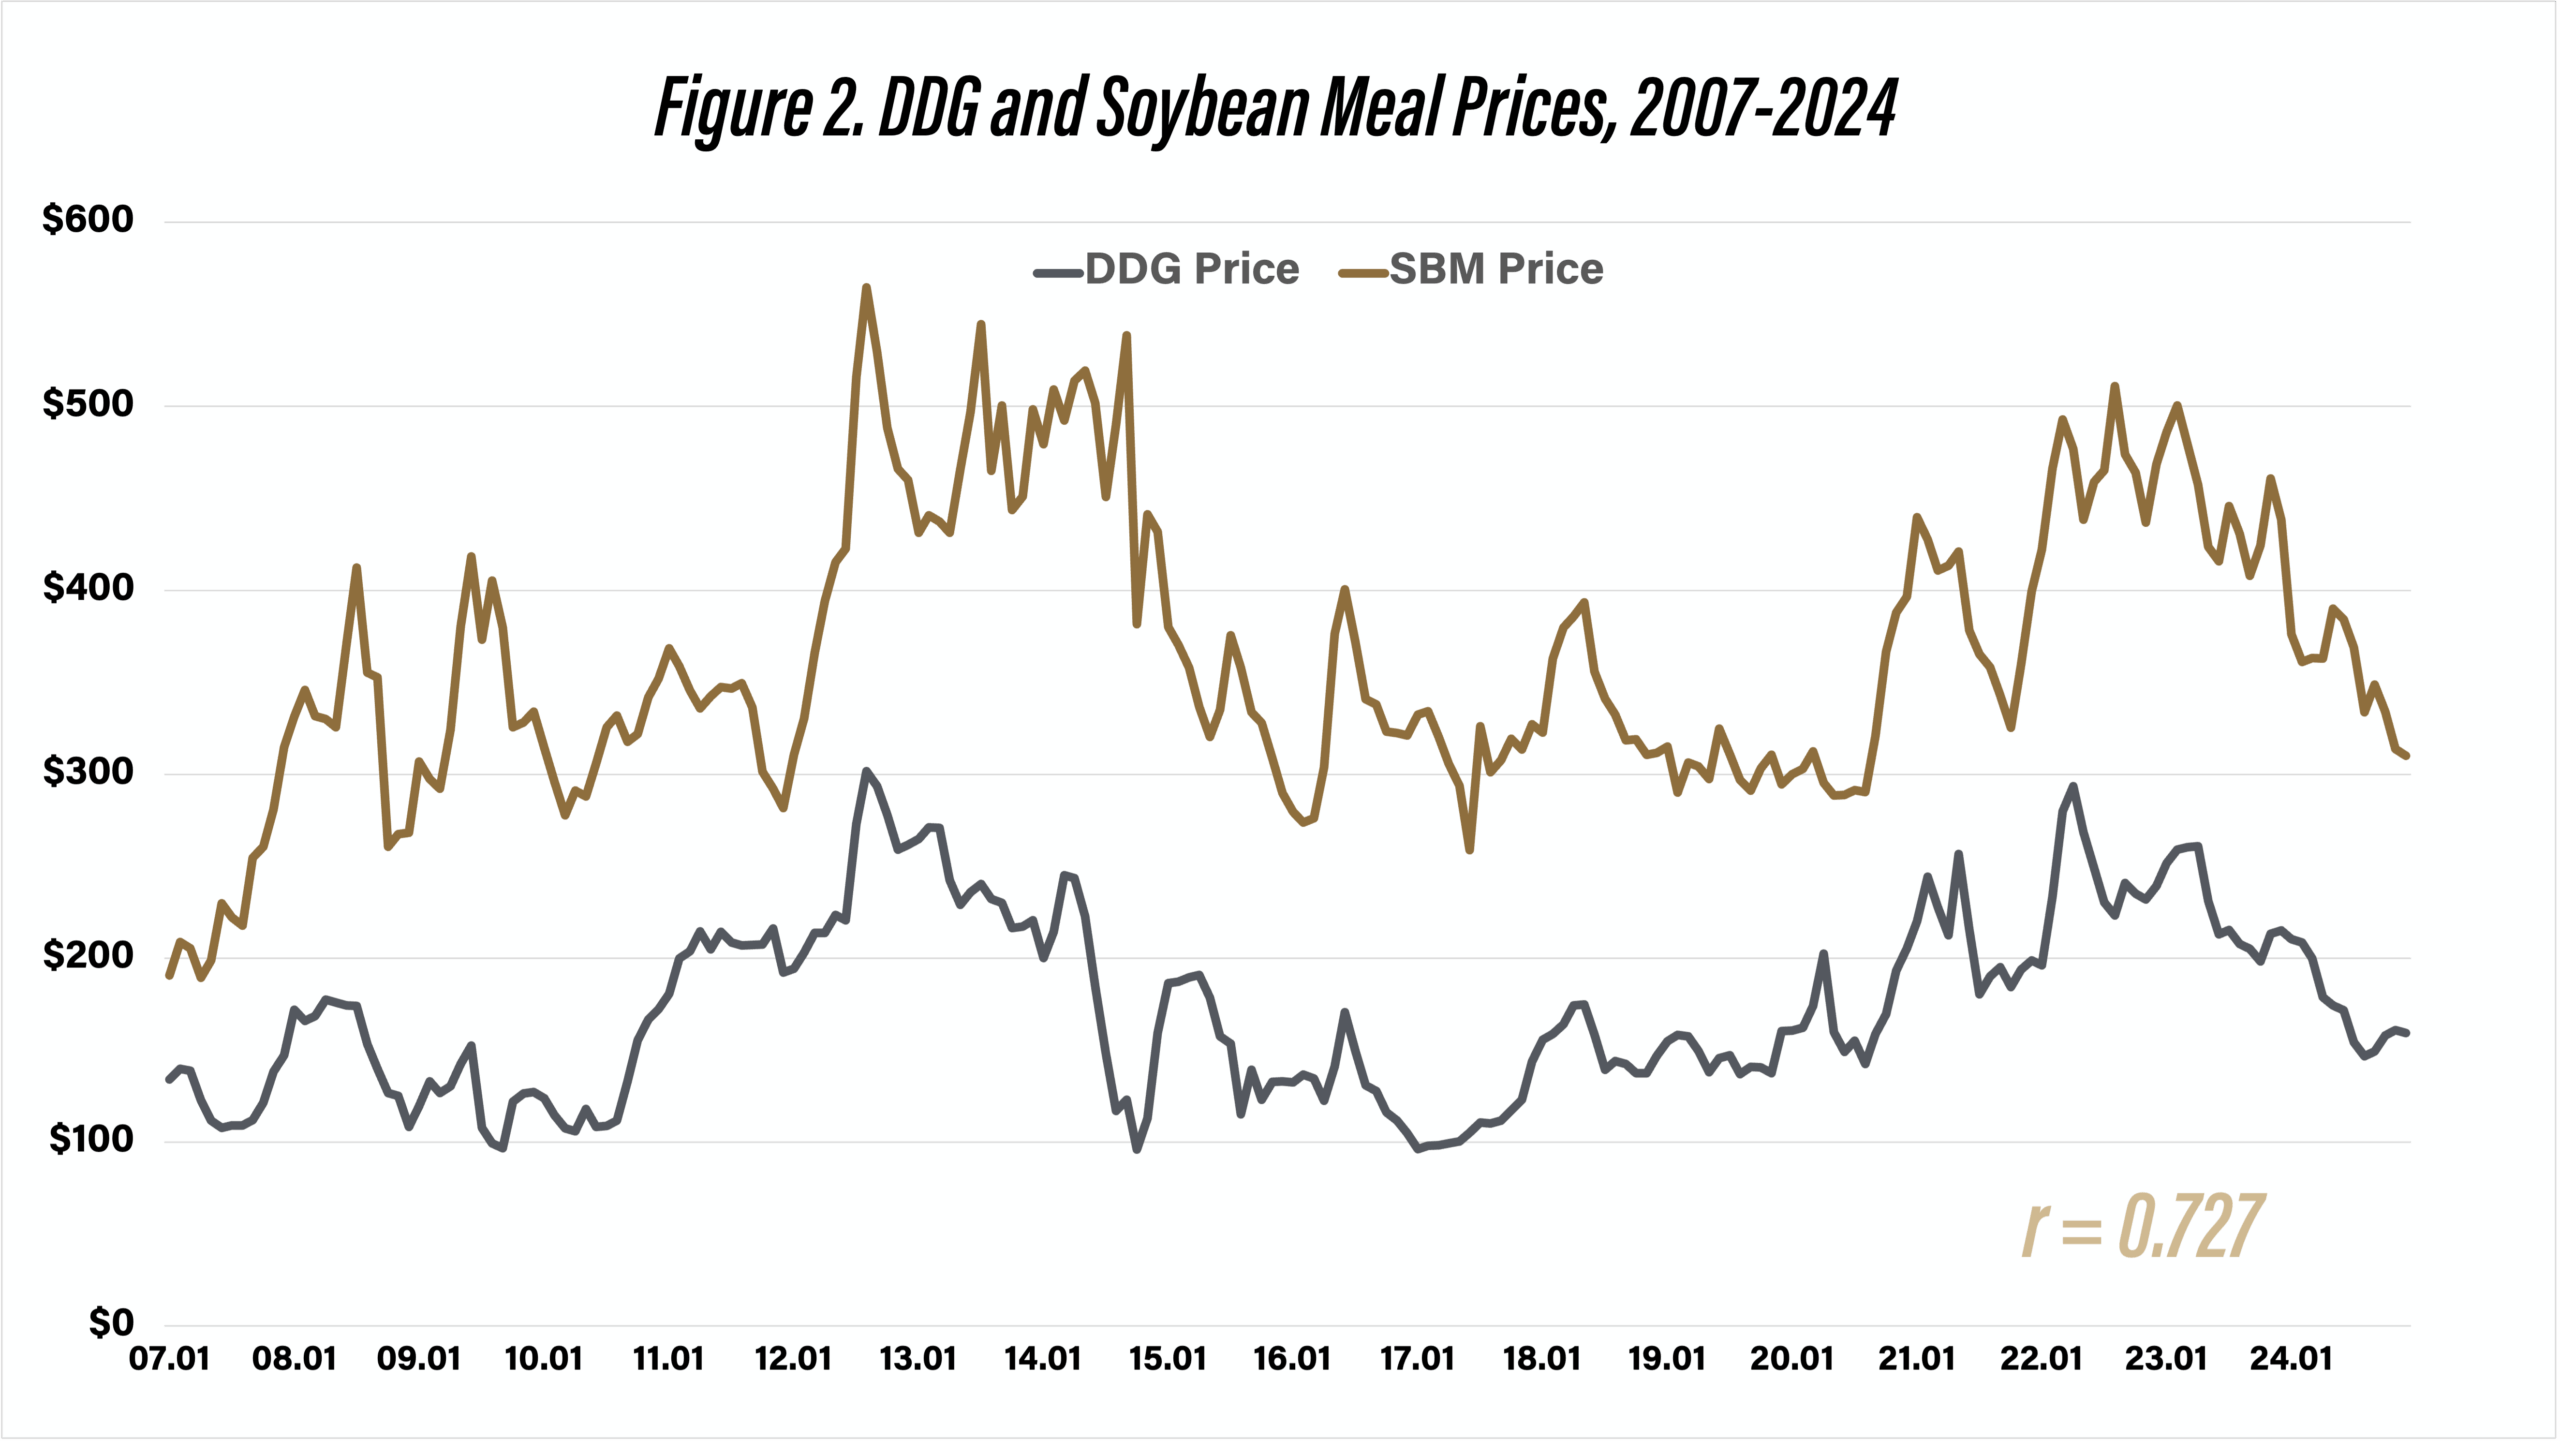
Figure 2. DDG and Soybean Meal Prices, 2007-2024
Factors Impacting DDG Prices
From the information above, it is evident that DDG prices are sensitive to changes in corn and soybean meal prices. Regression analysis using data from January 2007 to December 2024 for central Illinois was used to examine the relationship between these variables. Results are as follows: each $0.10 per bushel ($3.57 per ton) increase in corn price results in a $2.31 per ton increase in DDG prices, and each $10 per ton increase in soybean meal prices results in a $2.14 increase in DDG prices. To more fully understand the impact of corn and SBM prices on DDG prices, we computed coefficients of separate determination (Langemeier et al., 1992). These coefficients can be used to measure the influence of each independent variable upon the dependent variable. The sum of the coefficients of separate determination for each variable equals the R-square goodness of fit measure, which was 0.792 for the DDG price regression. This goodness of fit statistic indicates that 79.2 percent of the variation in DDG prices was explained by fluctuations in corn and SBM prices. Computed coefficients of separate determination indicated that corn price and SBM price explained approximately 55.3 and 23.9 percent of the variation in DDG prices, respectively.
Figure 3 presents the actual and predicted DDG prices. There are times when the predicted DDG prices are either substantially below or above actual DDG prices, revealing the difficulty associated with predicting DDG prices with just corn price and soybean price information. For example, from December 2023 to March 2024, predicted DDG prices were well below actual DDG prices. In the last six months of 2024, actual DDG prices closely matched predicted prices.
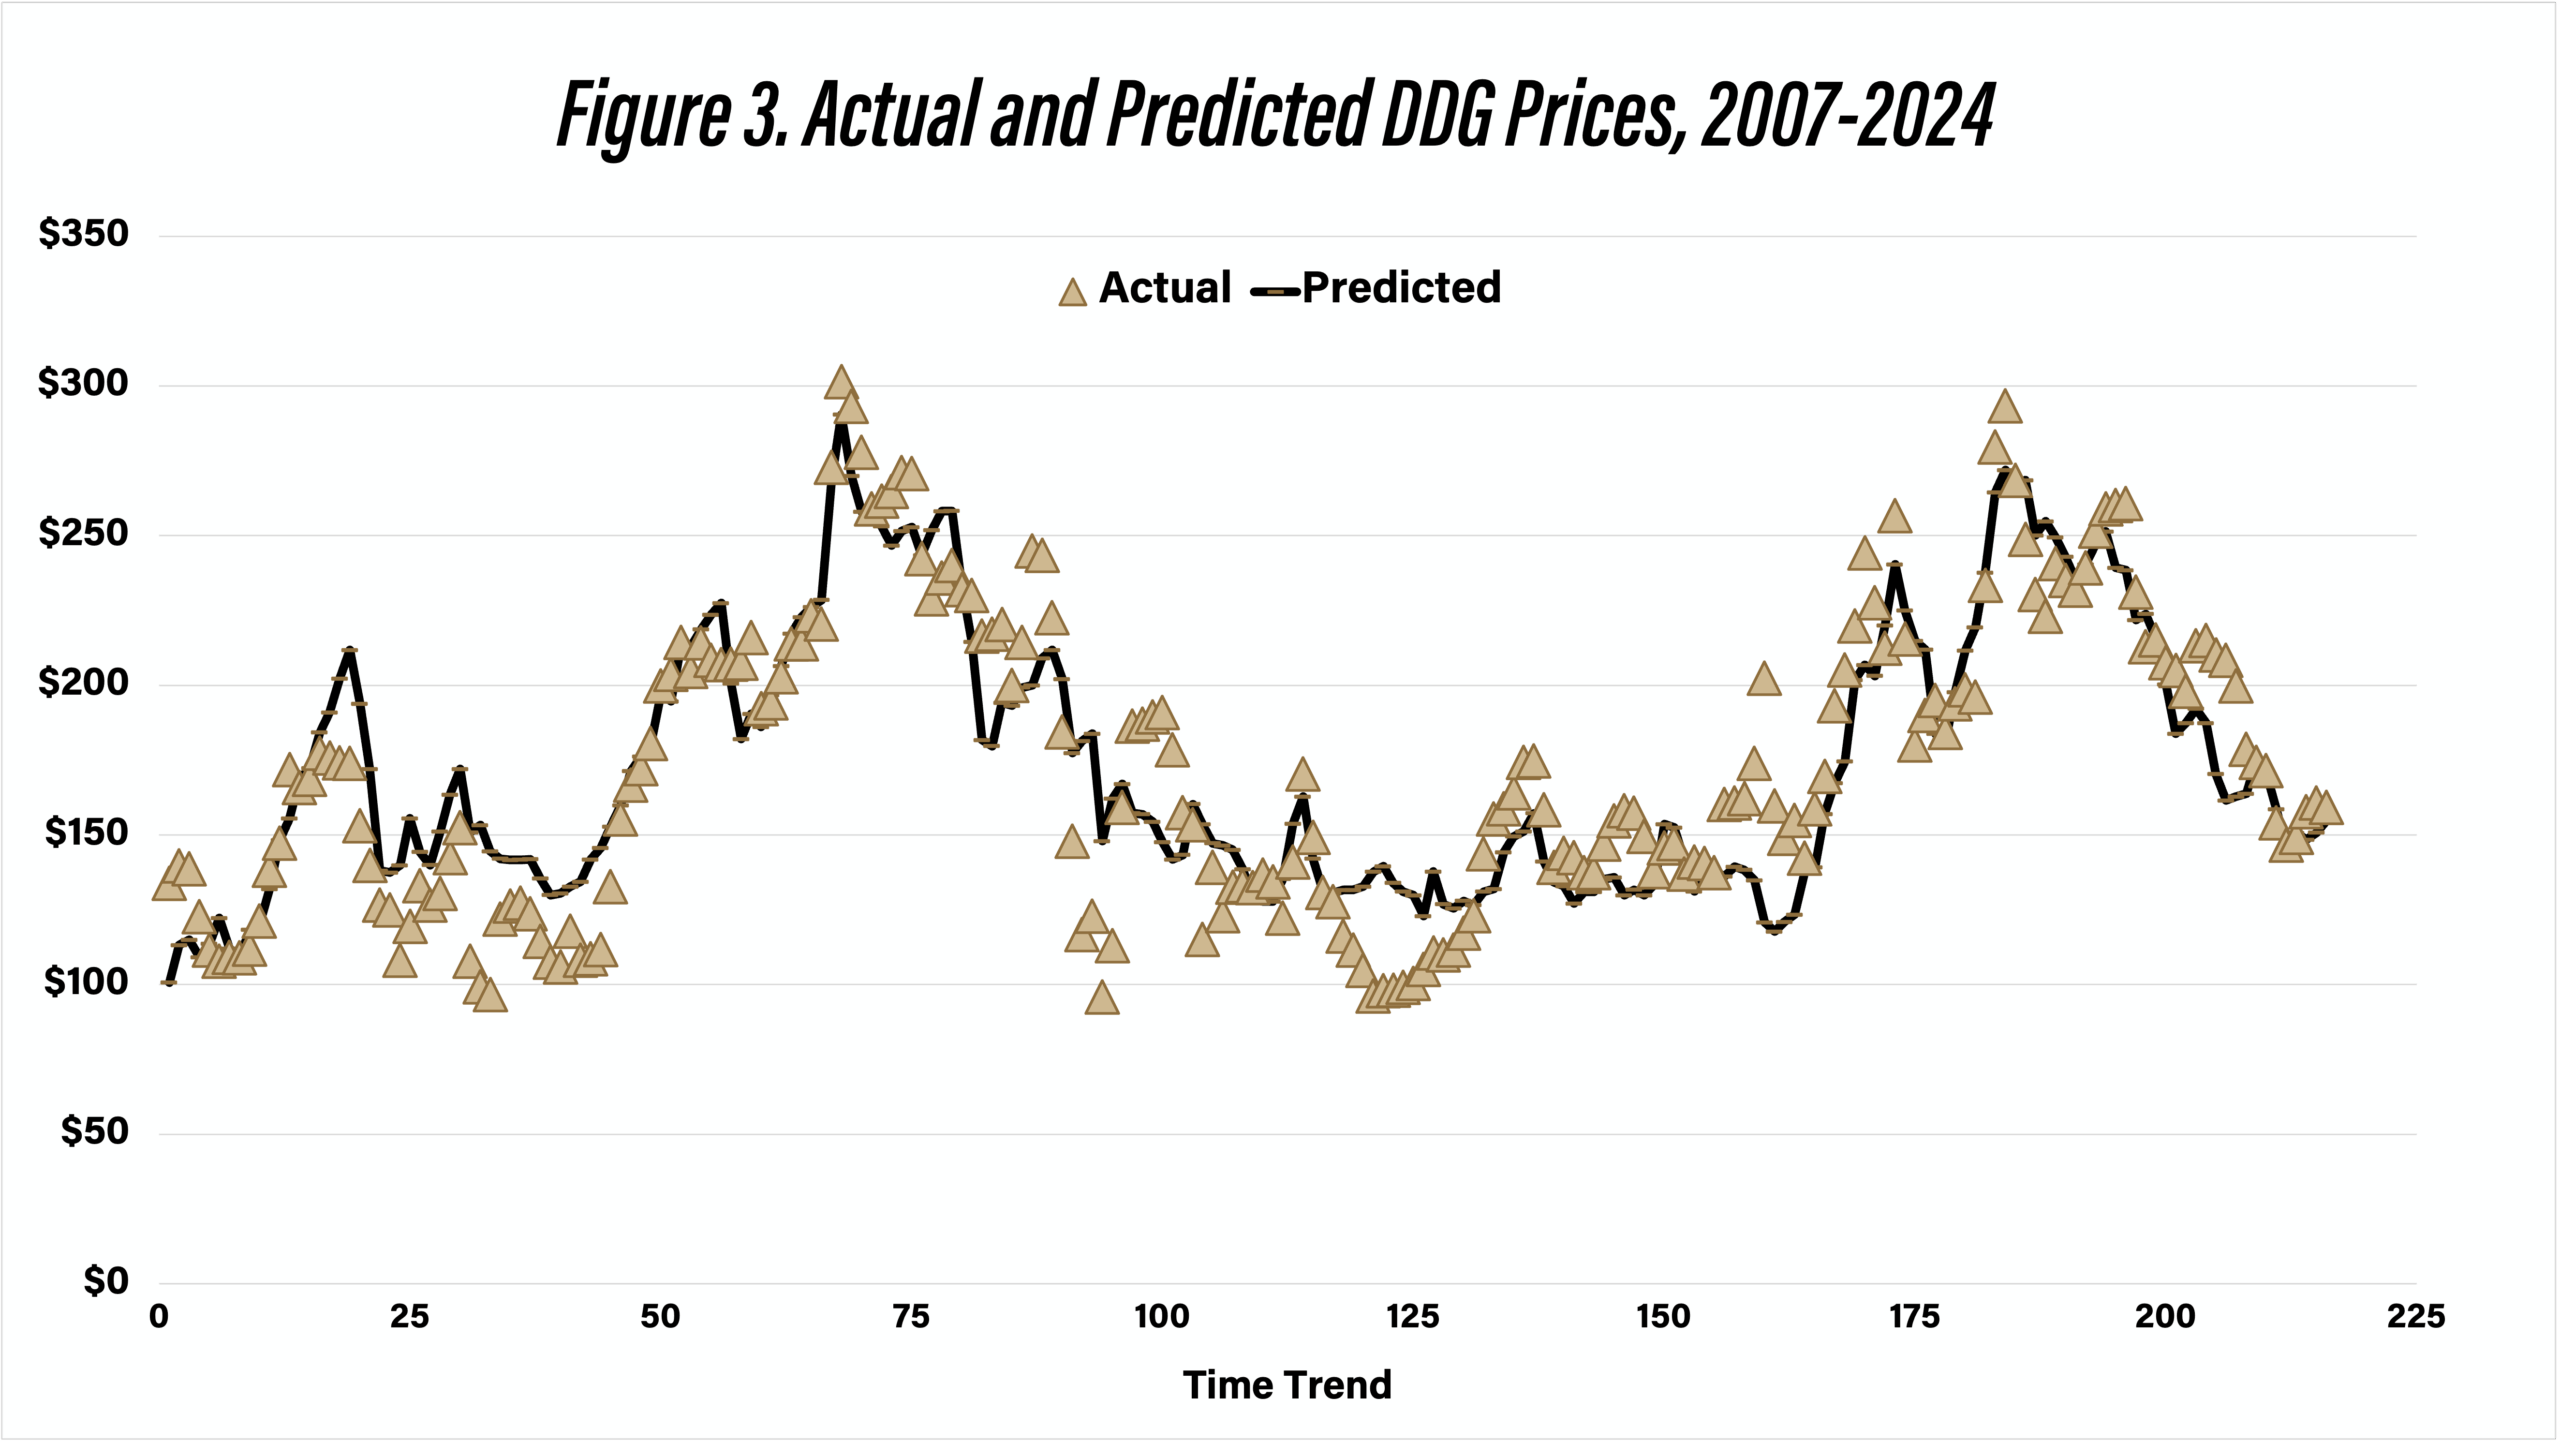
Figure 3. Actual and Predicted DDG Prices, 2007-2024
Projected DDG Prices
As noted above, DDG prices are sensitive to changes in both corn and SBM prices. Using projected corn and soybean meal prices for the last quarter of 2025 and the first quarter of 2026 (i.e., $4.00 corn and $325 SBM), DDG prices are projected to range from $145 to $155 per ton. Of course, there is a wide band around projected corn and SBM prices. If corn and SBM prices are 10 percent lower than projections, predicted DDG prices would range from $125 to $135 per ton. Predicted DDG prices would range from $160 to $170 if corn and SBM prices are 10 percent higher than current projections.
Summary and Conclusions
DDGs are an important feedstuff in the U.S. DDGs often substitute for both corn and soybean meal in livestock rations. Because DDG prices are not as readily available as corn and soybean meal prices, it can be difficult to gauge the impact of DDG prices on projected feed costs. This article examined fluctuations in DDG prices since 2007, and related movement in DDG prices to movements in corn and soybean meal prices. DDG prices were significantly correlated with corn prices and soybean meal prices.
References
Agriculture Marketing Resource Center, www.agmrc.org, accessed September 9, 2025.
“Feed Outlook,” United Department of Agriculture, Economic Research Service, various issues.
Hoffman, L.A. and A. Baker. “Estimating the Substitution of Distillers’ Grains for Corn and Soybean Meal in the U.S. Feed Complex.” FDS-11-I-01, United States Department of Agriculture, Economic Research Service, October 2011.
Langemeier, M., T. Schroeder, and J. Mintert. “Determinants of Cattle Finishing Profitability.” Southern Journal of Agricultural Economics. 24(December 1992):41-47.
![]()
![]()
![]()
![]()
![]()
TAGS:
TEAM LINKS:

RELATED RESOURCES
UPCOMING EVENTS
We are taking a short break, but please plan to join us at one of our future programs that is a little farther in the future.