January 16, 2026
Crop Basis Trends Up Across the Eastern Corn Belt, but Regional Variance is Significant


From Iowa to Ohio, corn and soybean basis to March futures have been steady to slightly increasing since the beginning of 2026. In many crop reporting districts across the region, basis has remained at or above the historical average. However, despite recent strengthening, corn and soybean basis in Iowa remain well below historical averages. This variation underscores significant variance in local basis levels across the region.
Recent movement in Indiana, Ohio, and Michigan corn basis to March futures has pushed basis levels well above the three-year average. In some districts, such as east-central Indiana, the basis is even positive (Figure 1). In Illinois, current basis levels closely track the three-year average, generally ranging from -$0.20/bu to -$0.30/bu, with a few local outliers. While Iowa corn basis has strengthened over the past month, local basis levels remain well below the historical average across the state. In northwest Iowa, corn basis to March futures is -$0.38/bu, $0.16/bu weaker than the three-year average (Figure 2). In fact, several basis levels for the second week of January across the state are the lowest they have been since the 2018-2019 marketing year.
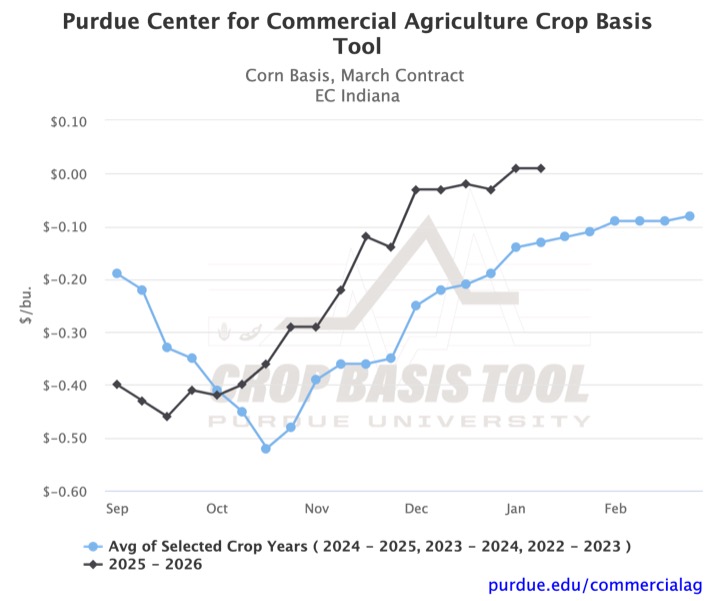
Figure 1. Corn Basis, March Contract for East Central Indiana
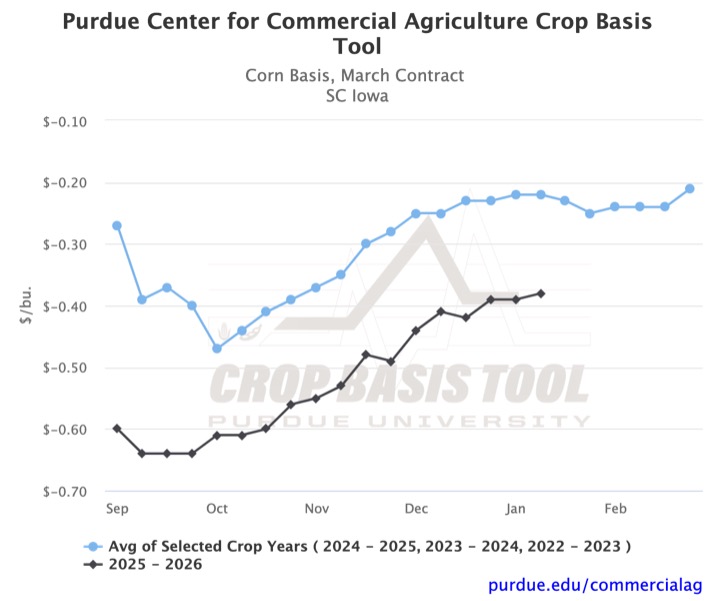
Figure 2. Corn Basis, March Contract for Southwest Iowa
Trends in soybean basis across the region are very similar to those of local corn basis. A $0.26/bu increase in central Michigan’s soybean basis to March futures has moved it to -$0.25/bu (Figure 3). This is the highest the local basis to March futures has been for the second week of January since the 2004-2005 marketing year. On the other hand, local soybean basis levels in Iowa average around -$0.75/bu, with the lowest being -$0.81/bu in northwest Iowa (Figure 4). The lowest tracked soybean basis level outside of Iowa is -$0.49/bu in east central Michigan. However, that is $0.27/bu greater than the historically weaker local basis.
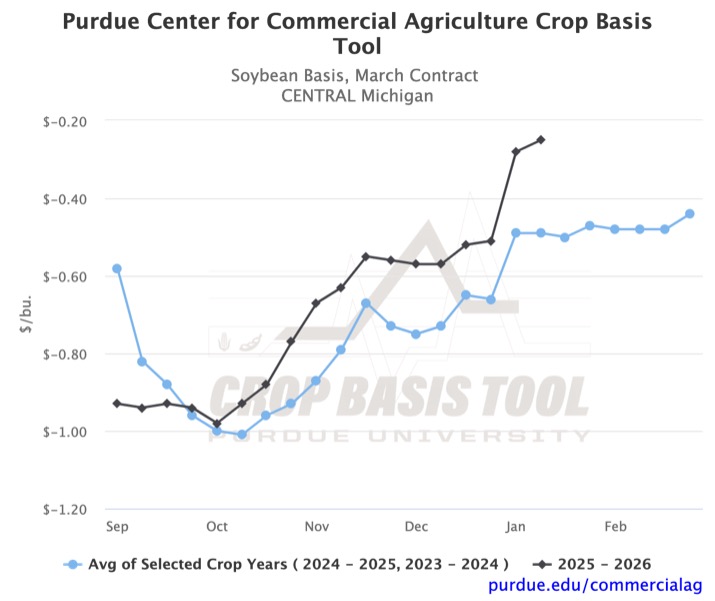
Figure 3. Soybean Basis, March Contract for Central Michigan
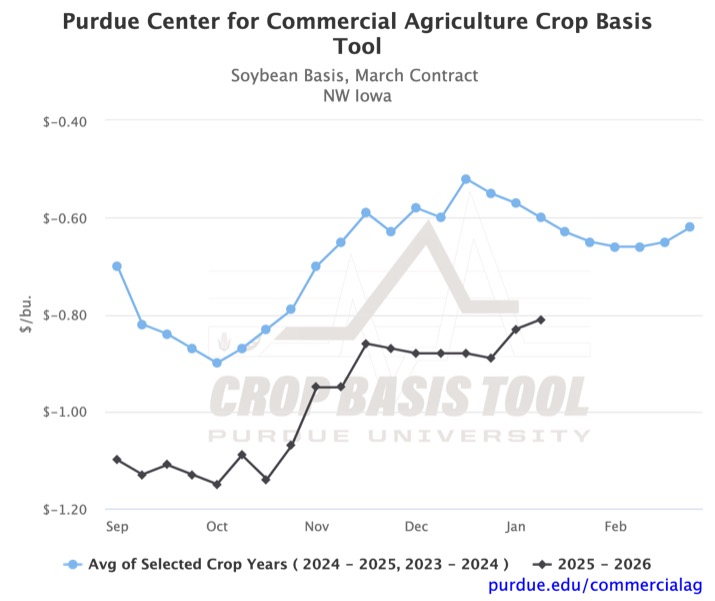
Figure 4. Soybean Basis, March Contract for Northwest Iowa
Looking at unique delivery points, such as ethanol plants, soybean processors, and river terminals, we again see similar trends of strengthening. These delivery points broadly offer higher cash prices than other grain terminals. In Indiana, ethanol plants and soybean processors have a positive basis. In Ohio, ethanol plants have a positive basis. In Illinois, soybean processors have a positive basis. One trend to follow is basis levels at soybean processors in Indiana and Ohio, as well as on the Ohio River. Currently, the Ohio River basis is stronger than the soybean processor basis in either state (Figures 5 and 6). Crop movement along the river is often tied to export, which may indicate a greater demand from export than local crushing plants currently.
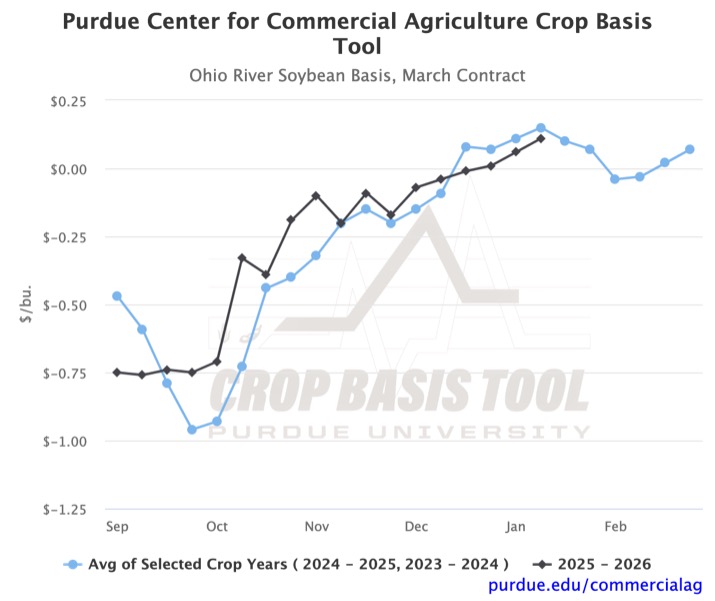
Figure 5. Ohio River Basis, March Contract
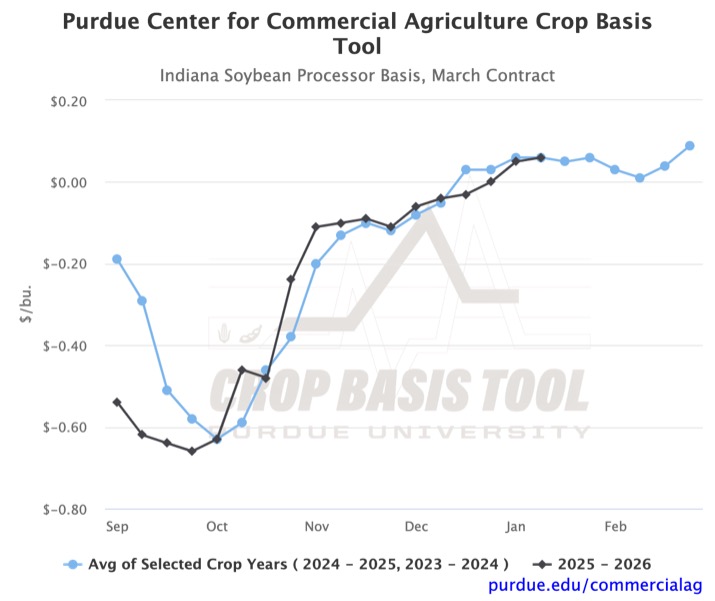
Figure 6. Indiana Soybean Processor Basis, March Contract
As we track basis to March futures over the next six weeks, recent movement and the historical trends may suggest continued stability or slight strengthening. However, some local or regional basis levels may weaken based on historical trends present in Figures 4 and 5. If crop basis is being used for strategic marketing, it is also important to track more distant basis levels, such as July, which may behave differently based on futures’ unique price volatility. To see your local basis relative to nearby or other futures contracts, you can visit the Purdue Center for Commercial Agriculture’s Crop Basis Tool.
TAGS:
TEAM LINKS:
RELATED RESOURCES
UPCOMING EVENTS
Join educators from across the Midwest to build skills for communicating soil health concepts on Nov. 4-5, 2026. In the field, we’ll evaluate the relationship between soil health and water management focusing on irrigation and edge of field practices. The in-service will have both classroom and on farm demonstrations.
The Land of Opportunity: A Conference for Farmland Owners will be held at two locations on October 5 and October 6, providing farmland owners with valuable information and resources to help them make informed decisions about their land. The conference will feature keynote presentations, educational breakout sessions, and networking opportunities designed specifically for those who own, manage, or have an interest in farmland.