February 11, 2026
What 2026 Crop Budgets Mean for Profitability and Cash Rent Decisions
by Michael Langemeier
![]()
![]()
![]()
![]()
![]()
The 2026 Purdue Crop Cost and Return Guide, gives estimated costs for planting, growing, and harvesting a variety of crops, as well as estimated contribution margins and earnings. The guide is updated frequently as grain futures prices change and the costs of inputs, such as seed, fertilizer, pesticides and fuel, fluctuate. This paper discusses estimates made in early January.
The guide presents cost and return information for low, average, and high productivity soils. Table 1 presents crop budget information for low productivity soil. Tables 2 and 3 present crop budget information for average and productivity soils, respectively. The discussion in this paper will focus on the estimates for average productivity soil. Double-crop soybeans are typically planted after wheat, so it is typical to combine the contribution margin for these two crops when comparing to continuous corn, rotation corn, and rotation soybeans. The yield estimates reflect trend yields for Indiana for each crop. The contribution margin for average productivity soil, obtained by subtracting total variable cost from market revenue, was $116 per acre for continuous corn and $216 per acre for wheat/double-crop soybeans. The contribution margins for rotation corn and rotation soybeans on average productivity soil are $202 and $263 per acre, respectively. The contribution margin is used to cover overhead costs such as machinery ownership costs, family and hired labor, and cash rent.
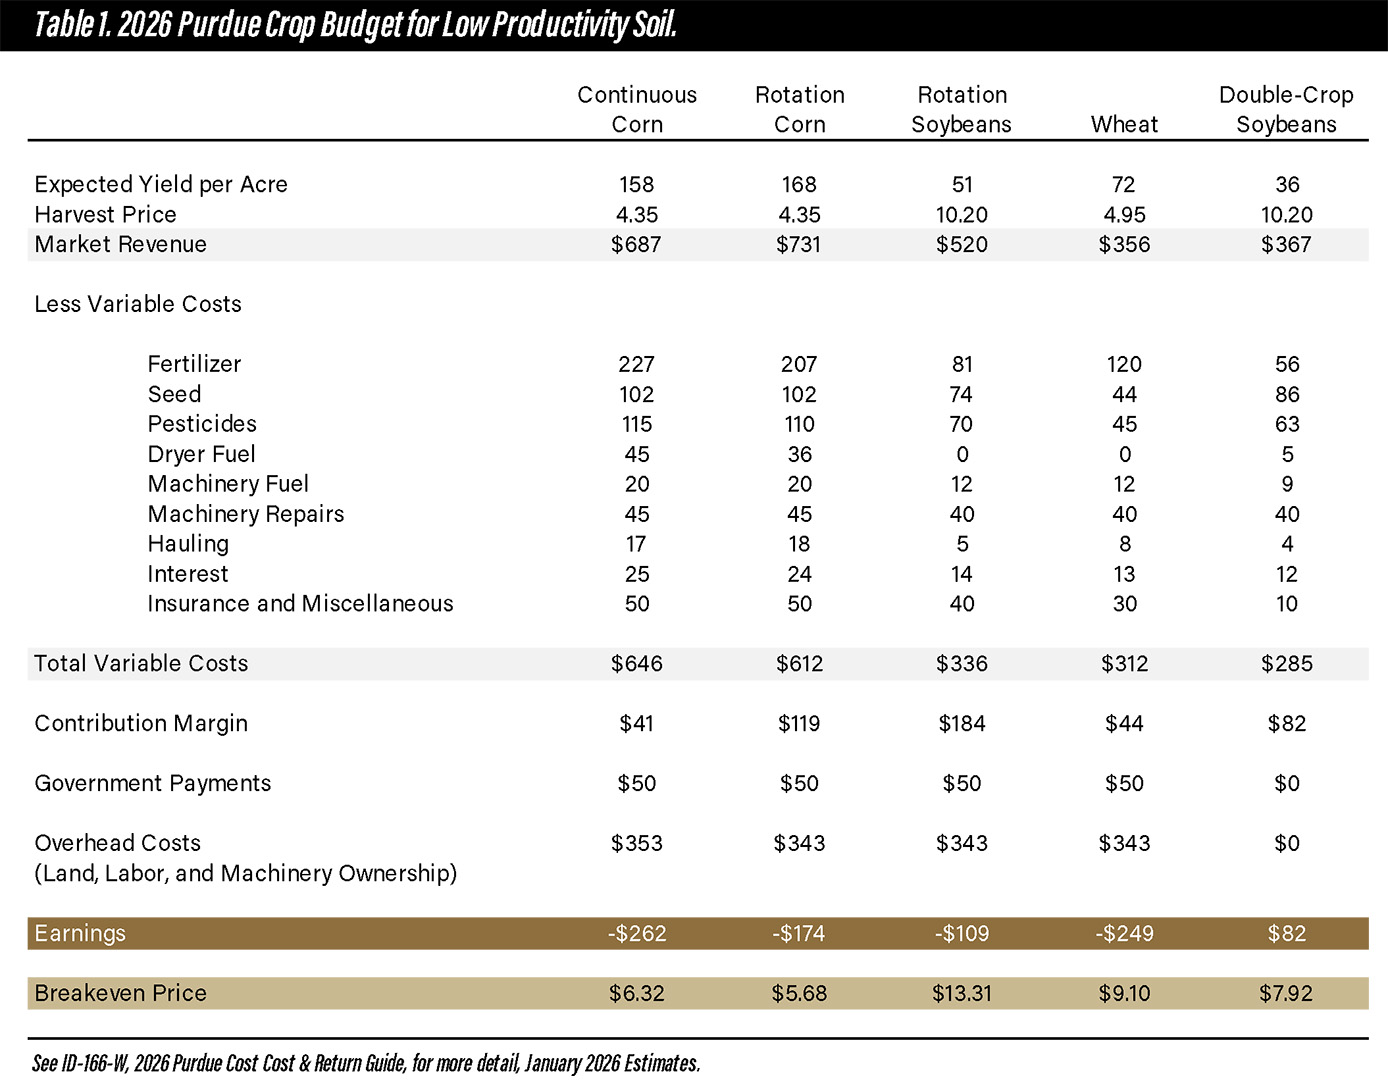
Table 1. 2026 Purdue Crop Budget for Low Productivity Soil.
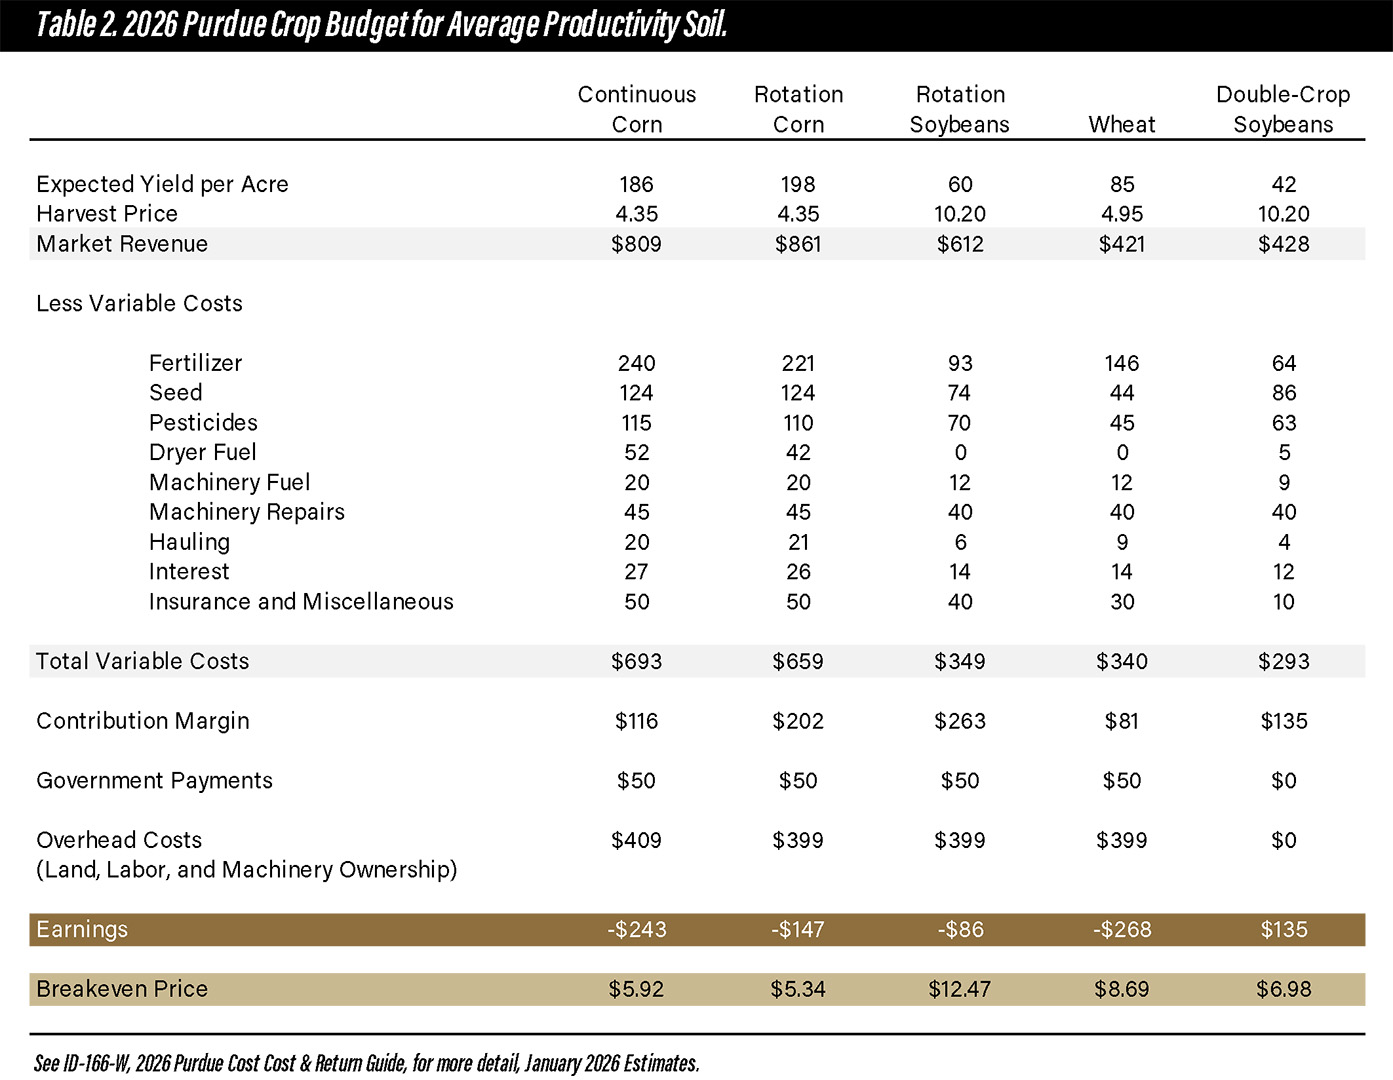
Table 2. 2026 Purdue Crop Budget for Average Productivity Soil.
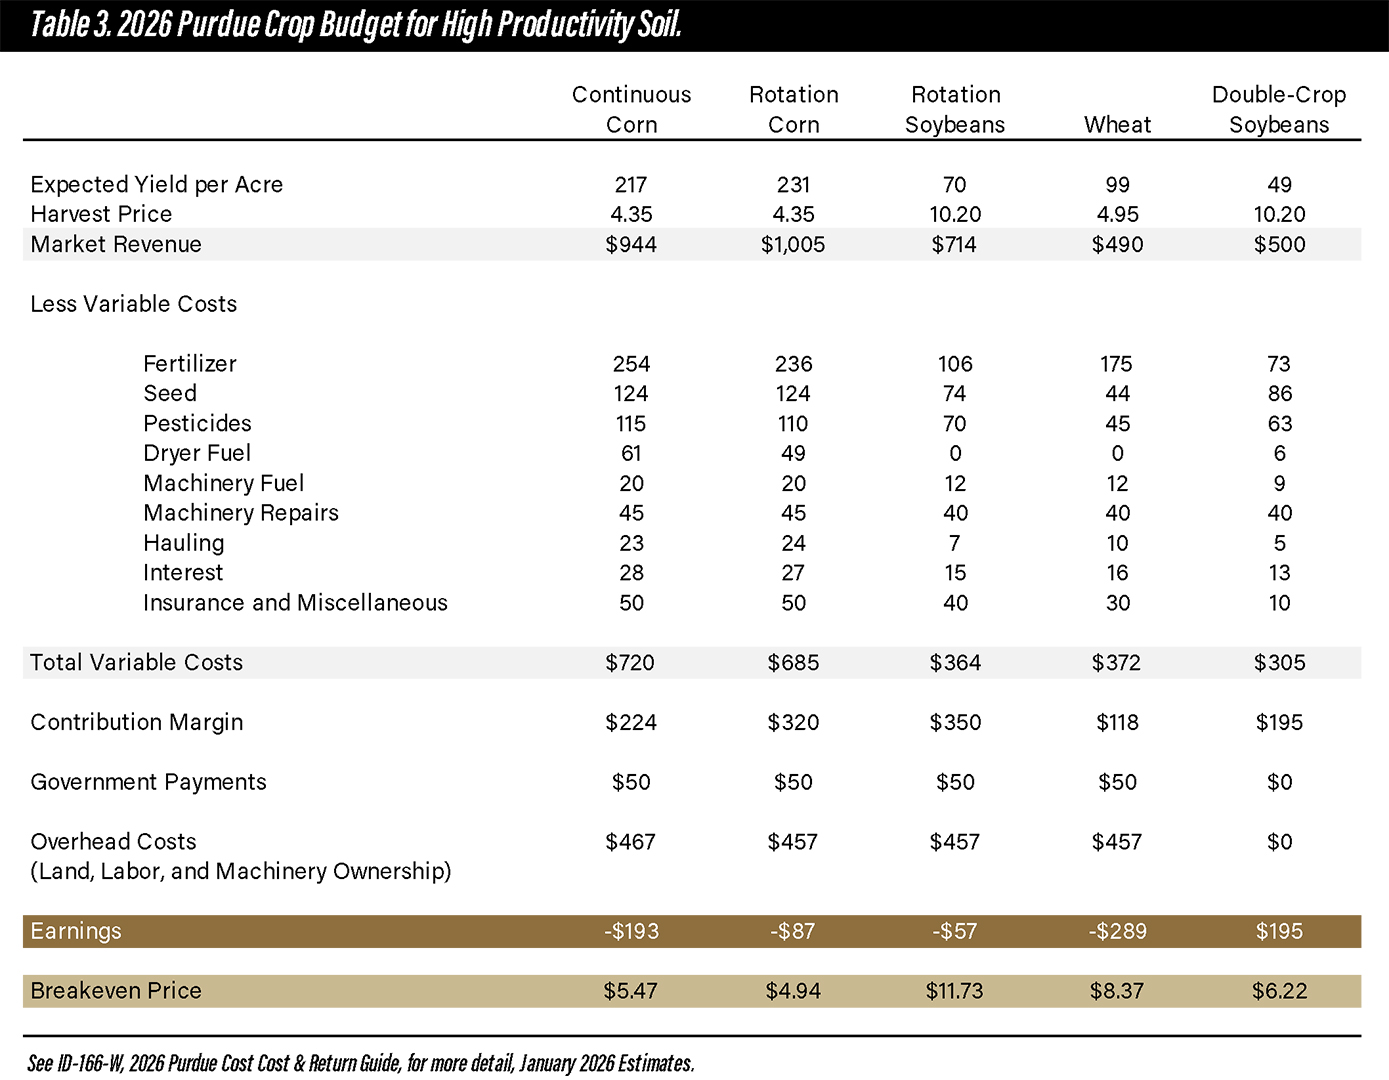
Table 3. 2026 Purdue Crop Budget for High Productivity Soil.
From 2007 to 2013, the contribution margin for rotation corn on average productivity soil was higher than the contribution margin for rotation soybeans. The average difference in the contribution margin was $38 per acre during the 2007 to 2013 period. The situation was considerably different from 2014 to 2025. The average difference in the contribution margin during this period was an advantage for soybeans of $65 per acre. The projected difference in contribution margins on average productivity soil between corn and soybeans for 2026 is $61 per acre in favor of rotation soybeans. The projected difference in contribution margins between soybeans and corn is larger on low productivity soil and smaller on high productivity soil.
Projected cost of production and breakeven prices for corn and soybeans in 2026 are very similar to those experienced in 2025. Breakeven price per bushel on average productivity soil is expected to be $5.34 for corn and $12.47 for soybeans. Breakeven prices remain elevated compared to those experienced prior to COVID-19. Projected breakeven prices for corn and soybeans are 20% and 15% higher than the corn and soybean breakeven prices in 2021.
Corn breakeven prices for 2026 for low and high productivity soils are expected to be $5.68 and $4.94 per bushel, respectively. For soybeans, 2026 breakeven prices for soybeans on low and high productivity soils are projected to be $13.31 and $11.73 per bushel, respectively.
Expected corn and soybean prices, estimated using futures prices and long-run average basis, are substantially below breakeven prices, even for high productivity soils. As a result, projected 2026 earnings are well below zero. In the long-run, earnings are approximately zero. When earnings are positive, owned assets such as machinery, buildings, and land, as well as unpaid operator labor, garner net returns above their opportunity cost (i.e., the value of the next best alternative). Negative earnings, on the other hand, indicate that owned assets and unpaid labor are receiving a net return that is below their opportunity cost.
What are the potential implications or consequences of the projected negative earnings in 2026?
First, we would expect machinery and building purchases to be lower than they would be in a year with higher earnings (e.g., 2021 and 2022). In other words, depreciation is likely to be larger than machinery and building purchases in 2026. Second, we expect cash rents to be stable or experience downward pressure. Downward pressure is particularly likely given the fact that earnings were also relatively low in 2024 and 2025.
In summary, margins are expected to be relatively tight again in 2026. Net returns for rotation soybeans are expected to be slightly higher than net returns for rotation corn. Thus, we would not expect continuous corn to be very prevalent in Indiana this year. The relatively high-cost structure along with tight margins, increases the importance of carefully scrutinizing input and crop decisions, particularly those related to cash rent negotiations. Producers are encouraged to create crop budgets and in general improve their record keeping.
![]()
![]()
![]()
![]()
![]()
TAGS:
TEAM LINKS:

RELATED RESOURCES
UPCOMING EVENTS
We are taking a short break, but please plan to join us at one of our future programs that is a little farther in the future.