March 13, 2026
Indiana and Ohio Set the Benchmark for Soybean and Corn Basis, Respectively
by Josh Strine
![]()
![]()
![]()
![]()
![]()
Local corn basis, measured at the crop reporting district (CRD) level across the Eastern Corn Belt, is similar to that of one month ago. In Illinois and Iowa, basis levels are within $0.05/bu of the third week in February. In Indiana, Illinois, and Ohio, basis has deviated slightly more, but changes remain below the historical average for this time of year. However, limited month-to-month changes do not mean volatility is absent. For example, basis in Southwest Indiana fell by $0.06/bu last week (Figure 1). This is also indicative of a broader trend of weakening basis in the region over the past week.
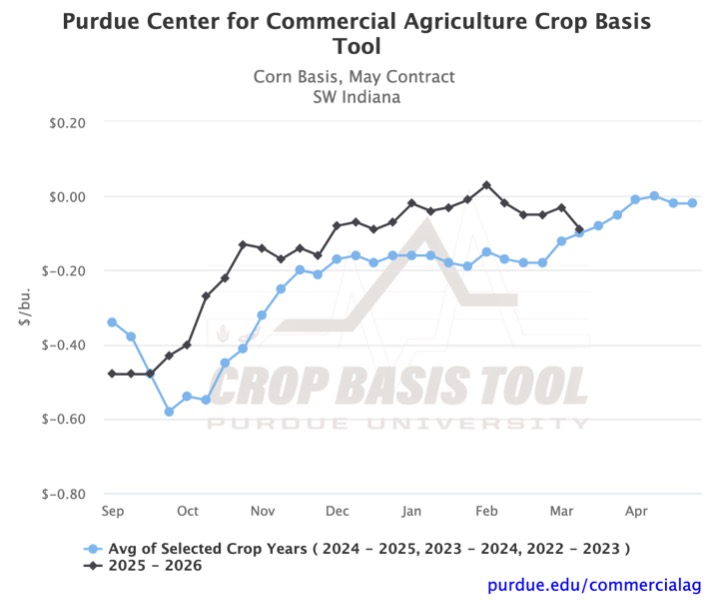
Figure 1. Corn Basis, May Contract for Southwest Indiana
While corn basis trends across the region are relatively consistent, basis levels still vary significantly. The benchmark is set in Ohio. Two CRDs in the state have positive basis levels, including Central Ohio at $0.05/bu to May futures (Figure 2). At the other end of the spectrum, the lowest local corn basis is found in Iowa, ranging from -$0.45/bu (Figure 3) to -$0.36/bu. Of the remaining three states, Indiana has the highest basis, followed by Michigan and Illinois. Interestingly, these local relationships have flipped from the historical average, in which Iowa had the highest local basis, while Ohio had some of the lowest.
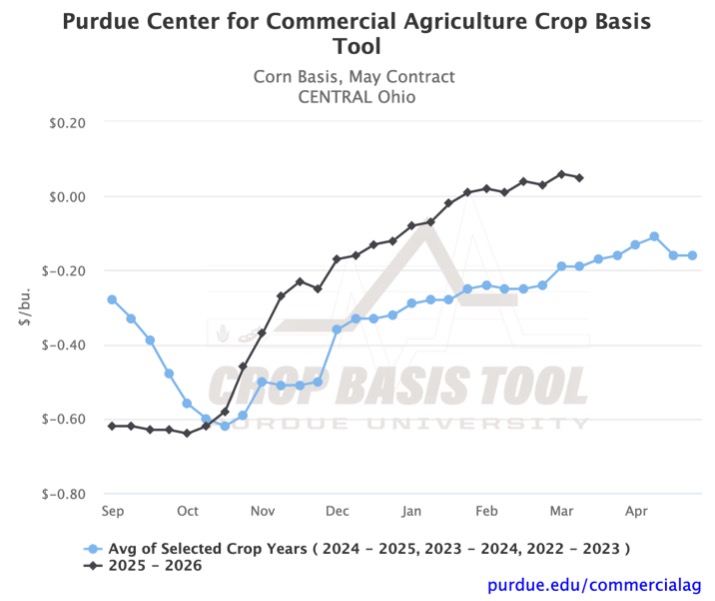
Figure 2. Corn Basis, May Contract for Central Ohio
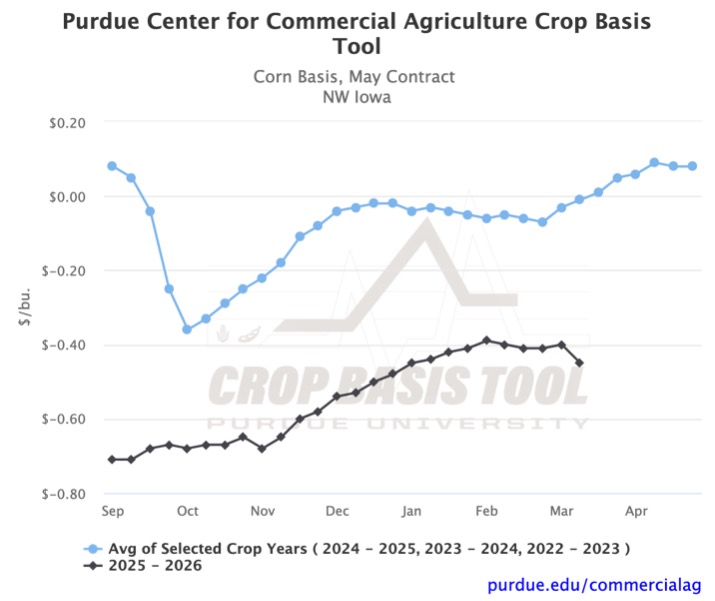
Figure 3. Corn Basis, May Contract for Northwest Iowa
While the month-to-month corn basis has stayed stable, the local soybean basis has been more volatile. This has led to the current soybean basis exceeding February’s level, with notable strengthening across the region. Over the past month, soybean basis rose by $0.13/bu in East Central Indiana and $0.10/bu in Northeastern Iowa (Figures 5 and 6). The month-over-month increase was mainly driven by a strengthening in the last week of February. However, in the past week, basis movement turned negative region-wide. Only two CRDs across the five states showed further strengthening between the first and second weeks of March.
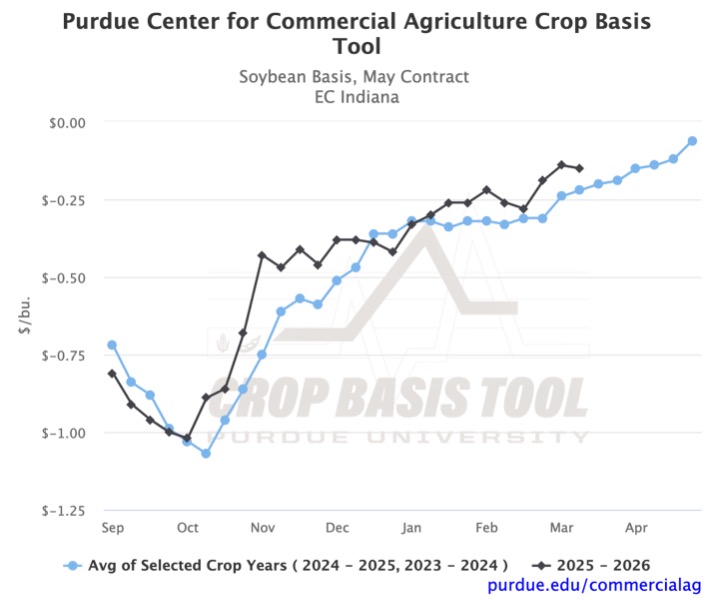
Figure 4. Soybean Basis, May Contract for East Central Indiana
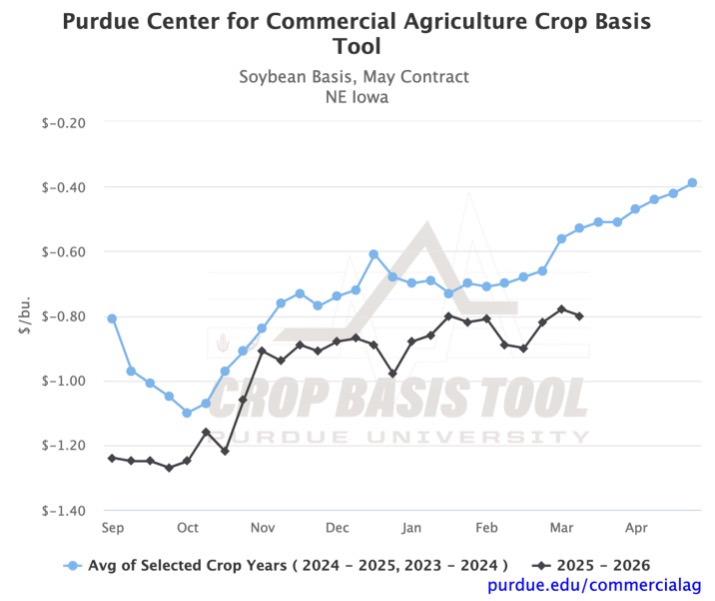
Figure 5. Soybean Basis, May Contract for Northeast Iowa
Focusing on regional variation, Iowa again posts the lowest soybean basis, ranging from -$0.74/bu to -$0.88/bu, while Indiana has the highest, ranging from -$0.15/bu to -$0.41/bu. This year’s regional variation aligns more closely with the historical average than the local corn basis. For the two-year average, Indiana also had the highest basis, followed by Ohio, Illinois, Michigan, and Iowa.
Looking ahead to next month, the historical trend suggests a basis strengthening. However, recent trends have diverged. There have been significant week-to-week decreases across the region, which are uncommon according to the graphs. This volatility is a reminder to stay up to date with your local basis levels. You can visit the Purdue Center for Commercial Agriculture’s Crop Basis Tool to do so.
![]()
![]()
![]()
![]()
![]()
TAGS:
TEAM LINKS:

RELATED RESOURCES
UPCOMING EVENTS
We are taking a short break, but please plan to join us at one of our future programs that is a little farther in the future.