April 17, 2026
Broad Strengthening Across the Eastern Corn Belt
by Josh Strine
![]()
![]()
![]()
![]()
![]()
Across the Eastern Corn Belt, corn and soybean basis has pushed upward over the past month. Across the 100 regional basis series tracked, only one weakened between the third week of March and the third week of April. While the historical average forecast an increase in basis, recent movements have broadly outpaced the projected change. Additionally, ethanol plants and soybean processors continue to offer higher prices than local elevators; however, the premiums are smaller than the historical average.
Basis strengthening broadly outpaced the historical trend since the third week of March in Illinois, Indiana, and Ohio. In Southcentral Indiana, corn basis to May futures increased by $0.02/bu over the past month to -$0.08/bu, while the historical average would have suggested a $0.01/bu decrease (Figure 1). In Central Ohio, corn basis to May futures increased by $0.04/bu over the past month, while the historical average would have suggested a $0.01/bu increase (Figure 2). More significantly, the current basis of $0.09/bu is $0.25/bu stronger than the three-year average. Notably, this is the second consecutive year that basis has been positive. In fact, corn basis in April across several regions in Ohio has been the highest in a decade over the past two years.
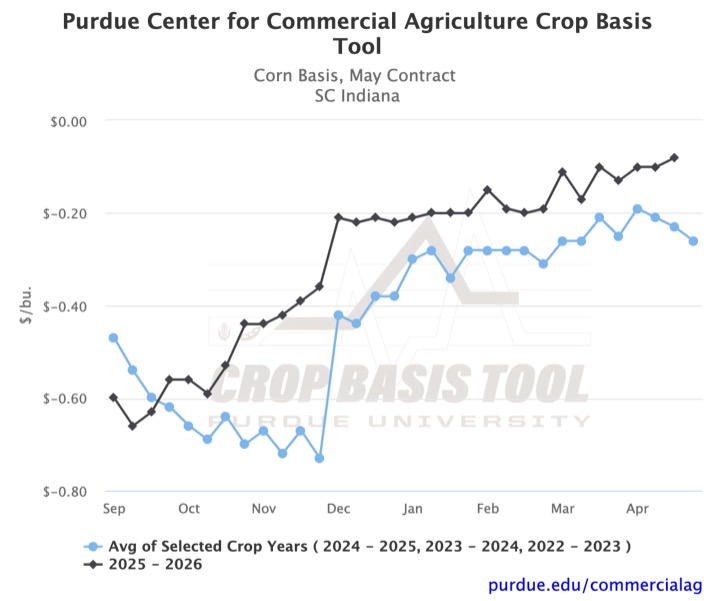
Figure 1. Corn Basis, May Contract for South Central Indiana, 2022-2025 3-year average, and 2025-2026, Purdue Crop Basis Tool
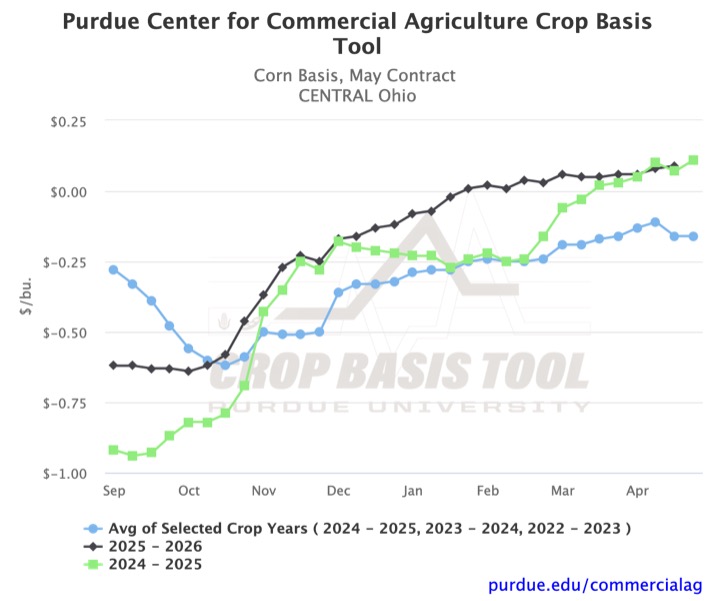
Figure 2. Corn Basis, May Contract for Central Ohio, 2022-2025 3-year average, 2025-2026, and 2024-2025, Purdue Crop Basis Tool
In Michigan and Iowa, recent corn basis trends have been more in line with the historical movement, showing more moderate strengthening. This follows the persistent pattern of the 2025-2026 marketing year in which Iowa and Michigan have consistently had the weakest corn basis levels in the region. For reference, Figure 3 shows the corn basis to May futures at the crop reporting district level. The strength of basis in Ohio and along the Ohio River is clear.
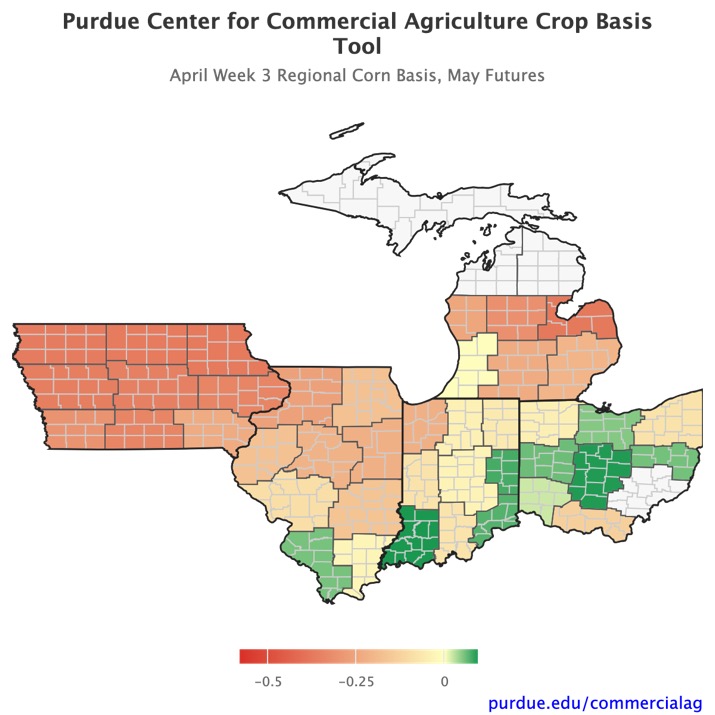
Figure 3. Regional Corn Basis for April week 3, May Futures
Soybean basis movement to May futures over the past month has been even stronger. The smallest increase was $0.05/bu in parts of Michigan (Figure 4). The largest increase was $0.30/bu in Southeast Indiana (Figure 5). In both regions, current basis is relatively close to the historical average. In most of Illinois and Indiana, current basis is near the historical averages and trending up. However, in Ohio, Michigan, and Iowa, 2025-2026 basis is significantly different from the historical average.
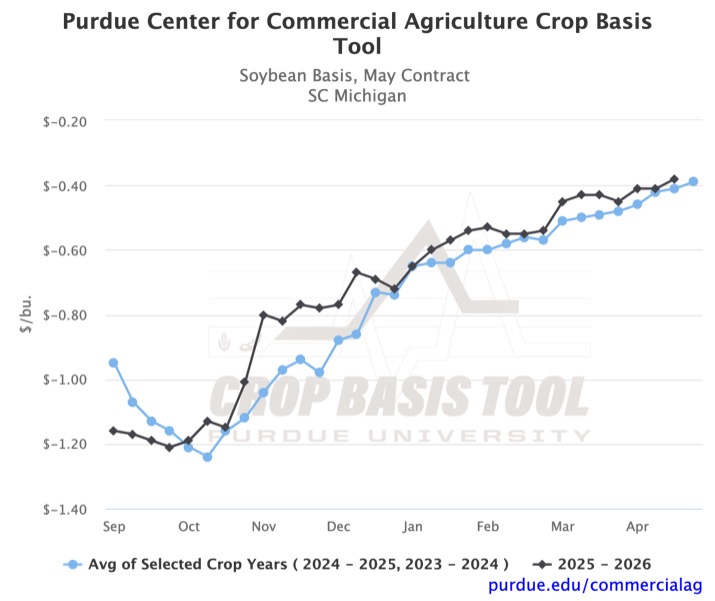
Figure 4. Soybean Basis, May Contract for South Central Michigan, 2022-2025 3-year average, and 2025-2026, Purdue Crop Basis Tool

Figure 5. Soybean Basis, May Contract for South East Indiana, 2022-2025 3-year average, Purdue Crop Basis Tool
End users, such as ethanol plants and soybean processors, continue to offer basis premiums over local elevators. However, the level of premiums has shifted from the historical average. The current state-level basis and difference from the historical average at end users are shown in Table 1. There are a few deviations from the patterns observed in local elevator basis. For example, Illinois ethanol basis is weaker than the historical average, but local basis is stable to up. This suggests the premium at ethanol plants in Illinois may be weaker this year than in recent history. Similarly, the basis premium from ethanol plants in Indiana and soybean processors in Iowa, Michigan, and Ohio is lower this year. On the other hand, basis premiums from soybean processors in Illinois and Indiana are higher this year.

Figure 6. Corn Ethanol and Soybean Processor Basis, April week 3 and the difference from Historical Average for Illinois, Indiana, Iowa, Michigan and Ohio, Purdue Crop Basis Tool
Looking ahead to next month, the historical trends suggest volatile basis movement in corn and basis strengthening in soybean to July futures across the region. The projected movement in corn basis ranges from -$0.09/bu to $0.11/bu. Historical trends suggest a strengthening of $0.02/bu to $0.28/bu in soybean basis to July futures. However, basis to July futures dropped sharply in the fourth week of May in each of the past two years. These shocks are a reminder of the unpredictability of the market and the importance of staying up to date on local market conditions. You can visit the Purdue Center for Commercial Agriculture’s Crop Basis Tool to track local basis conditions.
![]()
![]()
![]()
![]()
![]()
TAGS:
TEAM LINKS:

RELATED RESOURCES
UPCOMING EVENTS
We are taking a short break, but please plan to join us at one of our future programs that is a little farther in the future.