May 14, 2026
Basis Gains Slow as Historically Suggested Volatility Looms
by Josh Strine
![]()
![]()
![]()
![]()
![]()
Over the past three weeks, corn and soybean basis have continued to strengthen across the Eastern Corn Belt. However, gains have slowed in the past week. Broadly, basis trends are near historical movement, though regional deviations persist. Local variation is evident, with the strongest soybean basis found along Southern Illinois, Indiana, and Ohio, and the strongest corn basis in Ohio and Southern Indiana. As we look ahead to next month, the historical average suggests week-to-week volatility in soybean basis and weakening in corn basis.
Corn Basis Trends
Since the third week of April, there has been moderate strengthening of the local corn basis across the Eastern Corn Belt. In Central Indiana, basis increased by $0.10/bu (Figure 1). Most of those gains came in April and the first week of May, with only a $0.01/bu increase over the past week. This pattern of slowed strengthening, or even weakening, is consistent across the region. Overall, the basis trends are within a few cents of the historically observed movement across the region. The greatest difference occurred in South-Central Ohio, where corn basis increased by $0.23/bu over the past three weeks, outpacing the historically suggested $0.03/bu weakening (Figure 2).
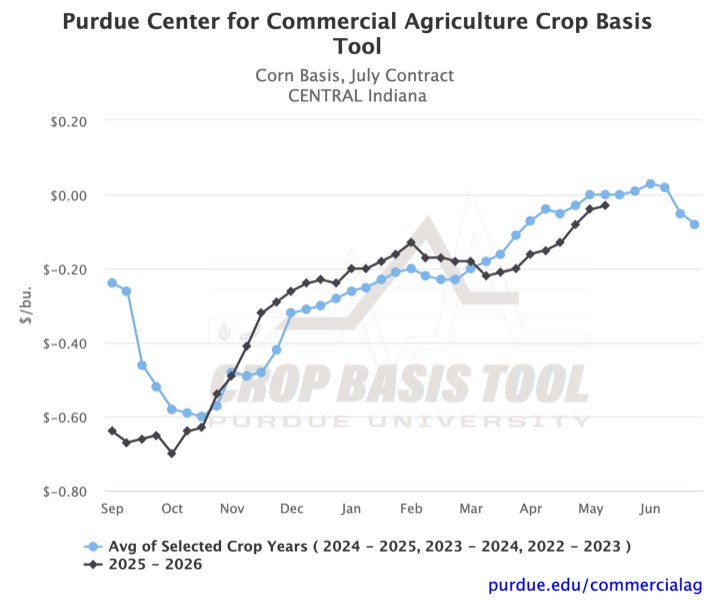
Figure 1. Corn Basis, July Contract for Central Indiana
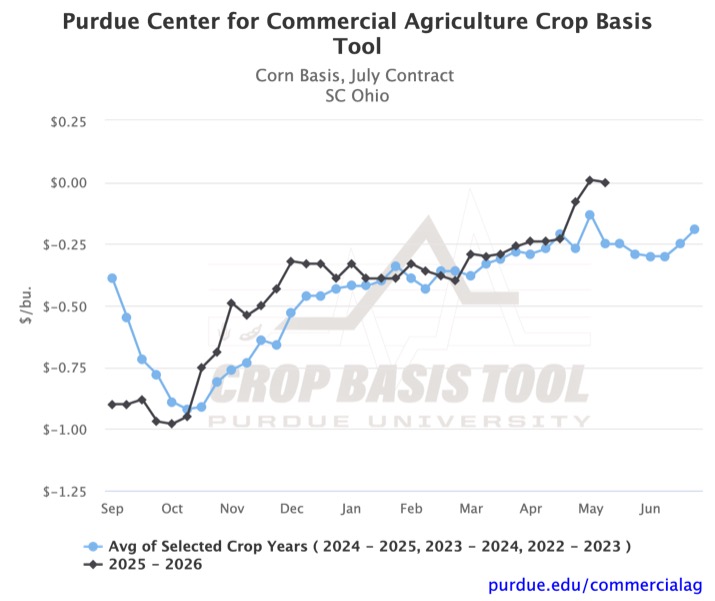
Figure 2. Corn Basis, July Contract for South Central Ohio
Local variation remains large across the region. Local corn basis is strongest in Ohio and Southern Indiana (Figure 3). Several crop reporting districts have positive basis as high as $0.09/bu (Southwest Indiana). The weakest local basis is -$0.43/bu in Iowa. While trends appear to follow historical movement across the region, local variation does not. In Iowa, Illinois, and Indiana, local basis levels are well below the three-year average. The deficit is as much as $0.49/bu in Iowa and $0.25/bu in Illinois. While Michigan has among the lowest basis levels this year, they are still above the historical average.
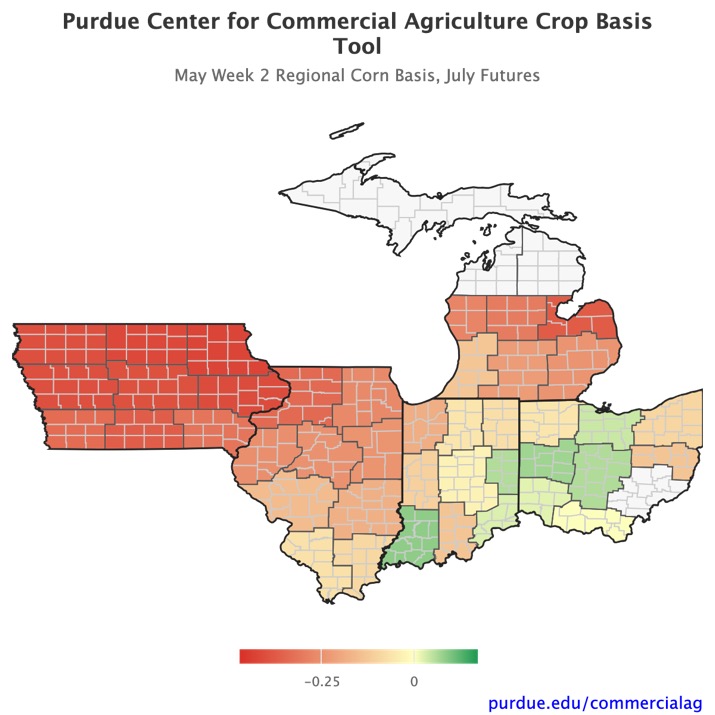
Figure 3. May Week 2 Regional Corn Basis, July Contract
Soybean Basis Trends
Soybean basis trends over the past three weeks followed trends in corn. There were moderate to strong gains between the end of April and the first week of May. However, strengthening has stalled in the past week. In Central Indiana, soybean basis increased by $0.06/bu in the last week of April and $0.05/bu in the first week of May, with no change in the second week of May (Figure 4). Basis movement in this district has followed the historical trend closely since March. While most basis strengthening has stalled over the past week, that is not the case in Iowa. In Central Iowa, soybean basis increased by $0.06/bu in the last week of April, $0.05/bu in the first week of May, and $0.04/bu in the second week of May (Figure 5).
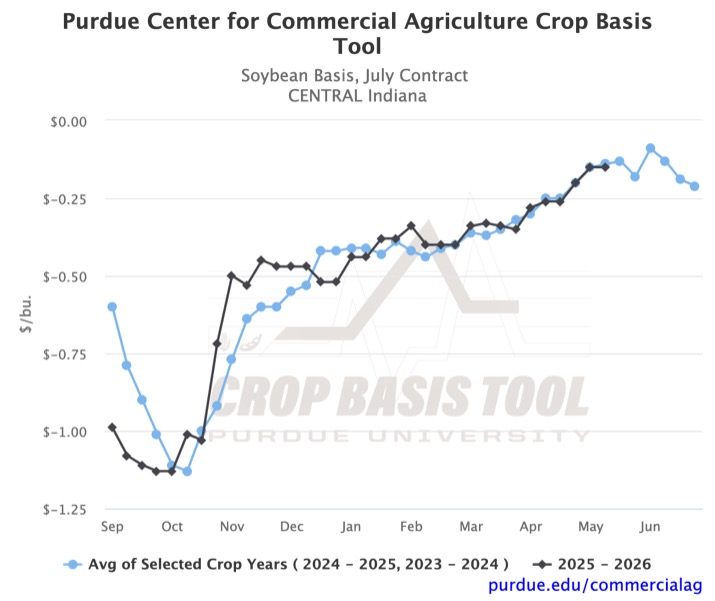
Figure 4. Soybean Basis, July Contract for Central Indiana
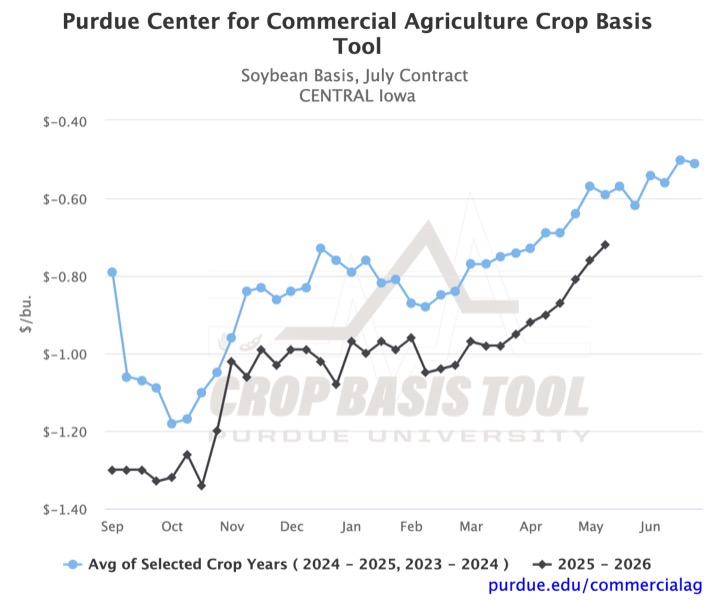
Figure 5. Soybean Basis, July Contract for Central Iowa
As of Wednesday, May 13th, the strongest soybean basis can be found in Southern Illinois, Indiana, and Ohio (Figure 6). In Southeast Indiana, the basis was $0.02/bu. The weakest soybean basis levels are in Iowa, ranging from -$0.72/bu to -$0.58/bu. Broadly, these are the lowest basis levels in Iowa since 2019. Outside of Iowa, local basis levels are as low as -$0.52/bu in East-Central Michigan and -$0.50/bu in Northwest Illinois.
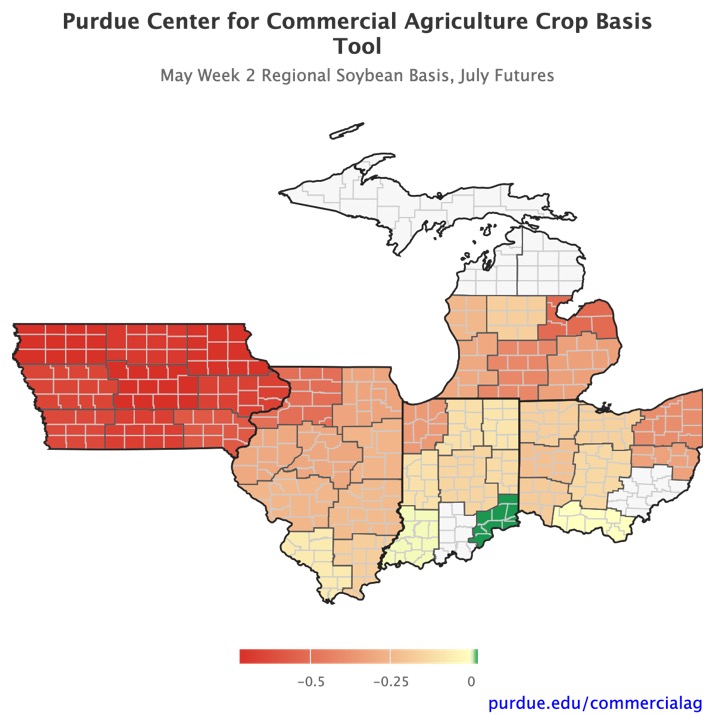
Figure 6. May Week 2 Regional Soybean Basis, July Futures
Looking ahead
Local corn trends indicate possible strengthening through the end of May; however, by the second and third weeks of June, basis has historically begun to decrease. Michigan is the only state where the historical trend suggests basis will be higher in the third week of June than it is today. Local soybean trends suggest more week-to-week volatility over the next month. Across all regions, the historical average points to a $0.01/bu to $0.08/bu weakening in the last week of May. However, on average, a $0.02/bu to $0.17/bu strengthening occurs in the first week of June. Large swings and weekly volatility remind us that it is difficult to time the market, and it is important to stay up to date on local price dynamics as they are included in your marketing strategy. You can visit the Purdue Center for Commercial Agriculture’s Crop Basis Tool to track local basis conditions.
![]()
![]()
![]()
![]()
![]()
TAGS:
TEAM LINKS:

RELATED RESOURCES
UPCOMING EVENTS
We are taking a short break, but please plan to join us at one of our future programs that is a little farther in the future.