August 26, 2020
Components of an Accrual Farm Income Statement
by Michael Langemeier
![]()
![]()
![]()
![]()
![]()
This article is part of a series of financial management articles that examine financial statements and financial analysis. In this article, the components of an income statement for a case farm in west central Indiana for 2019 are illustrated and discussed.
An income statement measures the success of a business for a period of time. The most common period of time used for a farm business is a calendar year. However, many farms use a fiscal year as their tax year and use a fiscal year to measure accrual income. An accrual income statement contains one of the most important financial measures used by farms, net farm income. Because this measure is accrual, it measures the actual performance of a farm during the year.
Major categories typically highlighted in an income statement include gross revenue, value of farm production, cash operating expenses, expense inventory adjustment, depreciation, interest expense, and net farm income. Value of farm production and net farm income are used extensively in the computation of financial ratios. Value of farm production is computed by summing accrual gross revenue from crops, accrual gross revenue from livestock, gain or loss on sale of breeding livestock, agricultural program payments, crop insurance proceeds, and other income, and subtracting livestock purchases, and cost of purchased grain and feed. Value of farm production is a measure of “gross income”. Net farm income is computed by subtracting total expense from value of farm production. Due to the inclusion of inventory changes from the beginning to the end of the year and depreciation in the computation of net farm income, total net cash farm income does not equal net farm income. Given recent crop price volatility, the difference between these two items (total net cash farm income and net farm income) can be quite wide for individual farms. Tax management can also contribute to differences between these two measures.
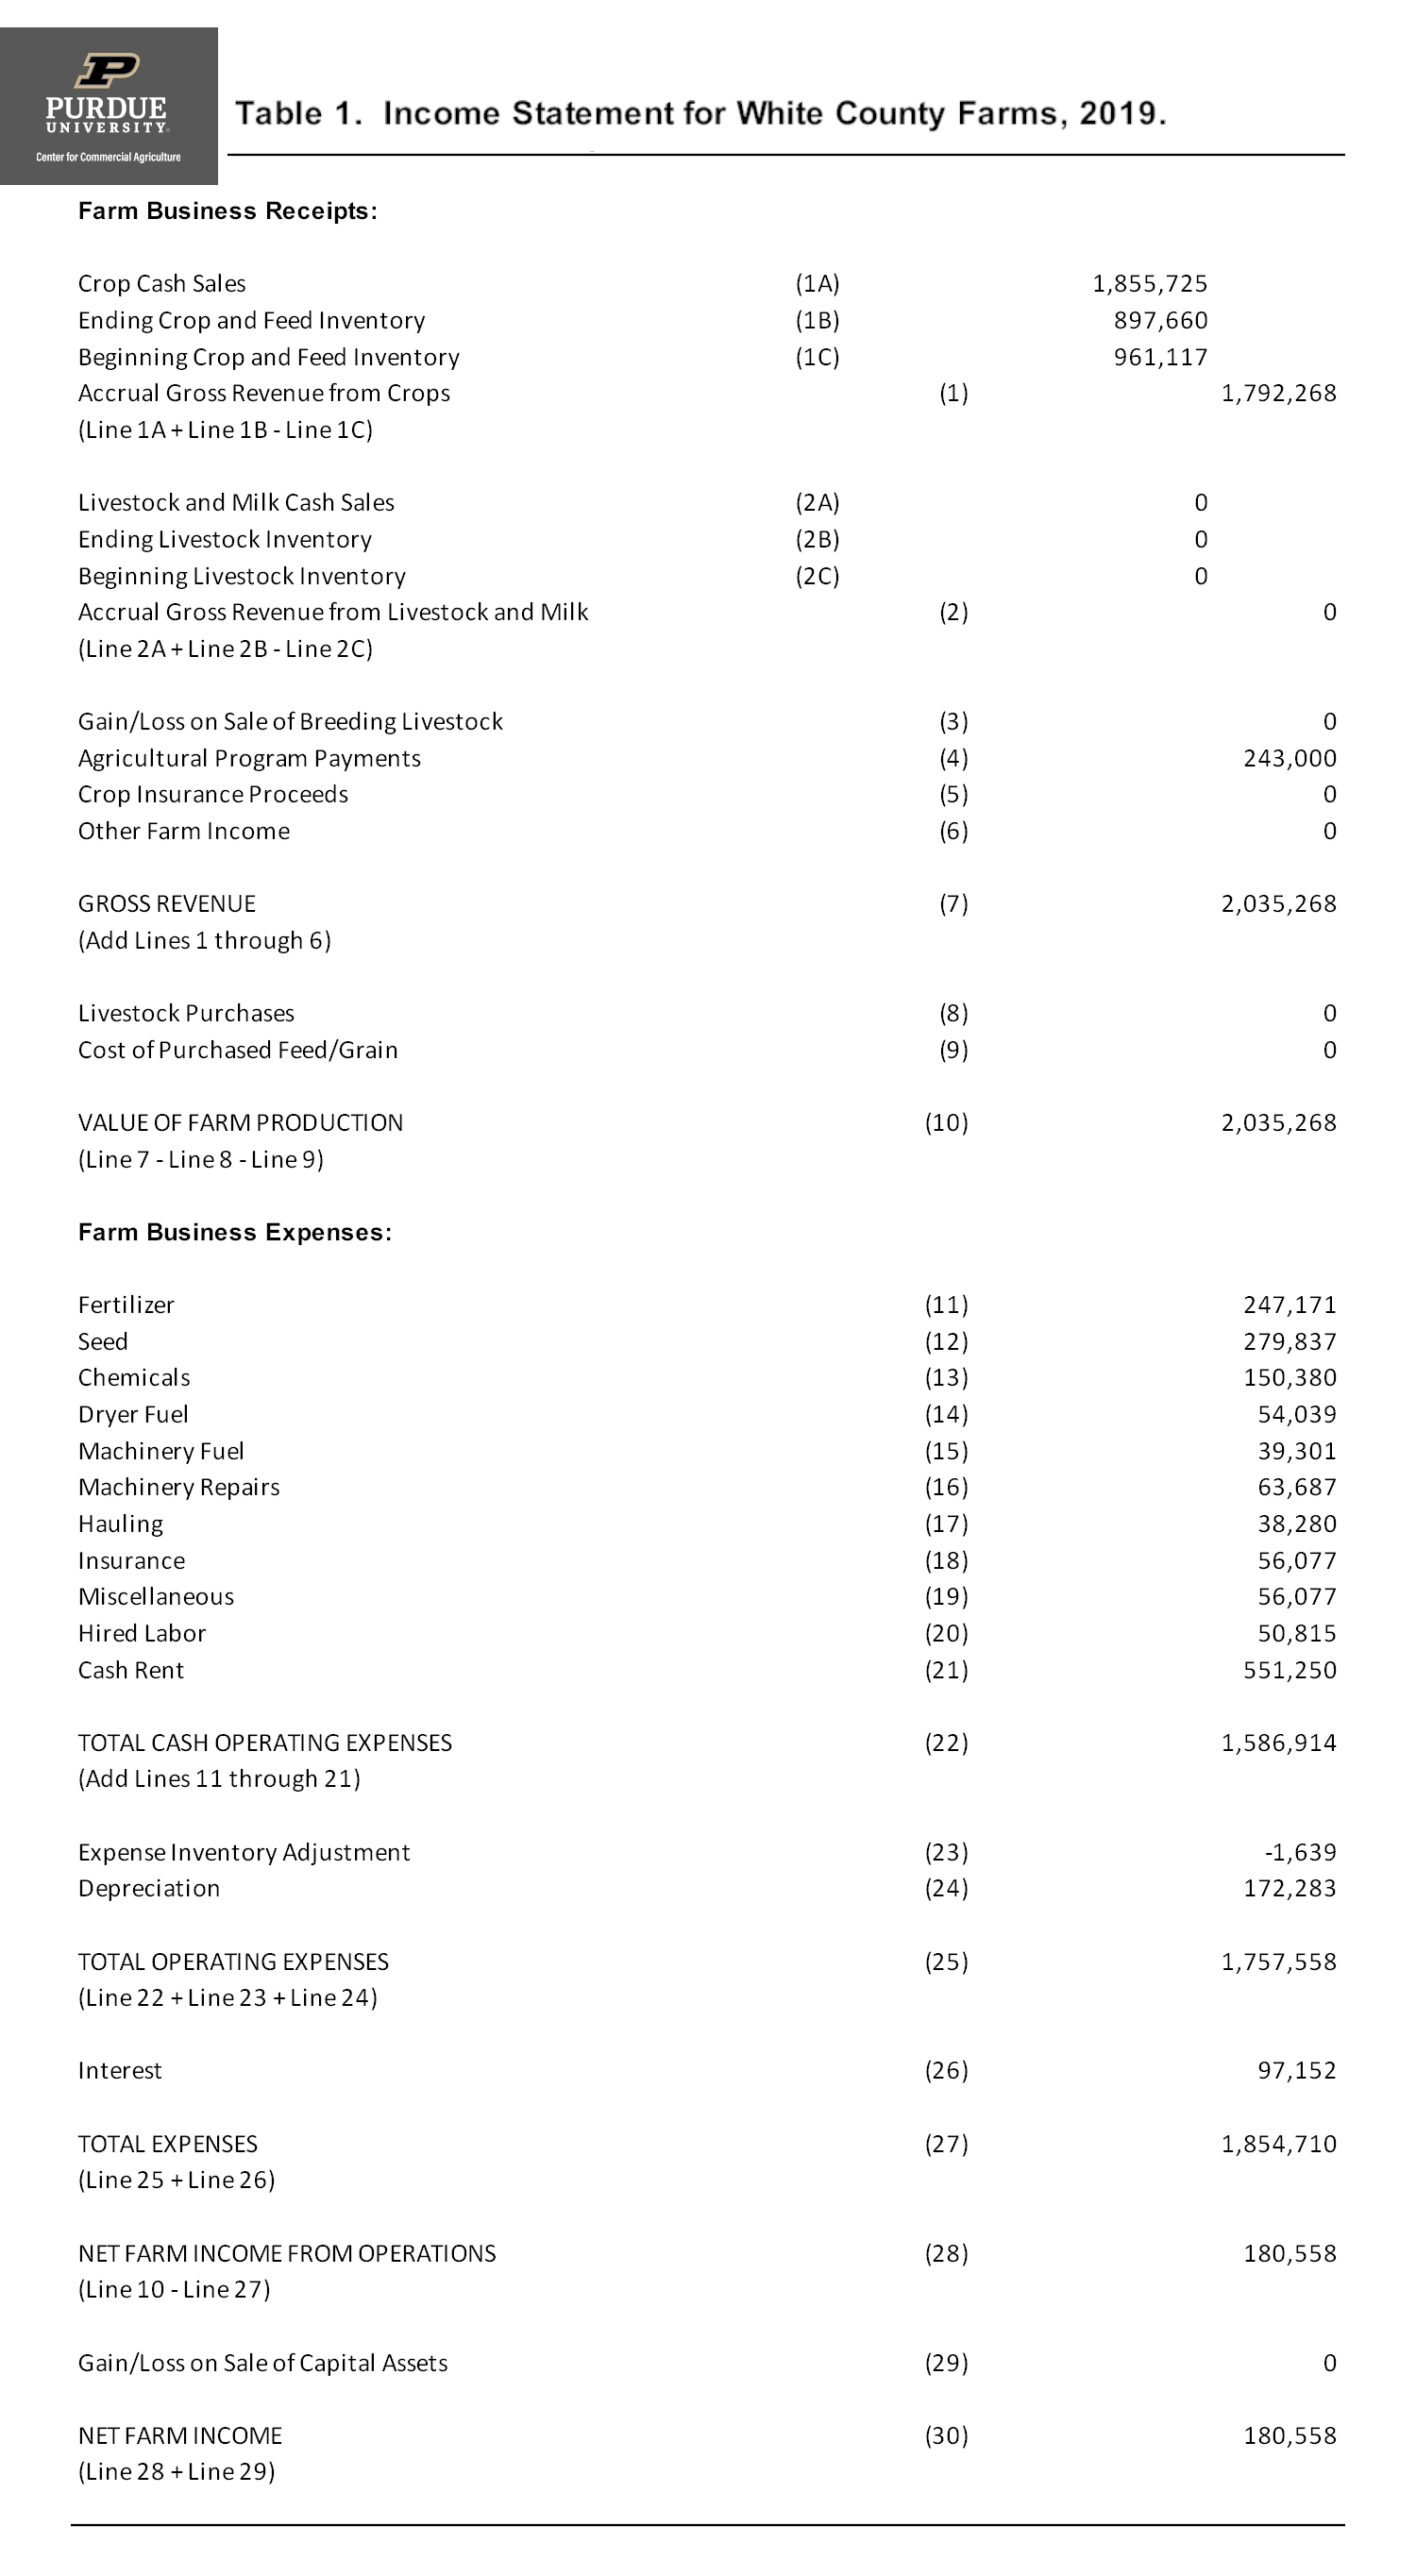
Table 1. Income Statement for White County Farms, 2019.
Table 1 illustrates an income statement for a case farm in west central Indiana for 2019. This case farm produces corn and soybeans so livestock income, purchases, and expenses are zero. The case farm sells 50 percent of the corn and soybean crops before the end of the year and the remaining portion after the first year. Thus, part of the cash crop sales for 2019 represent the sale of the 2018 corn and soybean crops. The beginning and ending crop and feed inventories, which are reported in the balance sheet for the farm, represent corn and soybean inventories at the beginning and end of 2019. Crop yields for corn and soybeans in 2019 were 3.4 percent and 6.5 percent below trend yields, respectively. Government payments reflect participation in the ARC-CO program and market facilitation payments for corn and soybeans. The case farm did not receive crop insurance indemnity payments for corn or soybeans in 2019.
Gross revenue and value of farm production for the case farm was $2,035,268. Note that depreciation and interest are listed as separate expenses below total cash operating expenses. This layout makes it easier to compute the depreciation and interest expense ratios which are discussed in another article in this series. The expense inventory adjustment considers inventories of fertilizer and supplies at the beginning and end of 2019. Subtracting total expenses from value of farm production yields a net farm income of $180,558. This amount can be used to cover family living withdrawals, pay taxes, reduce debt, and/or make capital asset purchases. Because the case farm only produces crops, it is useful to also express net farm income on a per acre basis. Net farm income per acre was approximately $60 in 2019.
It is important to note that two expenses that are typically discussed by economists are not found in table 1. Specifically, the opportunity costs on family and operator labor, and equity invested in the business are not included. Income statements typically do not contain opportunity costs. However, these costs are an integral part of the computation of some financial measures. The opportunity cost for family and operator labor for the case farm is $84,340. The case farm has substantial equity invested in the farm. Using a long-term interest rate, the opportunity cost on this equity is $471,002.
The information in the income statement in table 1 is used in other articles in this series to compute profitability and financial efficiency measures such as the operating profit margin, rate of return on farm assets, rate of return on farm equity, asset turnover ratio, and expense ratios. Without an income statement, it is very difficult to compute these key performance measures.
![]()
![]()
![]()
![]()
![]()
TEAM LINKS:

PART OF A SERIES:

RELATED RESOURCES
UPCOMING EVENTS
We are taking a short break, but please plan to join us at one of our future programs that is a little farther in the future.