August 26, 2020
Market Value Balance Sheet and Analysis
by Michael Langemeier
![]()
![]()
![]()
![]()
![]()
This article is one of a series of financial management articles that examine financial statements and financial analysis. In this article, the components of market value balance sheet and liquidity and solvency ratios are illustrated and described. Before illustrating an example of a market value balance sheet, it is important to define terms. A balance sheet represents a systematic organization of everything owned and owed by a farm at a given point in time. A balance sheet shows the financial position of the farm. Depending on the type of balance sheet, it may also show the liquidation values of the assets. A cost-based balance sheet shows the initial cost of the assets plus improvements minus depreciation. A cost-based balance sheet provides a more accurate picture of actual performance of invested capital and is critical to the examination of changes in net worth or owner equity. A market value balance sheet estimates asset values using current prices for similar assets. The market value balance sheet is relatively easy to derive, more comparable across farms, includes opportunity cost, and often required by lenders. The market value balance sheet allows us to examine the liquidation values of the assets. However, it is important to note that the change in owner equity for a market value balance sheet is computed by adding capital gains to retained earnings. Because it contains both of these elements, it is harder to use a market value balance sheet to examine retained earnings and changes in net worth over time.
Table 1 contains an example of a market value balance sheet for a case farm in west central Indiana for 2019. Notice that there are three columns in table 1. The first column contains values for the beginning of 2019. The second column contains values for the end of 2019. The third column presents an average of the values from the first two columns. Average values are often used to compute financial ratios and are thus illustrated in table 1.
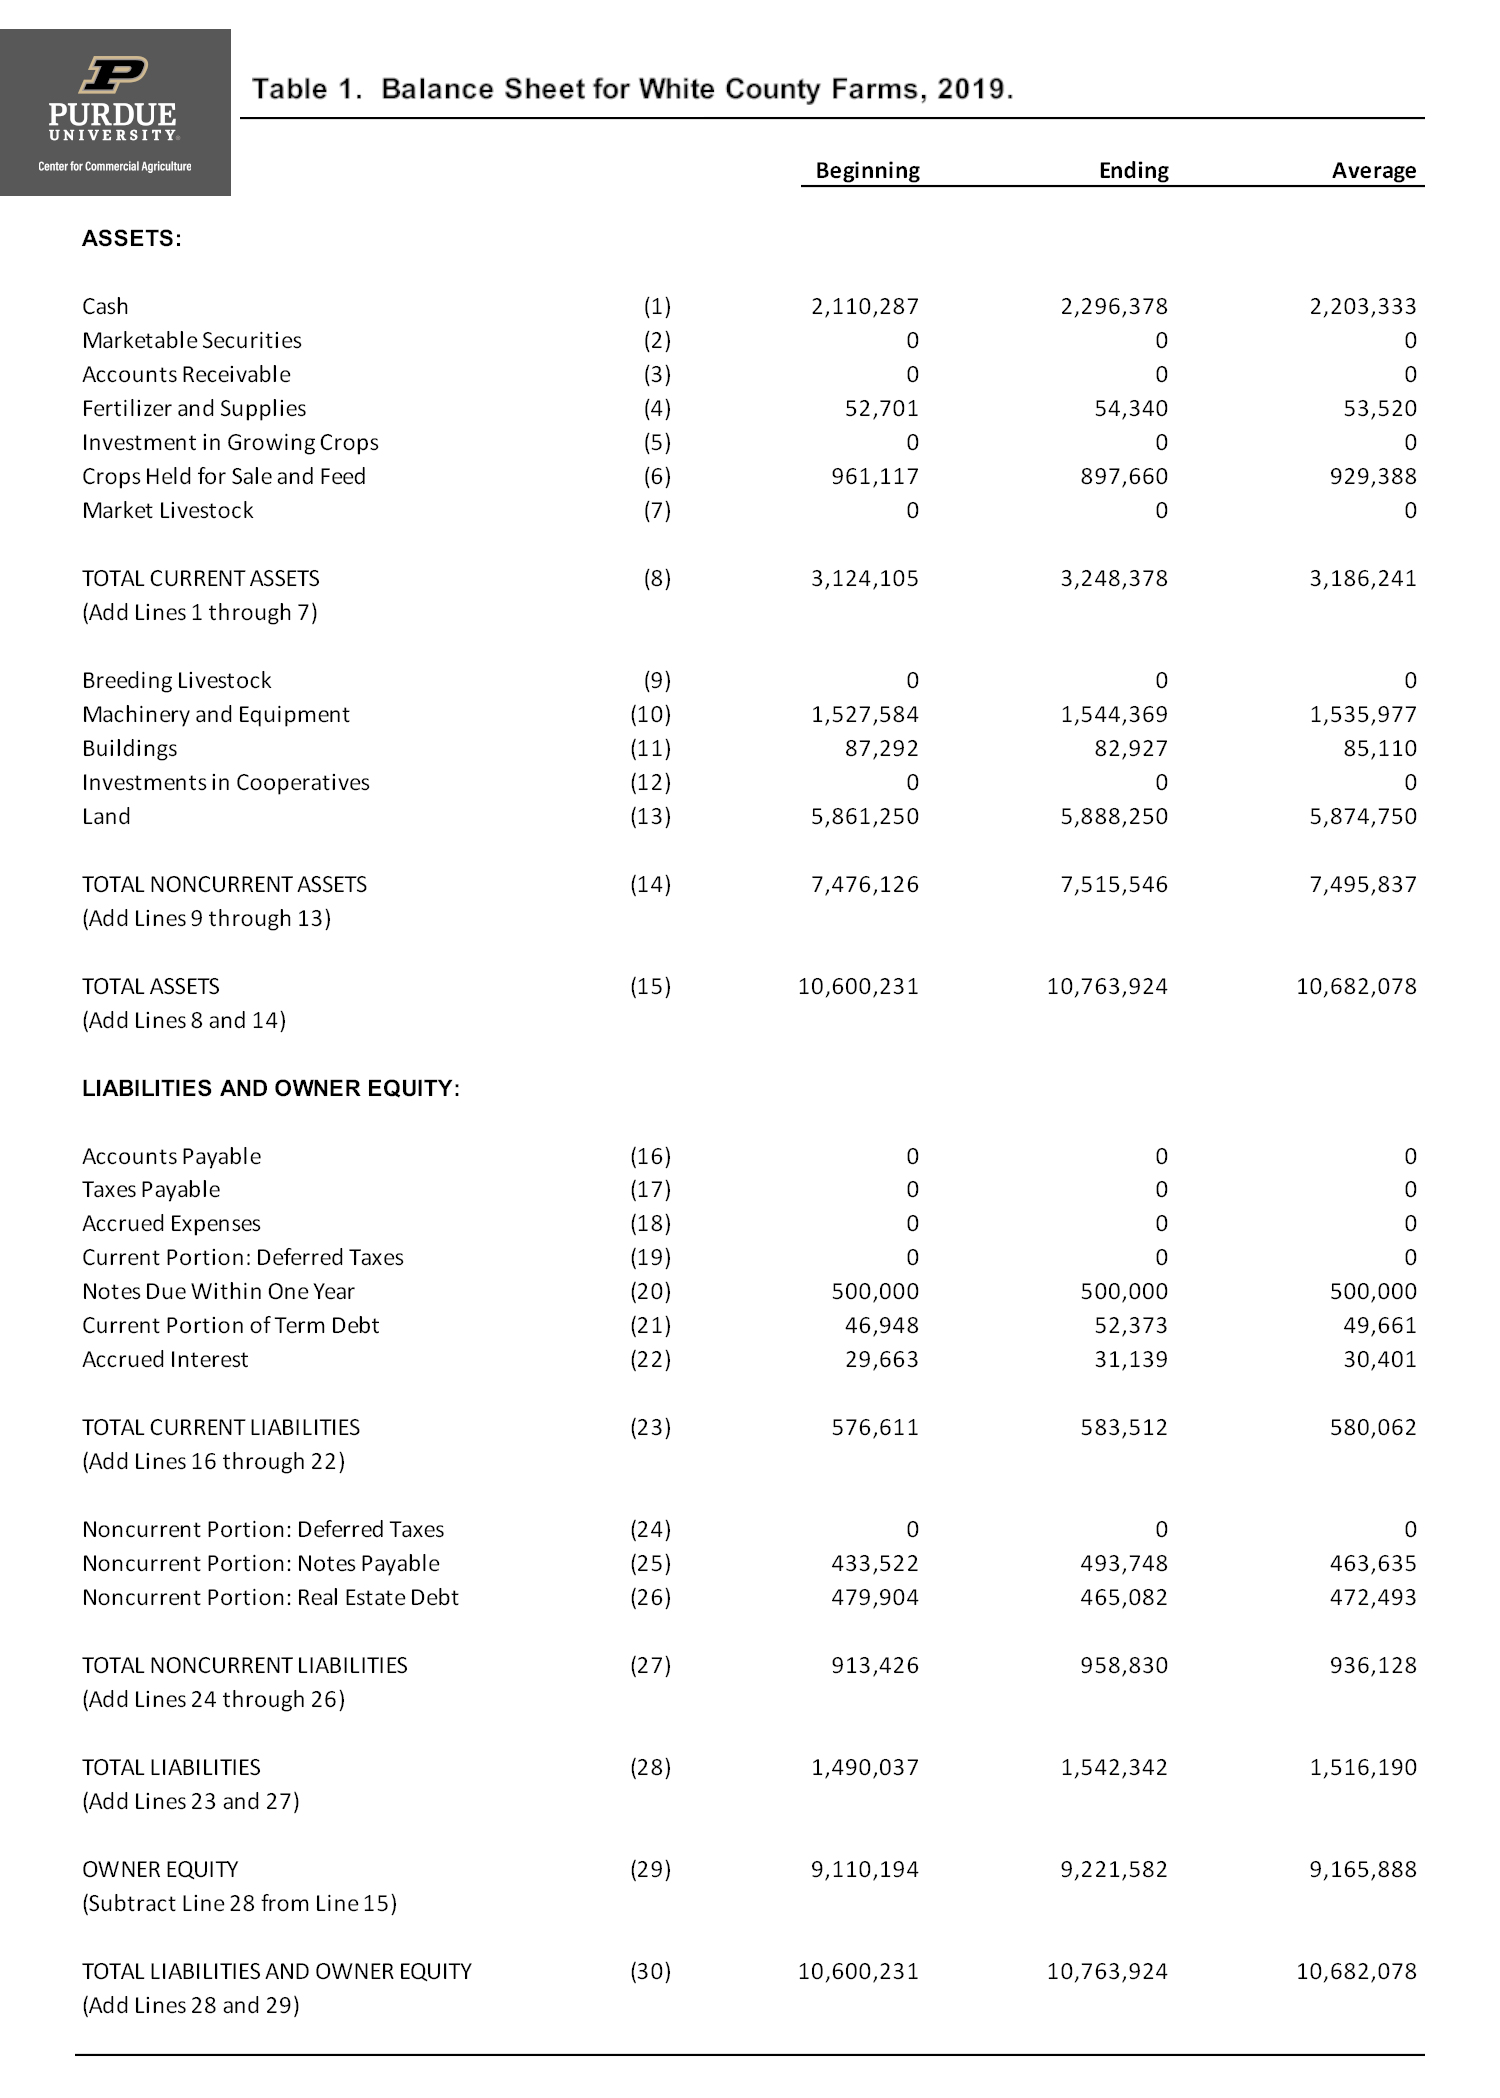
Table 1. Balance Sheet for White County Farms, 2019.
Current assets are valued using values at the beginning and end of the year. Important current assets for this farm include cash, fertilizer and supplies, and crops held for sale. This farm sells a portion of their crops in the fall and remainder of their crops in the spring. The farm’s marketing plan or strategy results in large crop inventories at the end of the year. If all of the crops were sold in the fall, the ending inventories for crops held for sale would of course be zero. Machinery, equipment, and building values are computed using original purchase prices and economic depreciation. This method comes closer to capturing the current market value of these assets than using tax depreciation rates. If good estimates were available, it would be even more appropriate to use market values at the beginning and end of the year for the machinery, equipment, and building values in table 1. This case farm has 3000 acres, of which 750 acres are owned. Land is valued using the Purdue Farmland Value Survey results. Total assets increased $163,693 or approximately 1.5 percent, from the beginning to the end of the year. Approximately 24 percent of the increase in total assets resulted from an increase in noncurrent assets (e.g., machinery, buildings, and land). The remaining portion of the increase was due to an increase in current assets. Total liabilities increased $52,305 or 3.5 percent from the beginning to the end of the year. Due to increases in land values and positive retained earnings (net farm income minus operator labor and income taxes), owner equity increased from $9,110,194 to $9,221,582, or approximately 1.2 percent in 2019. As is noted above, it is difficult to disentangle the impacts of retained earnings and capital gains using a market value balance sheet. It is important to attempt to disentangle the respective impacts of retaining earnings and capital gains to more fully understand the profitability and viability of the farm. This task will be left to another article.
When comparing balance sheets across farms of varying sizes, it is often useful to use percentages rather than actual dollars to illustrate the relative importance of various assets and liabilities. Table 2 presents a common size balance sheet for the case farm. Current assets represent approximately 30.2 percent of total assets for the case farm. Land, representing 54.7 percent of total assets, comprises by far the largest percentage of total assets. As is true with many farms, changes in land values have a major impact on asset values for this farm. Total liabilities represent approximately 14.3 percent of total liabilities and owner equity or total assets.

Table 2. Common Balance Sheet for White County Farms, 2019.
The balance sheet in table 1 was used to compute the liquidity and solvency ratios found in table 3. Liquidity measures the ability of a business to meet financial obligations as they come due in the ordinary course of business, without disrupting the normal operations of the business. Commonly used liquidity ratios include the current ratio, working capital, working capital to gross revenue, working capital to total expense, and working capital per crop acre. The current ratio is computed by dividing current assets by current liabilities. Using ending balance sheet values, the current ratio for the case farm is 5.57, which is well above 2, a commonly used benchmark. Working capital is computed by subtracting current liabilities from current assets. Working capital, using ending balance sheet values, is $2,664,866. It is difficult to compare working capital values across farms. For this reason, the working capital to gross revenue ratio and the working capital to total expense ratio are often used. For the case farm, the working capital to gross revenue ratio and the working capital to total expense ratios were 131 percent and 144 percent, respectively, indicating that the farm has a strong liquidity position. Working capital can also be expressed as a proportion of crop acres. For the case farm, working capital per crop acre was approximately $888.
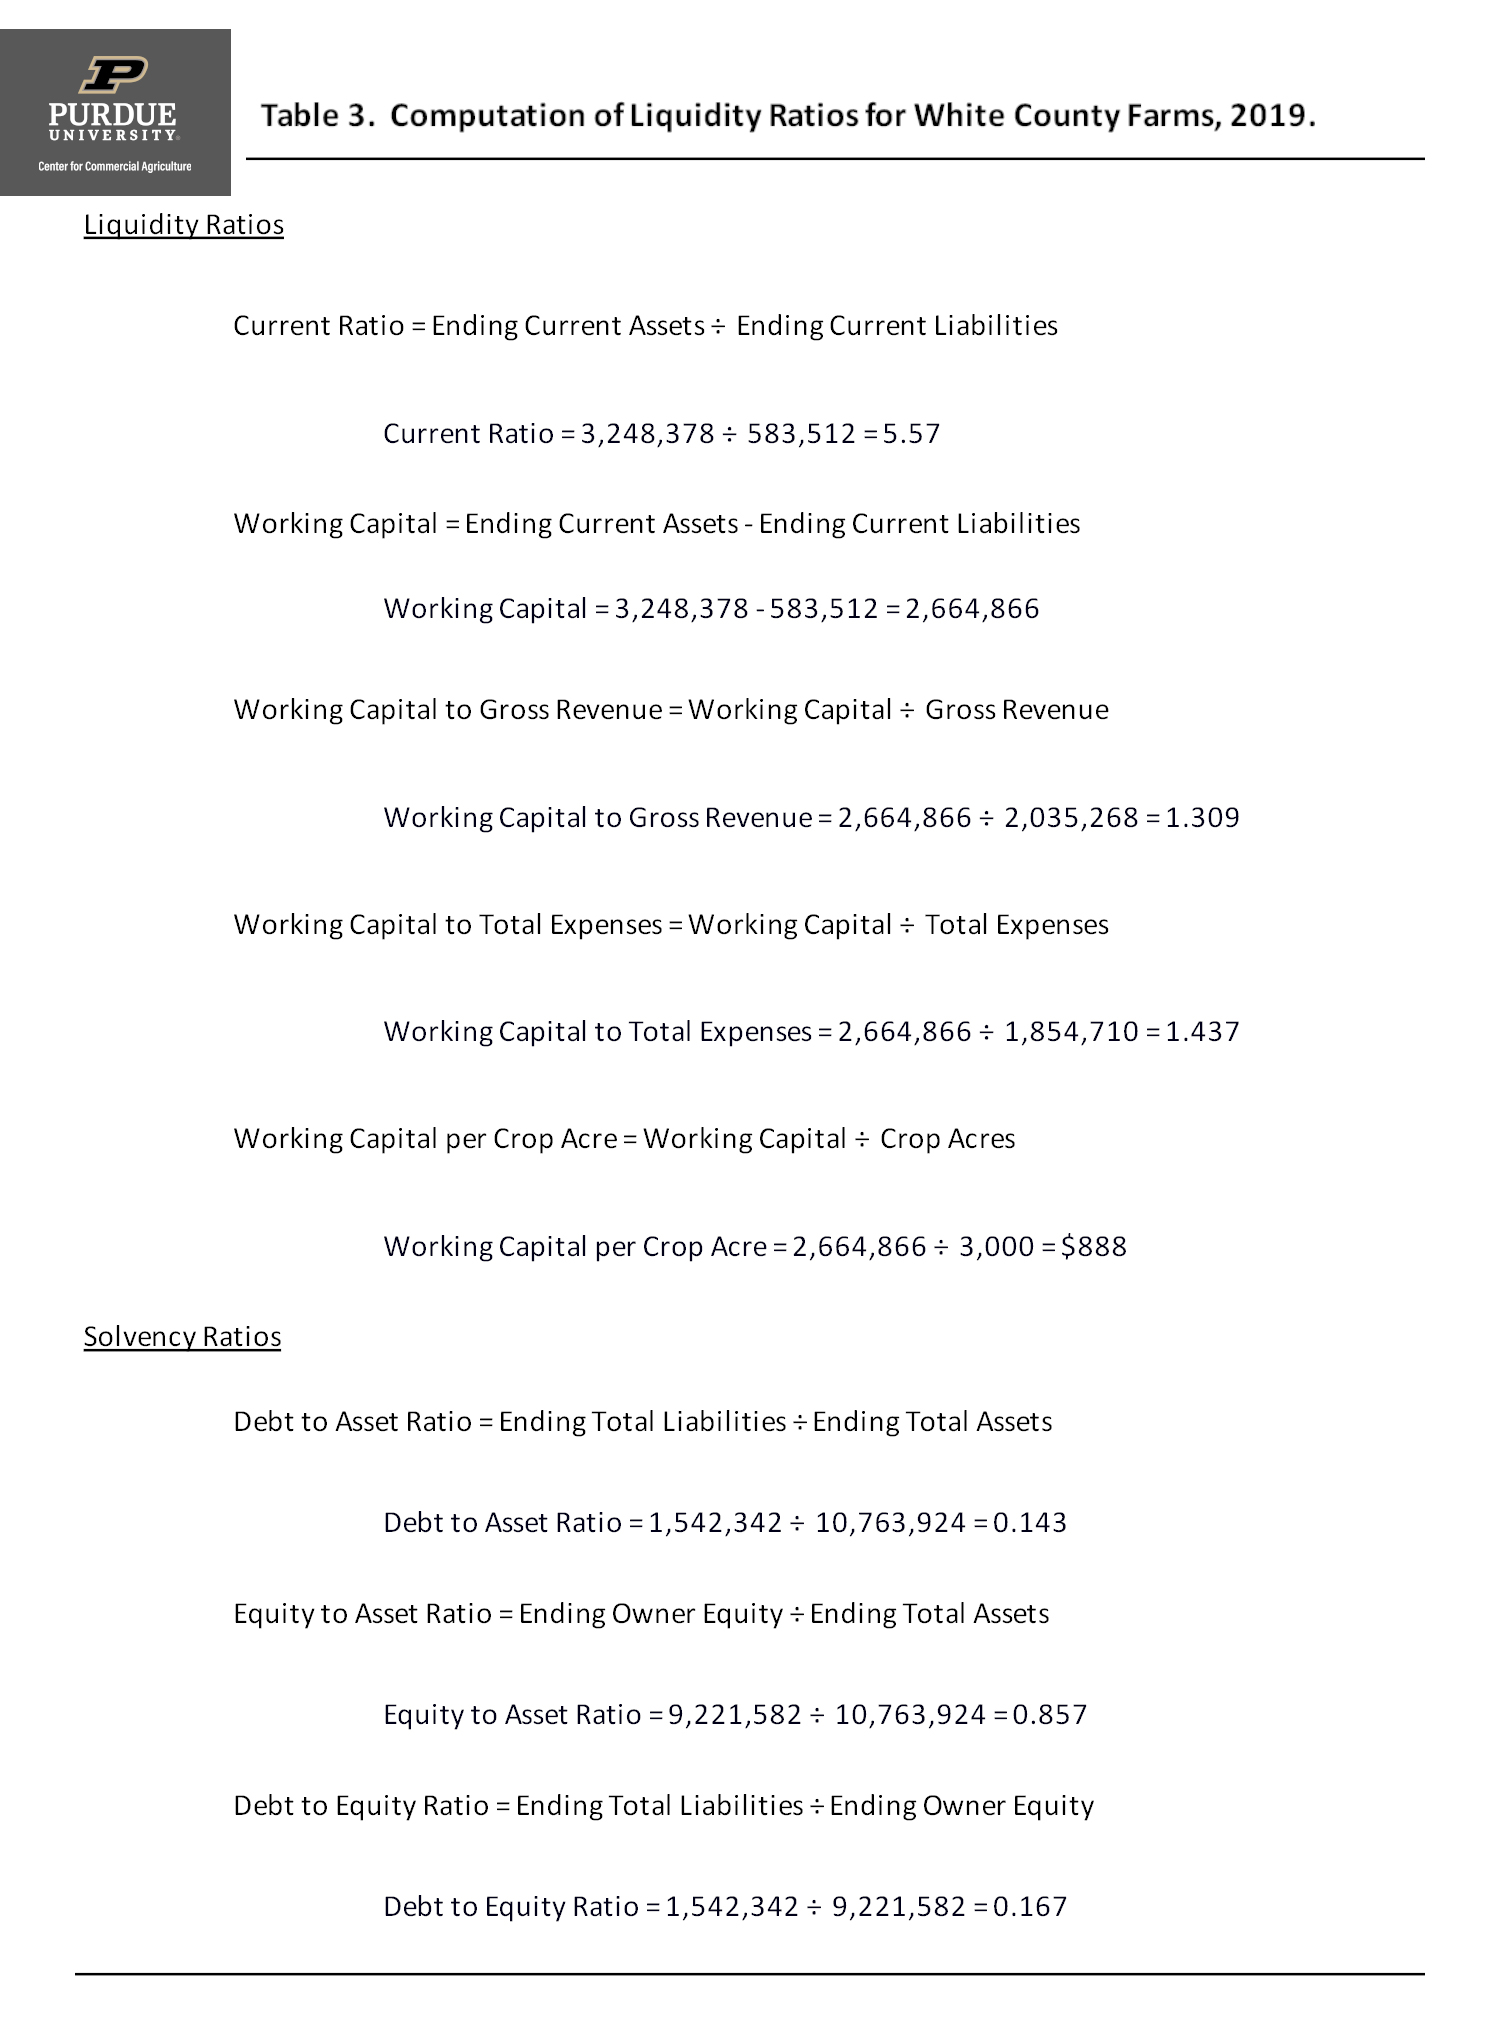
Table 3. Computation of Liquidity Ratios for White County Farms, 2019.
Solvency measures the amount of debt and other expense obligations used in the farm business relative to the amount of owner equity invested in the business. Solvency ratios provide an indication of the farm’s ability to repay all financial obligations if all assets are sold, as well as an indication of the ability to continue operations as a viable farm business after a financial adversity, such as a drought. Computations for three commonly used solvency measures can be found in table 3. The three solvency measures convey similar information. Here, we will focus on just one of these measures, the debt to asset ratio, which compares total farm liabilities to the value of total farm assets. This ratio is one measure of the risk exposure of the farm business; thus, it is important to compare this ratio over time. Farm management studies have found the debt to asset ratio to be highly correlated to the variability of net farm income, a commonly used measure of risk. The debt to asset ratio for the case farm, using ending balance sheet values, is 0.143. This ratio indicates the case farm has a strong solvency position.
A final note needs to be made regarding market value balance sheets. A market value balance sheet typically shows liquidation values of the assets. Often there is tax liability associated with the liquidation of assets. Because of this, deferred taxes are sometimes included as liabilities in a market value balance sheet.
This article illustrated and described a market balance sheet, a common size balance sheet, and liquidity and solvency ratios. Other articles in the financial management series include information pertaining to the income statement, the cash flow statement, the sources and uses of funds statement, the statement of owner equity, pro forma financial analysis, stress testing, and benchmarking financial efficiency and performance.
![]()
![]()
![]()
![]()
![]()
TEAM LINKS:

PART OF A SERIES:

RELATED RESOURCES
UPCOMING EVENTS
We are taking a short break, but please plan to join us at one of our future programs that is a little farther in the future.