September 16, 2020
Measuring Efficiency of Farm Asset Utilization
by Michael Langemeier
![]()
![]()
![]()
![]()
![]()
Financial efficiency can be measured using the operating expense ratio, the depreciation expense ratio, the interest expense ratio, the net farm income ratio, and the asset turnover ratio. The three expense ratios and the net farm income ratio measure a farm’s ability to produce on the production and cost frontiers. A farm’s ability to operate on the production frontier depends on its ability to produce crop and livestock enterprises efficiently, while a farm’s ability to produce on the cost frontier pertains to its ability to produce on the production frontier, manage costs, and market crop and livestock commodities. The asset turnover ratio, on the other hand, measures how efficiently farm assets are being used to generate value of farm production (a gross income measure). Farms that utilize assets more efficiently would have a higher asset turnover ratio. As capital requirements increase, it becomes increasingly important to measure the efficiency of asset utilization. In this article, a case farm in west central Indiana is used to examine asset turnover ratio benchmarks.
The asset turnover ratio is computed by dividing value of farm production by average total assets. Value of farm production can be obtained from the farm’s income statement, and average total assets can be obtained from the farm’s market value balance sheet. It is important to note that gross revenue is sometimes used instead of value of farm production to compute the asset turnover ratio.
Table 1 presents the computation of the asset turnover ratio for a west central Indiana case farm. The case farm has 3000 acres of corn and soybeans. Of the 3000 acres operated by the farm, 2250 acres are cash rented from several landlords and 750 acres are owned. The columns in table 1 compare the projected 2020 and 2021 ratios with the five-year average ratio for the 2015 to 2019 period. Using stoplight terminology, the “green” region for the asset turnover ratio is 35 percent and above, the “yellow” region ranges from 25 to 35 percent, and the “red” region is 25 percent and below. These benchmarks apply to long-run performance, not individual years. Notice that this case farm was in the “red” region during the 2015 to 2019 period. Prior to the most recent five-year period, the asset turnover ratio for the case farm was in the “yellow” region. The more rapid decline in value of farm production compared to total farm assets has contributed to the decline in the asset turnover ratio for the case farm in recent years. The projected ratios for 2020 and 2021 are even lower than the average ratio from 2015 to 2019. Looking for ways to improve revenue and use assets more efficiency is a high priority for the case farm.
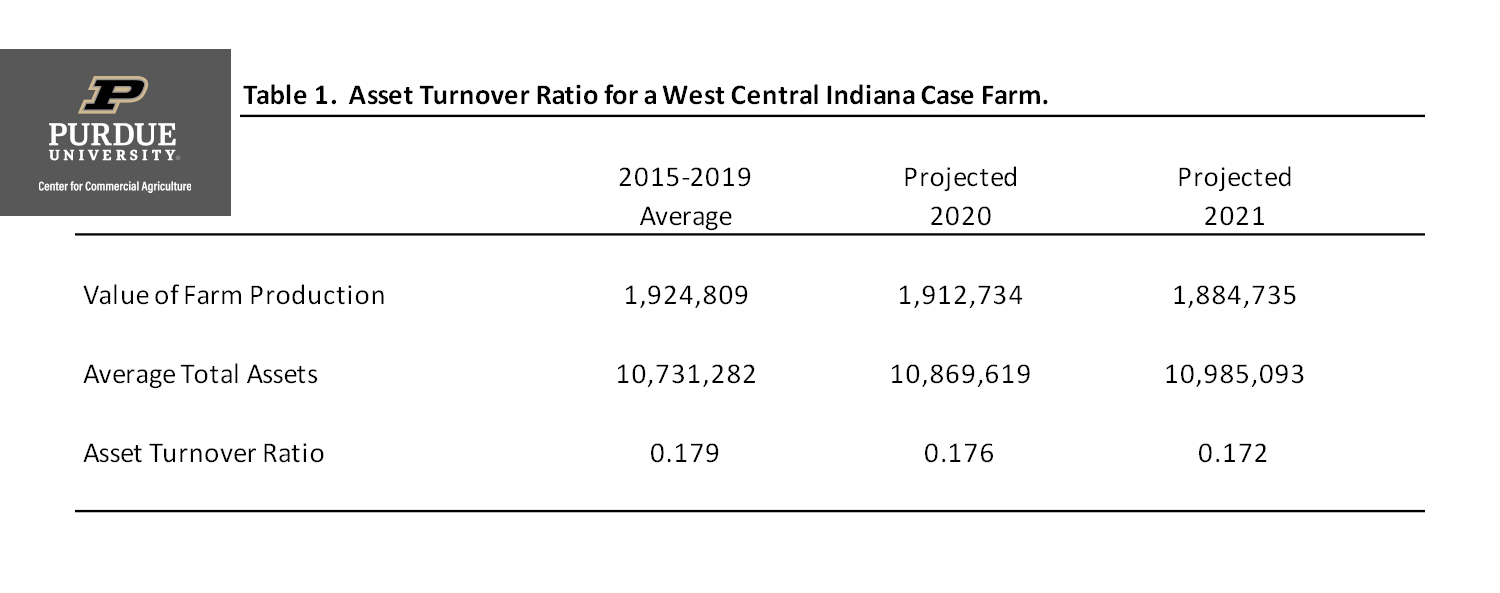
Table 1. Asset Turnover Ratio for a West Central Indiana Case Farm.
To further evaluate the performance of the case farm, we can compare the case farm’s asset turnover ratio from 2015 to 2019 to data obtained from the Illinois Farm Business and Farm Management (FBFM) Association. The median asset turnover ratio for grain farms participating in the FBFM program for the 2014 to 2018 period was 20.2 percent. Though lower than this average, the asset turnover ratio for the case farm is similar to that of other farms.
Land ownership and farm type have important impacts on the asset turnover ratio. Holding all else constant, a farm that owns a higher proportion of their acres, will have a lower asset turnover ratio. Table 2 illustrates the impact of land ownership on the asset turnover ratio. The second column in table 2 represents the 2019 case farm information and is called the “base case”. For the base case, 25 percent of the land on the case farm is owned. In contrast to the base case, the first column assumes that only 10 percent of the land on the case farm was owned and the third column assumes that 40 percent of the land on the case farm was owned. Table 2 illustrates the sensitivity of the asset turnover ratio to land ownership. Moving from 10 percent land ownership to 40 percent land ownership, reduces the asset turnover ratio from 0.286 to 0.143.
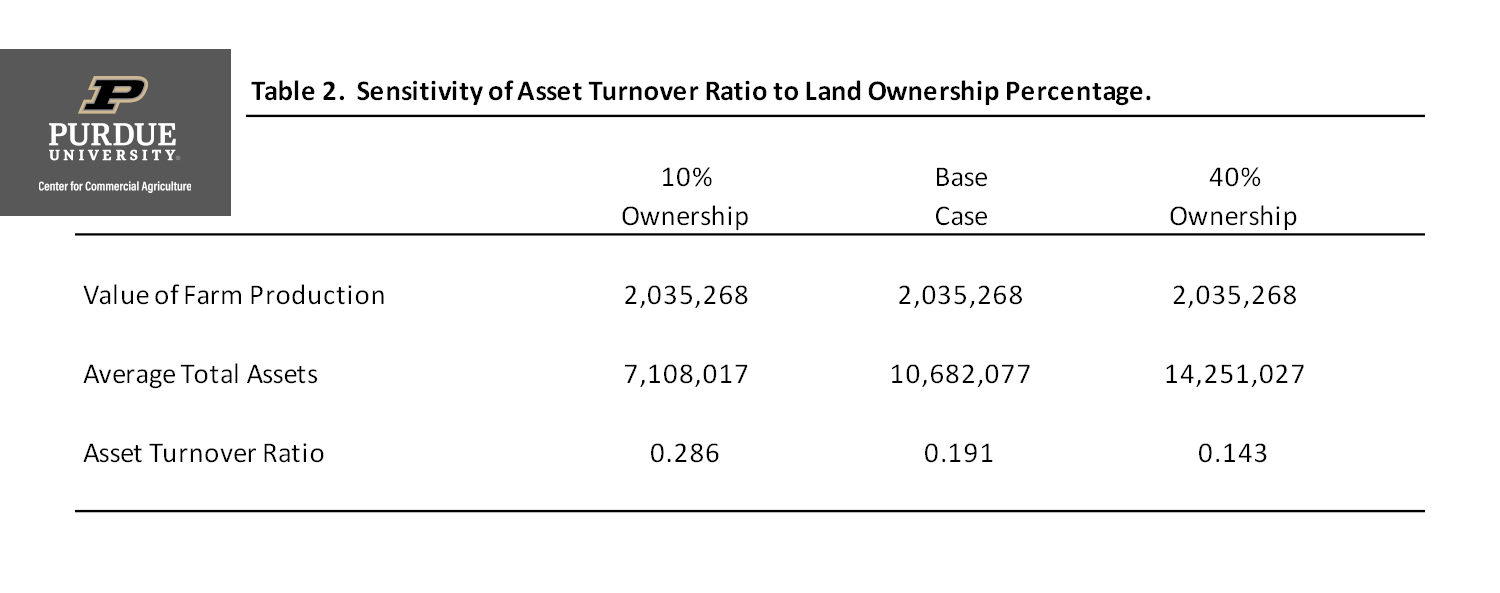
Table 2. Sensitivity of Asset Turnover Ratio to Land Ownership Percentage.
As noted above, the asset turnover ratio also varies by farm type. The stoplight benchmarks discussed above represent benchmarks for non-irrigated crop farms. The benchmarks for irrigated crop farms would need to be higher. Conversely, the benchmarks for beef cow operations would need to be lower. Given this, it is important to use asset turnover benchmarks for farms that have similar enterprises.
This article discussed the importance of evaluating a farm’s efficiency in asset utilization. The asset turnover ratio examines how efficiently farm assets are being used. A case farm was used to illustrate and discuss asset turnover ratios. The asset turnover ratio for the case farm was relatively low during the 2015 to 2019, and is projected to stay relatively low in 2020 and 2021. Thus, this farm needs to assess their gross revenues, and their machinery and land ownership costs, and determine whether actions need to be taken to improve asset utilization.
![]()
![]()
![]()
![]()
![]()
TEAM LINKS:

PART OF A SERIES:

RELATED RESOURCES
UPCOMING EVENTS
We are taking a short break, but please plan to join us at one of our future programs that is a little farther in the future.