September 9, 2020
U.S. Farm Sector Balance Sheet
by Michael Langemeier
![]()
![]()
![]()
![]()
![]()
Since its peak in 2013 at $123.7 billion, average U.S. net farm income has averaged $82.7 billion or approximately 33% less than the peak value. The balance sheet for the U.S. farm sector continues to adjust to the declines in U.S. net farm income since 2013. Specifically, asset values and debt levels have adjusted to tighter cash flows and net farm income. This article discusses changes in the U.S. farm sector balance sheet as well as liquidity and solvency ratios.
Trends in Real Assets and Debt
Before analyzing the farm sector’s current balance sheet, we will review trends in real assets and real debt. Figure 1 presents real U.S. farm sector asset and debt values using 2019 as the base year. With the exception of 2020, the values for each year represent end of the year values. Prior to 2012, the peak in real assets occurred in 1979 at a value of $2.693 trillion. In 2012, real assets for the farm sector totaled $2.893 trillion. Since 2014, real assets have exceeded $3 trillion. Real assets are projected to be valued at $3.087 trillion in 2020. The 2020 value of real assets is 3.1 percent higher than the value reached in 2013, which represents the most recent peak in real net farm income.
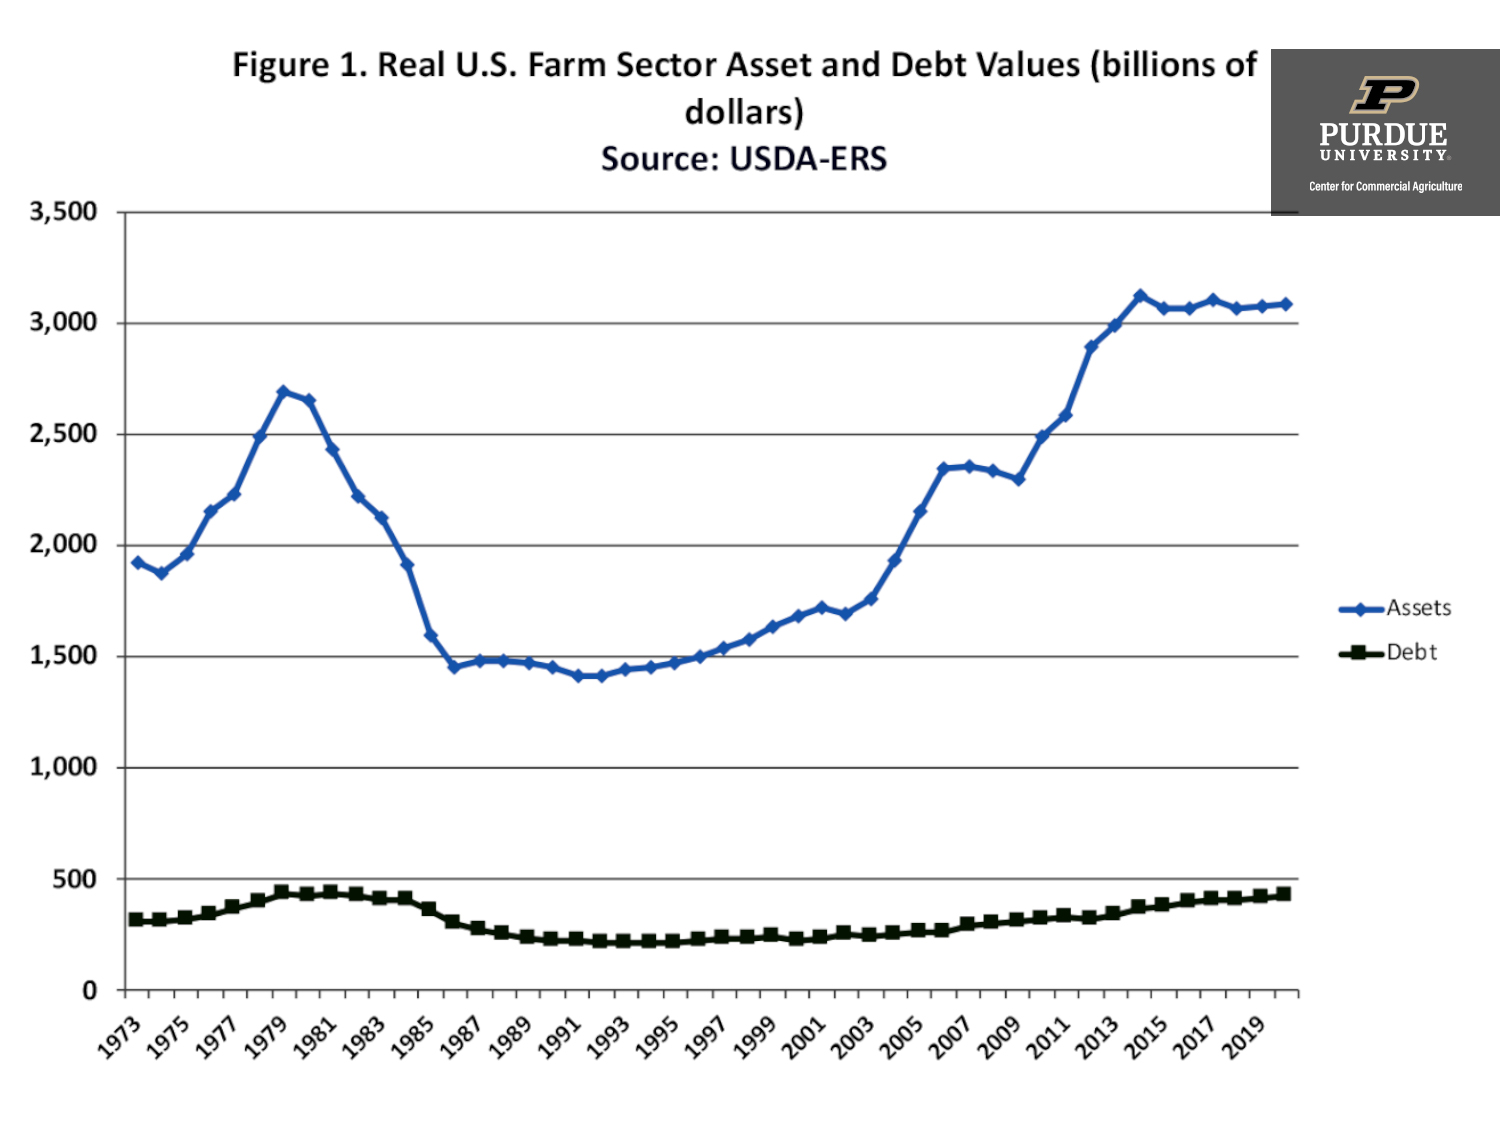
Figure 1. Real U.S. Farm Sector Asset and Debt Values (billions of dollars)
Source: USDA-ERS
The peak U.S. farm sector real debt occurred in 1979 at a value of $434 billion. Real debt for the U.S. farm sector was below $300 billion from 1987 to 2007. Except for in 2012, real debt has been increasing every year since 2003. Since 2013, the recent peak in terms of net farm income, real debt has increased 26.3 percent.
Projected farm sector equity in 2020 is expected to be very similar to farm sector equity in 2013. Prior to 2011, the peak in U.S. farm sector equity occurred in 1979 at a value of $2.259 trillion. Farm sector equity in 2013 and projected farm sector equity in 2020 are $2.654 trillion and $2.657 trillion, respectively.
Farm Sector Balance Sheet
Table 1 presents the U.S. farm sector balance sheet for 2010, 2015, and 2020. The values in table 1 represent real values using 2019 as the base year. The 2010 and 2015 balance sheets represent end of the year balance sheets. The 2020 balance sheet represents forecasted values and was updated on September 2, 2020.
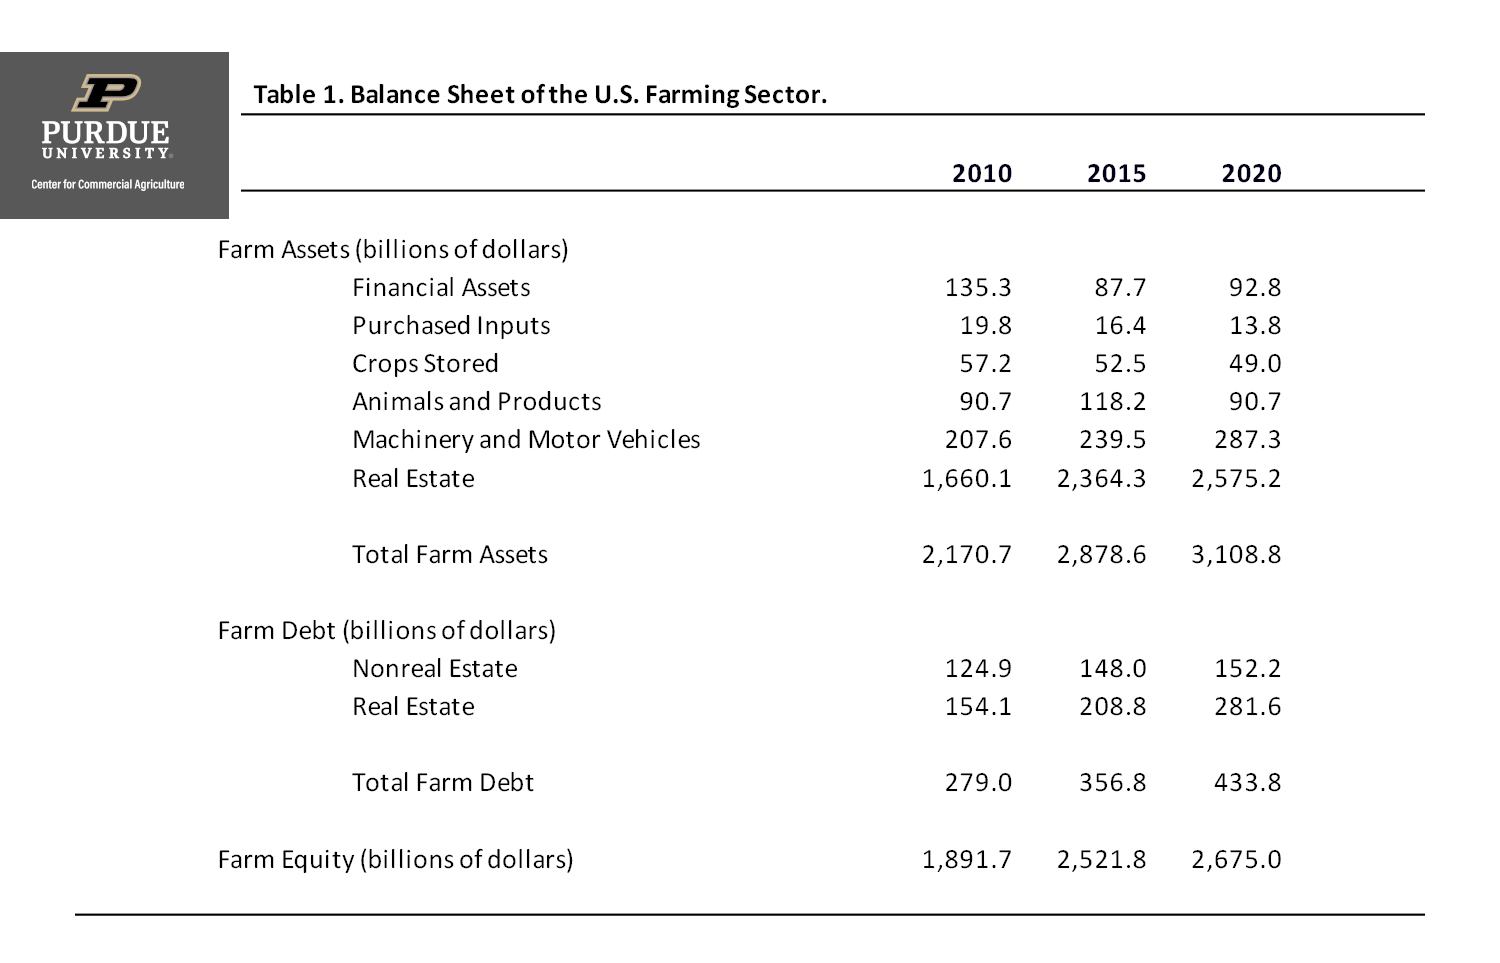
Table 1. Balance Sheet of the U.S. Farming Sector.
Projected real asset values for 2020 are substantially higher than those for 2010 and 2015. However, it is important to note that the asset values for financial assets, purchased inputs, and crops stored were lower in 2020 than they were for 2010. The value of machinery and motor vehicles in 2020 was approximately 38 percent higher than the value in 2010. Similarly, real estate values in 2020 were approximately 55 percent higher than the values in 2010.
Nonreal estate debt has increased 21.9 percent since 2010 and real estate debt has increased 82.7 percent. Current real estate debt, in real dollars, represents the highest level experienced during the 1973 to 2020 period. Though relatively high compared to levels in 2010, nonreal estate debt was higher from 1975 to 1985, and from 2014 to 2019. Farm equity in 2020 is 41.4 percent larger than it was in 2010, and 6.1 percent larger than it was in 2012.
A common size balance sheet for the U.S. farm sector is presented in table 2. Common size balance sheets use percentages rather than actual dollars and are useful when comparing balance sheets across farms or years. The percentage of assets accounted for by financial assets, purchased inputs, crops stored, and animals and products were 14.0 percent in 2010, 9.5 percent in 2015, and 7.9 percent in 2020, reflecting the large drop in current assets since 2010. Machinery and motor vehicles were from 8.3 to 9.6 percent of total assets in 2010, 2015, and 2020. Currently, land makes up approximately 83 percent of total assets.
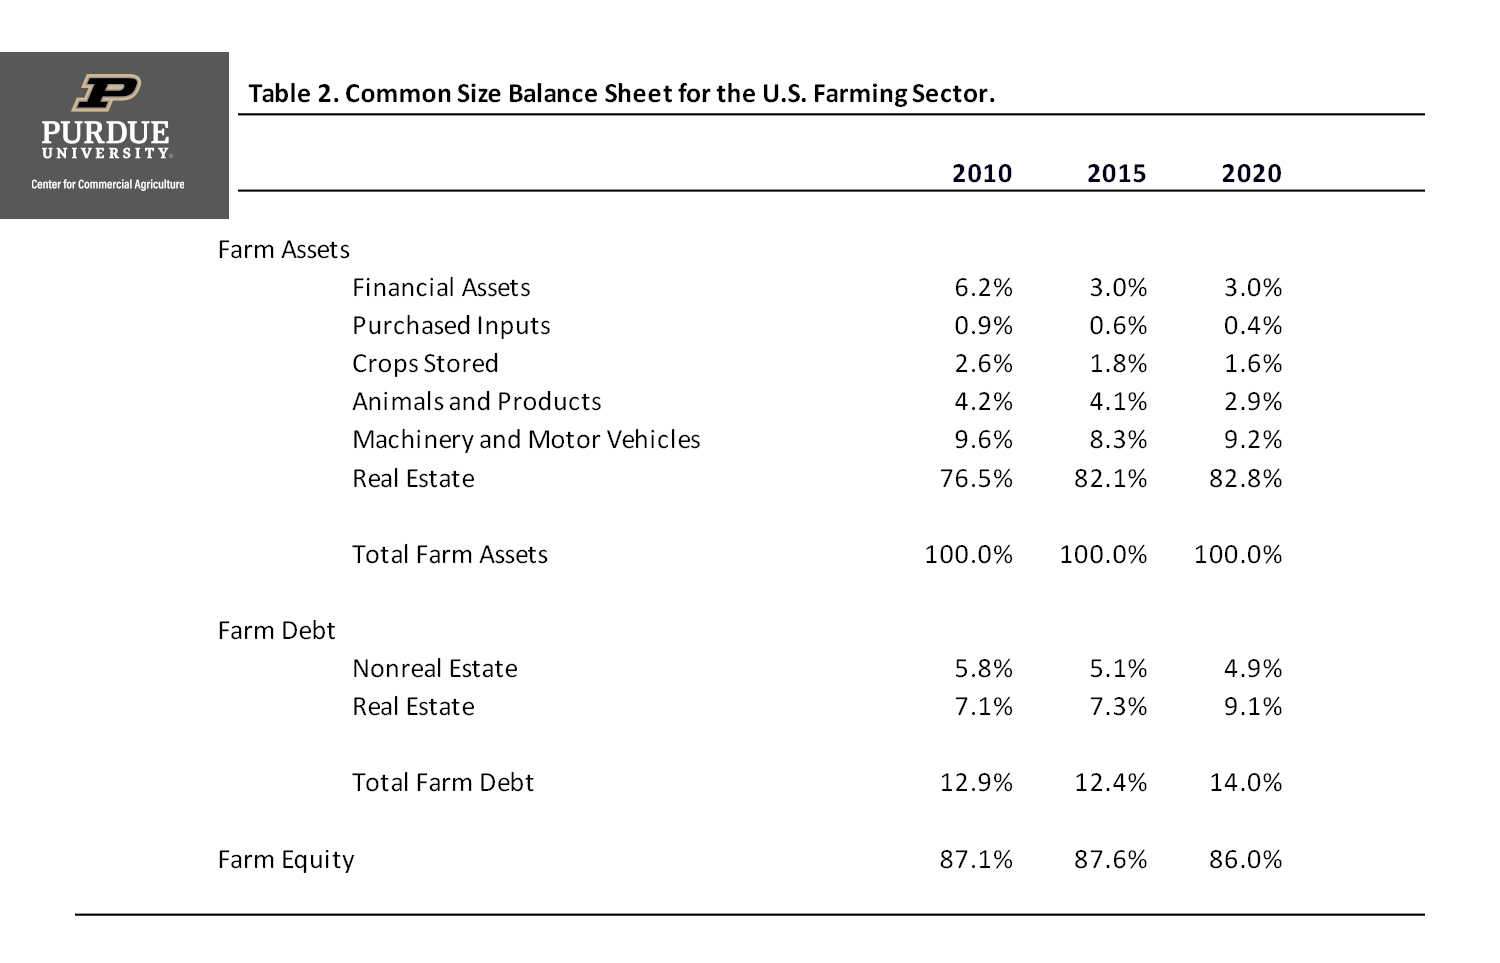
Table 2. Common Size Balance Sheet for the U.S. Farming Sector.
Nonreal estate debt as a percent of total assets in 2020 is smaller than it was 2010. Conversely, real estate debt in 2020 was quite a bit higher as a percent of total assets than it was in both 2010 and 2015. Nonreal estate debt as a proportion of nonreal estate assets is currently 28.5 percent and real estate debt as a proportion of real estate assets is currently 10.9 percent. Total farm debt as a percentage of assets in table 2 ranged from 12.4 percent in 2015 to 14.0 percent in 2020. Long-term trends in the debt to asset ratio for the U.S. farm sector will be discussed further below.
Liquidity Ratios
USDA-ERS has been reporting the average current ratio and the average working capital to value of farm production since 2009. Working capital is computed by subtracting current liabilities such as operating debt and the current portion of term debt from current assets such as financial assets, inventories of purchased inputs, and crop and market livestock inventories.
The average current ratio for the farm sector declined from 2.87 in 2012 to 1.62 in 2020. The 2020 value is well below the commonly used benchmark value of 2. The average working capital to value of farm production ratio declined from a value of 0.37 or 37 percent in 2012 to an average value of 0.15 or 15 percent in 2020. A commonly used benchmark value for this ratio is 35 percent or greater. The average 2020 values for both the current ratio and the working capital to value of farm production ratio illustrate the liquidity problems that farms currently face.
Solvency Ratios
Solvency ratios, such as the debt to asset ratio, provide an indication of the farm’s ability to repay all financial obligations if all assets are sold, as well as an indication of the ability to continue operations as a viable farm business after a financial adversity, such as drought.
Figure 2 illustrates the debt to asset ratio for U.S. farm sector since 1973. The debt to asset ratio peaked in 1985 at 22.2 percent. The debt to asset ratio has been below 15 percent since 1999. The 2020 debt to asset ratio at 13.6 percent represents the highest ratio since 2003, but is still relatively low by historical standards. That is why many economists indicate that U.S. agriculture is currently facing a liquidity crisis, but not a solvency crisis.
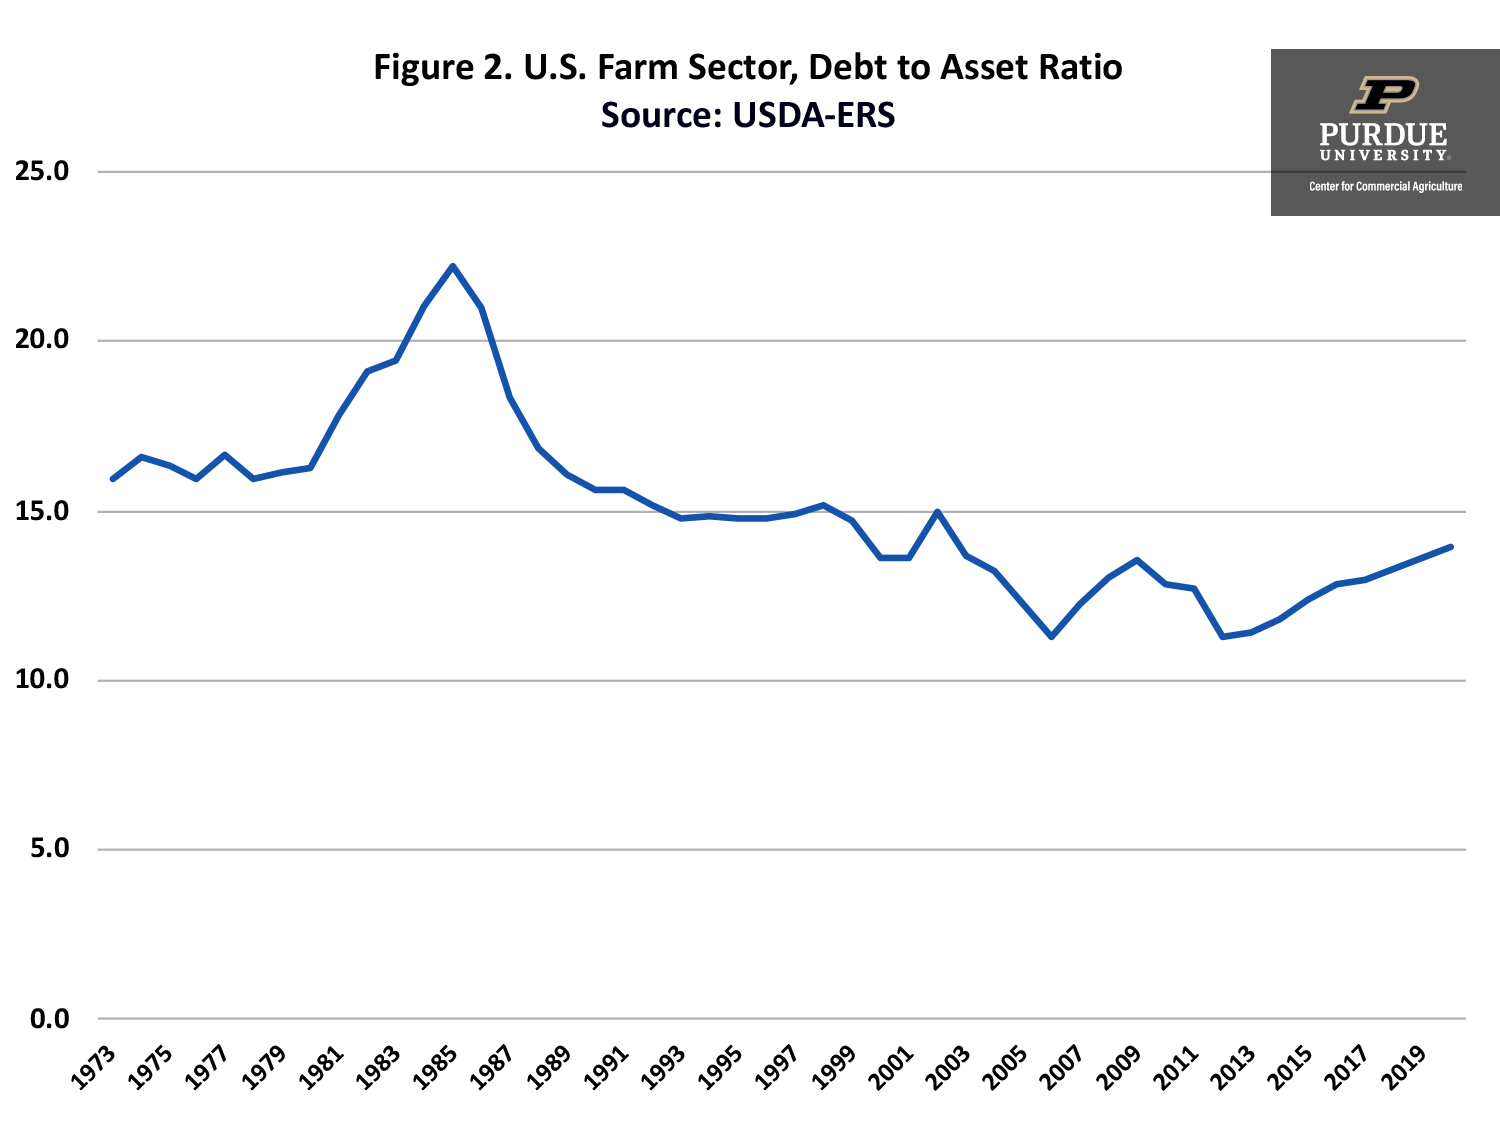
Figure 2. U.S. Farm Sector, Debt to Asset Ratio
Source: USDA-ERS
How could a solvency crisis similar to that experienced in the 1980s come about? For solvency to increase dramatically at least two things would need to happen. First, net farm income would need to stay relatively low compared to the average since 2007. Projected net farm income for 2020 are currently above the average since 2007. Second, land values would need to sharply decline. A relatively low net farm income and a decline in land values would increase total debt and decrease asset values, resulting in an increase in the debt to asset ratio. The decrease in land values would have to be very sharp to repeat the conditions experienced in the 1980s. The combination of relatively low net farm income and sharply lower land values does not appear to be imminent.
Conclusions
The balance sheet for the U.S. farm sector continues to adjust to the relatively lower levels of net farm income experienced since 2013. Primarily due to land values, total asset values in 2020 are higher than they were in 2010 and 2015. Nonreal and real debt have increased 21.9% and 82.7% since 2010. Liquidity has dropped substantially since 2012. Due to relatively strong land values, solvency is only slightly higher than it was in 2012.
This article focused on the U.S. balance sheet for the farm sector. Regional changes in the balance sheet are likely quite different than changes at the national level. Differences in regional and the national balance sheet reflect differences in how land values have adjusted over the last several years, and regional differences in enterprise mix. While land values at the national level have not declined, land values for some states in the Great Plains and the Corn Belt have seen declines of 20% to 25%. A future article will compare common size balance sheets at the U.S. with those for full-time farms.
Reference
USDA-ERS. “Farm Income and Wealth Statistics.” www.ers.usda.gov/data-products/farm-income-and-wealth-statistics/, accessed September 2, 2020.
![]()
![]()
![]()
![]()
![]()
TEAM LINKS:

PART OF A SERIES:

RELATED RESOURCES
UPCOMING EVENTS
We are taking a short break, but please plan to join us at one of our future programs that is a little farther in the future.