October 13, 2020
Persistence in Financial Performance
by Michael Langemeier and Elizabeth Yeager
![]()
![]()
![]()
![]()
![]()
This article examines the persistence of financial performance measures for a sample of farms over a five-year period. Specifically, using KFMA whole-farm data for farms with continuous data from 2015 to 2019, the operating profit margin ratio is computed for each farm and year. The number of years each farm was in the top and bottom performance quartiles is computed and discussed. Also, the operating profit margin ratio and corresponding farm characteristics are compared across financial performance quartiles. The operating profit margin ratio was computed by adding interest expense and subtracting unpaid family and operator labor from net farm income and dividing the result by value of farm production.
In addition to the operating profit margin, other variables compared across profit margin quartiles included value of farm production, net farm income, interest, unpaid family and operator labor, total assets, total debt, total expense ratio, adjusted total expense ratio, economic total expense ratio, asset turnover ratio, debt to asset ratio, percent of farms with positive cash flow, percent of farms financially stressed, percent of farms with expense ratios below 1.00, and percent of farms in five value of farm production categories (i.e., less than $250,000 in value of farm production; value of farm production between $250,000 and $500,000; value of farm production between $500,000 and $1,000,000; and value of farm production greater than $1,000,000). The total expense ratio was computed by summing cash costs, accrual adjustments to costs, and depreciation, and dividing the result by value of farm production. The adjusted total expense ratio was computed by adding unpaid family and operator labor to the expenses included in the total expense ratio and dividing by value of farm production. An adjusted total expense ratio below 1.00 indicates that a farm was able to cover accrual expenses, depreciation, and unpaid family and operator labor. The economic total expense ratio was computed by adding the opportunity cost on net worth to the expenses in the adjusted total expense ratio and dividing by value of farm production. If the economic total expense ratio was below 1.00, the farm or group of farms was covering all accrual and opportunity expenses, and was earning an economic profit. A farm was considered financially stressed if it had an adjusted total expense ratio above 1.00 and had a debt to asset ratio above 0.70.
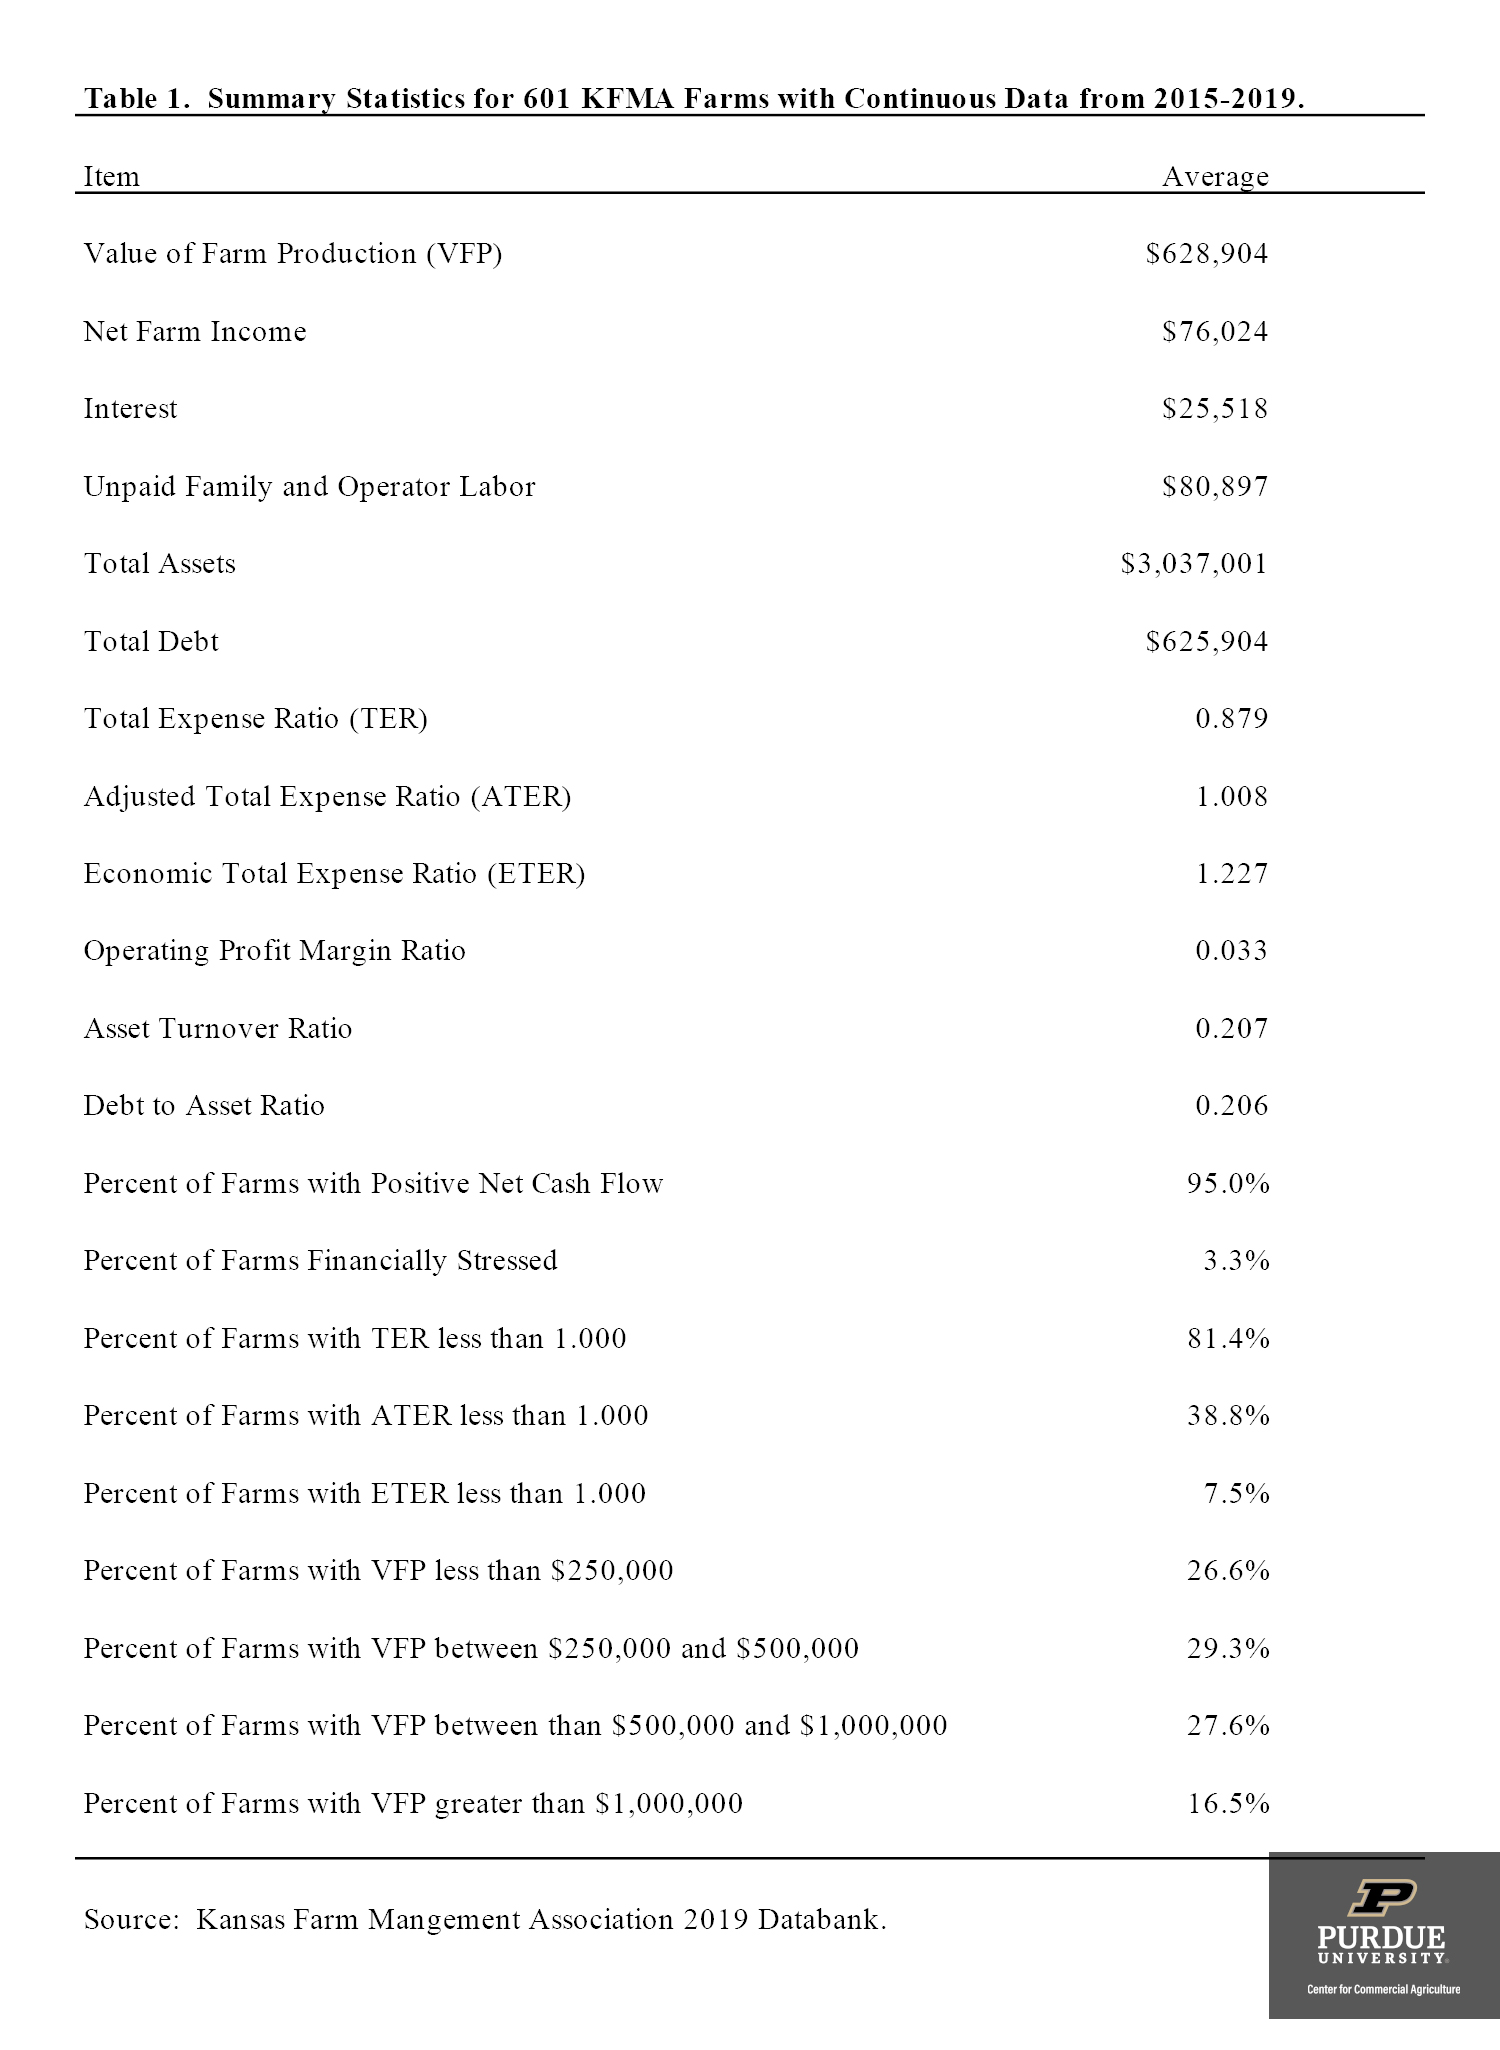
Table 1. Summary Statistics for 601 KFMA Farms with Continuous Data from 2015-2019.
Table 1 presents the summary statistics for the 601 KFMA farms with continuous data from 2015 to 2019. Value of farm production averaged $628,904 and net farm income averaged $76,024. The average operating profit margin ratio was 0.033 or 3.3 percent while the average asset turnover ratio was 0.207. The average total expense ratio, adjusted total expense ratio, and economic total expense ratio were 0.879, 1.008, and 1.227, respectively. As indicated by the percent of farms with an adjusted total expense ratio below 1.00, approximately 39 percent of the farms covered accrual expenses, depreciation, and unpaid family and operator labor. Approximately 7.5 percent of the farms covered all accrual and opportunity costs and thus were earning an economic profit. Approximately 3.3 percent of the farms were, on average during the five-year period, financially stressed.
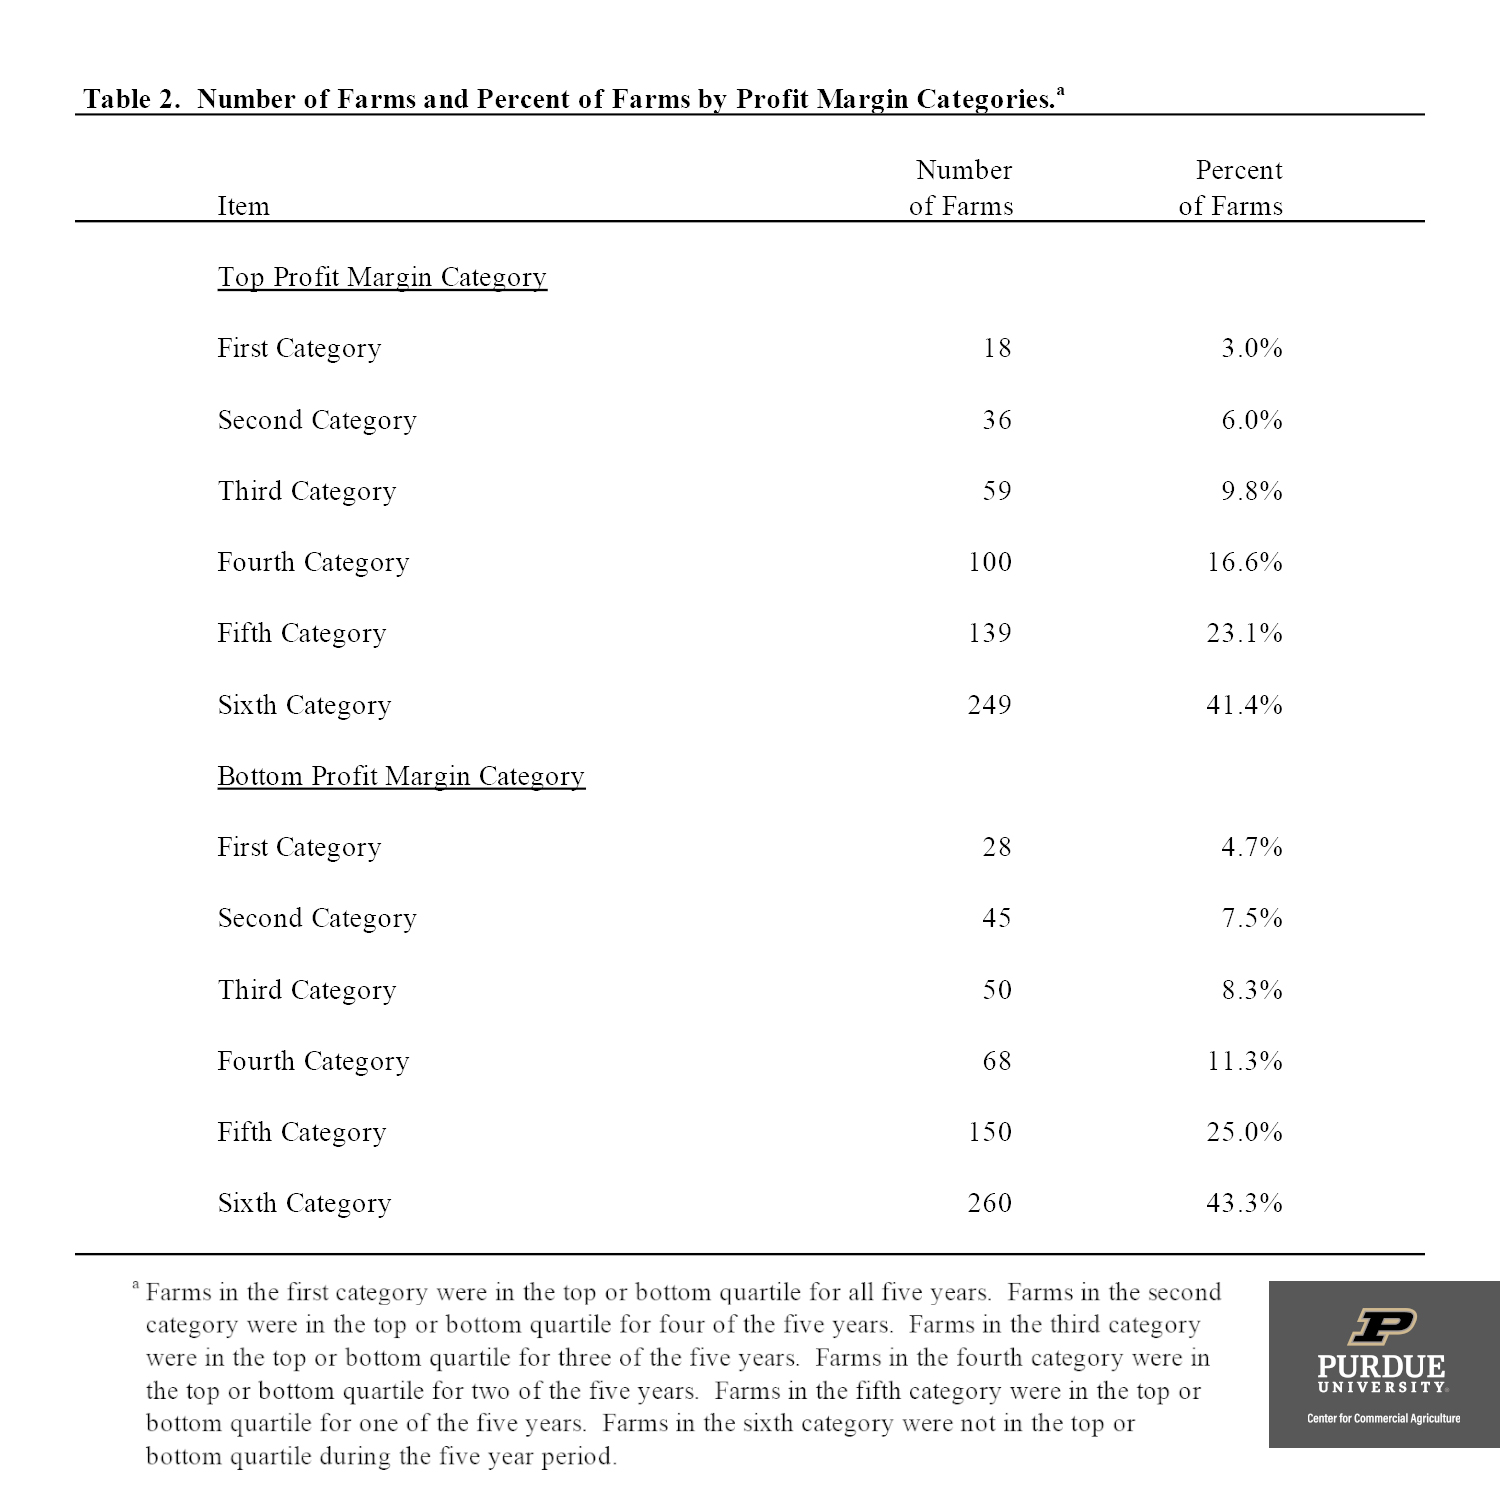
Table 2. Number of Farms and Percent of Farms by Profit Margin Categories.a
Table 2 presents the number of farms and percent of farms by profit margin category. Farms in the first category were in the top or bottom quartile for all five years. Only 18 farms, or 3.0 percent of the farms, were in the top profit margin quartile for all five years. Approximately 18.8 percent of the farms were in the top profit margin category for three, four, or five years (i.e., in the first, second, or third top profit margin categories). Approximately 20.5 percent of the farms were in the bottom profit margin category for three or more years (i.e., in the first, second, or third bottom profit margin categories). It is important to note that approximately 43 percent of the farms were never in the bottom profit margin category.
Variable comparisons among the profit margin quartiles can be found below. Before discussing this information, some of the characteristics of the 18 farms that were consistently in the top profit margin quartile will be discussed. The average operating profit for this group was 0.253 or 25.3 percent. The average asset turnover ratio for this group was 0.159 and the average return on assets, not including capital gains on land, was 4.0 percent. The average value of farm production for this group of farms was $1,516,800, more than double the average value of farm production for the entire sample of farms. All of these farms were covering accrual expenses, depreciation, and unpaid family and operator labor. Moreover, approximately 39 percent of the farms in this group were earning an economic profit.
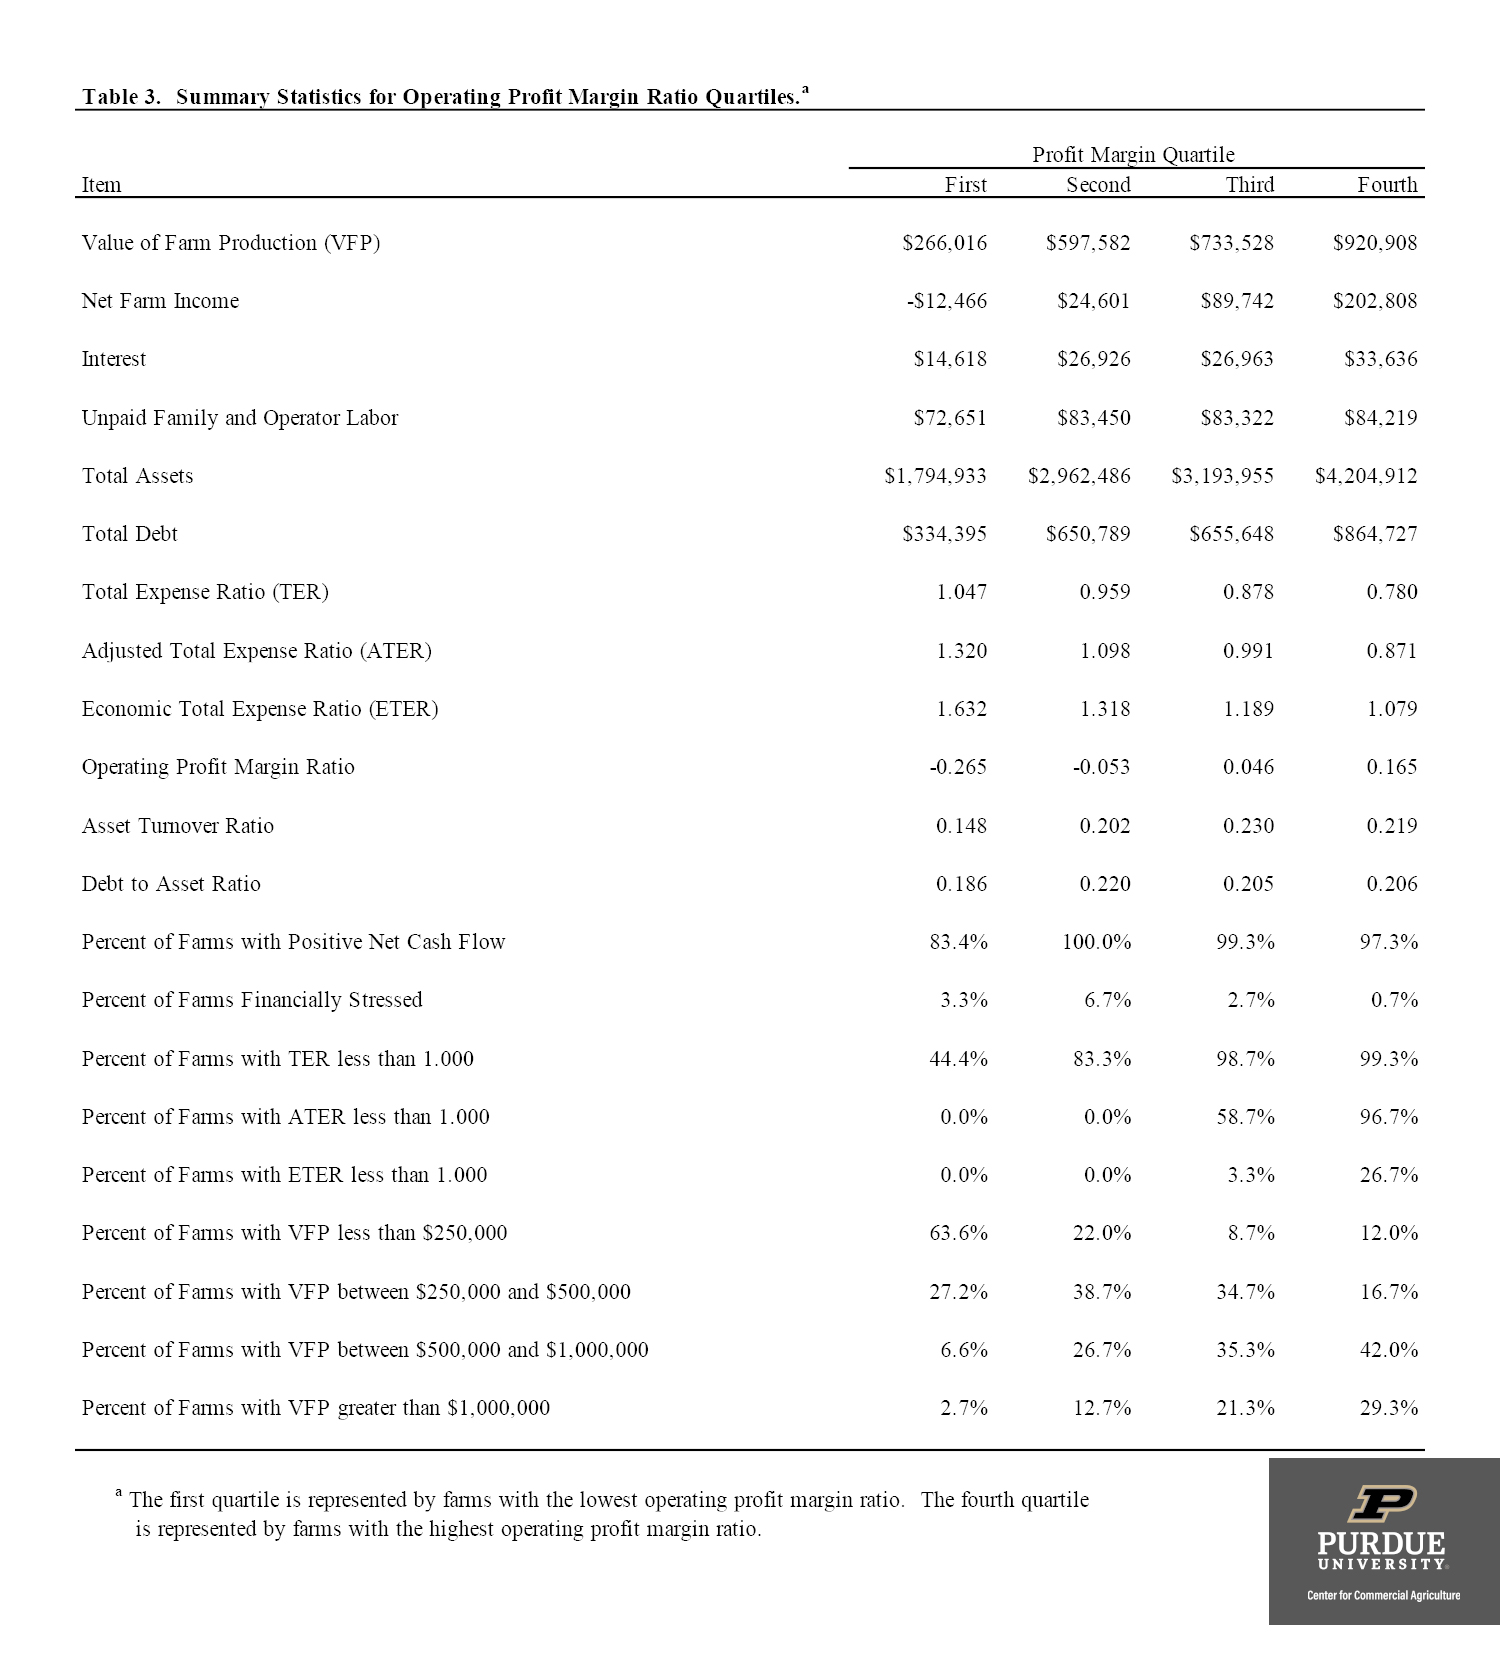
Table 3. Summary Statistics for Operating Profit Margin Ratio Quartiles.a
Table 3 presents the summary statistics for the operating profit margin ratio quartiles. This table was created using five-year average data for each farm. The farms in the top profit margin quartile had an average operating profit margin ratio of 0.165 or 16.5 percent (Table 3). In contrast, the farms in the bottom profit margin quartile had an average operating profit margin ratio of -0.265. The farms in the bottom profit margin quartile also had a relatively low asset turnover ratio and relatively high expense ratios. In fact, only 44.4 percent of farms in the bottom profit margin quartile covered accrual expenses and depreciation (i.e., had a total expense ratio below 1.00). In contrast, 26.7 percent of the farms in the top profit quartile earned an economic profit.
Interestingly, financial stress was more severe in the second profit margin quartile than it was in the first profit margin quartile. The primary reason for this relates to the percentage of farms with debt to asset ratios over 70 percent. For the first profit margin category, only 3.3 percent of the farms had high debt to asset ratios. In contrast, 6.7 of the farms in the second profit margin category had a high debt to asset ratio. The percentage of farms for the first profit margin quartile with no debt was more than double the percentage of farms in the second profit margin quartile with no debt.
The farms in the top profit margin ratio tended to be larger than the farms in the other profit margin categories, and had relatively lower expense ratios. Despite having a larger average farm size, the top quartile contained farms of various sizes. Approximately 12 percent of the farms in the top quartile had a value of farm production below $250,000. Approximately 29 percent of the farms in the top quartile had a value of farm production above $1,000,000. Given that the average value of farm production for farms in the bottom quartile was only $266,016, it is interesting to note that 2.7 percent of the farms in the bottom quartile had a value of farm production above $1,000,000.
In summary, this paper examined the persistence of financial performance for a sample of farms over a five-year period. Results suggest that weather and other external factors made it difficult for a farm to consistently be in the top profit margin quartile over time. However, using five-year average data there was a substantial difference in financial performance between farms in the top and bottom quartiles. For example, farms in the top profit margin ratio quartile had an average operating profit margin ratio of 0.165 compared to an average operating profit margin ratio for the sample of farms of only 0.033.
Results also stress the importance of using several years of data to benchmark financial performance and suggest that it is possible for farms to have a sustained competitive advantage. Given the wide variability of financial performance documented in this study, a further examination of the characteristics of the farms in the top profit margin quartile, including obtaining information pertaining to management styles, experience, and decision-making abilities, would be a fruitful area for further research.
![]()
![]()
![]()
![]()
![]()
TEAM LINKS:


PART OF A SERIES:

RELATED RESOURCES
UPCOMING EVENTS
We are taking a short break, but please plan to join us at one of our future programs that is a little farther in the future.