September 22, 2021
The Ag Economy Barometer Provides Insight Into Ag Producers’ Sentiment
by James Mintert
![]()
![]()
![]()
![]()
![]()
In October 2015 we launched a monthly phone survey with the intent of asking commercial-scale U.S. agricultural producers’ about economic conditions on their farms as well as their perspective on the U.S. agricultural economy. We recently published results from our 70th monthly survey, the July 2021 Purdue University – CME Group Ag Economy Barometer survey. In the nearly six years we’ve been conducting surveys and analyzing survey responses, we’ve learned a lot about U.S. farmers’ sentiment and many of the drivers of their sentiment.
There is a relatively long history of sentiment surveys in the U.S. economy. The oldest and best known is the University of Michigan’s Survey of Consumers which can trace its origins back to the post-World War II era and, in its current form, to the 1950s. Although the early surveys focused on learning more about household assets and debts, it became clear that ancillary information gathered from respondents regarding their sentiment was useful in and of itself to better anticipate consumer behavior. Eventually, survey responses were condensed into the Index of Consumer Sentiment as well as the Current Index, focused on current economic conditions, and the Expected Index, which focused on consumers’ expectations for the future. Results from the monthly Survey of Consumers are widely disseminated and are now a component of the Department of Commerce’s Index of Leading Economic Indicators. Over the decades sentiment surveys focused on purchasing managers and corporate executives proliferated, but none of the surveys focused on the agricultural sector and, more specifically, on agricultural producers. The Ag Economy Barometer survey was designed to fill this void, using methodology adapted from Michigan’s Survey of Consumers to launch a monthly national survey of commercial-scale agricultural producers.
Sentiment Drivers
First, agricultural producers’ sentiment is quite volatile. Comparing month-to-month percentage changes in the Index of Consumer Sentiment to those of the Ag Economy Barometer reveals that agricultural producers’ sentiment is nearly three times as volatile as consumer sentiment. The percentage change in the Ag Economy Barometer each month from its inception in fall 2015 to July 2021 averaged 9.4 percent compared to a 3.3 percent monthly average change for the Index of Consumer Sentiment. Differences in the volatility of these two sentiment measures reflect the stark differences in the two survey populations. The Survey of Consumers samples opinions from a broad spectrum of consumers that, by design, covers all segments of the U.S. economy. Broad coverage of the U.S. economy implicit in the Survey of Consumers tends to smooth responses over time as positive/negative developments in one area of the economy are often partially offset by opposing developments in other segments of the economy. In contrast, the Ag Economy Barometer survey is designed to cover just one relatively narrow segment of the U.S. economy, the agricultural production sector. Moreover, the agricultural production sector is characterized by inelastic supply and demand conditions leading to a high degree of income variability. Differences in these two survey populations account for much of the observed volatility differences.
Second, although changes in commodity prices can and do affect agricultural producers’ sentiment, changes in the Ag Economy Barometer are not simply a function of shifts in key commodity prices. For example, monthly average U.S. corn prices explain less than 20 percent of the month-to-month variation in the Ag Economy Barometer. Instead, it turns out that agricultural producer sentiment is affected not just by commodity prices and the resultant income changes, but also by a host of other events and concerns.
What are some of those other events and concerns? First, a change in the political winds can influence attitudes. Producer sentiment improved markedly following the 2016 election as the barometer rose from a reading of 92 in October 2016 to a peak of 153 in January 2017, an increase of 66%. Producers felt better about both their current situation and the future, but the biggest driver of sentiment was an improvement in future expectations as the Index of Future Expectations rose from 95 in October to 169 in January 2017, a 78% improvement. Although there were likely myriad reasons for the sentiment shift, subsequent surveys following the election revealed several key factors behind the sentiment improvement. Across several surveys, producers told us they expected a more favorable regulatory environment and tax policy for agriculture as well as a better outlook for ag trade.

Figure 1. Purdue/CME Group Ag Economy Barometer, October 2015-July 2021.
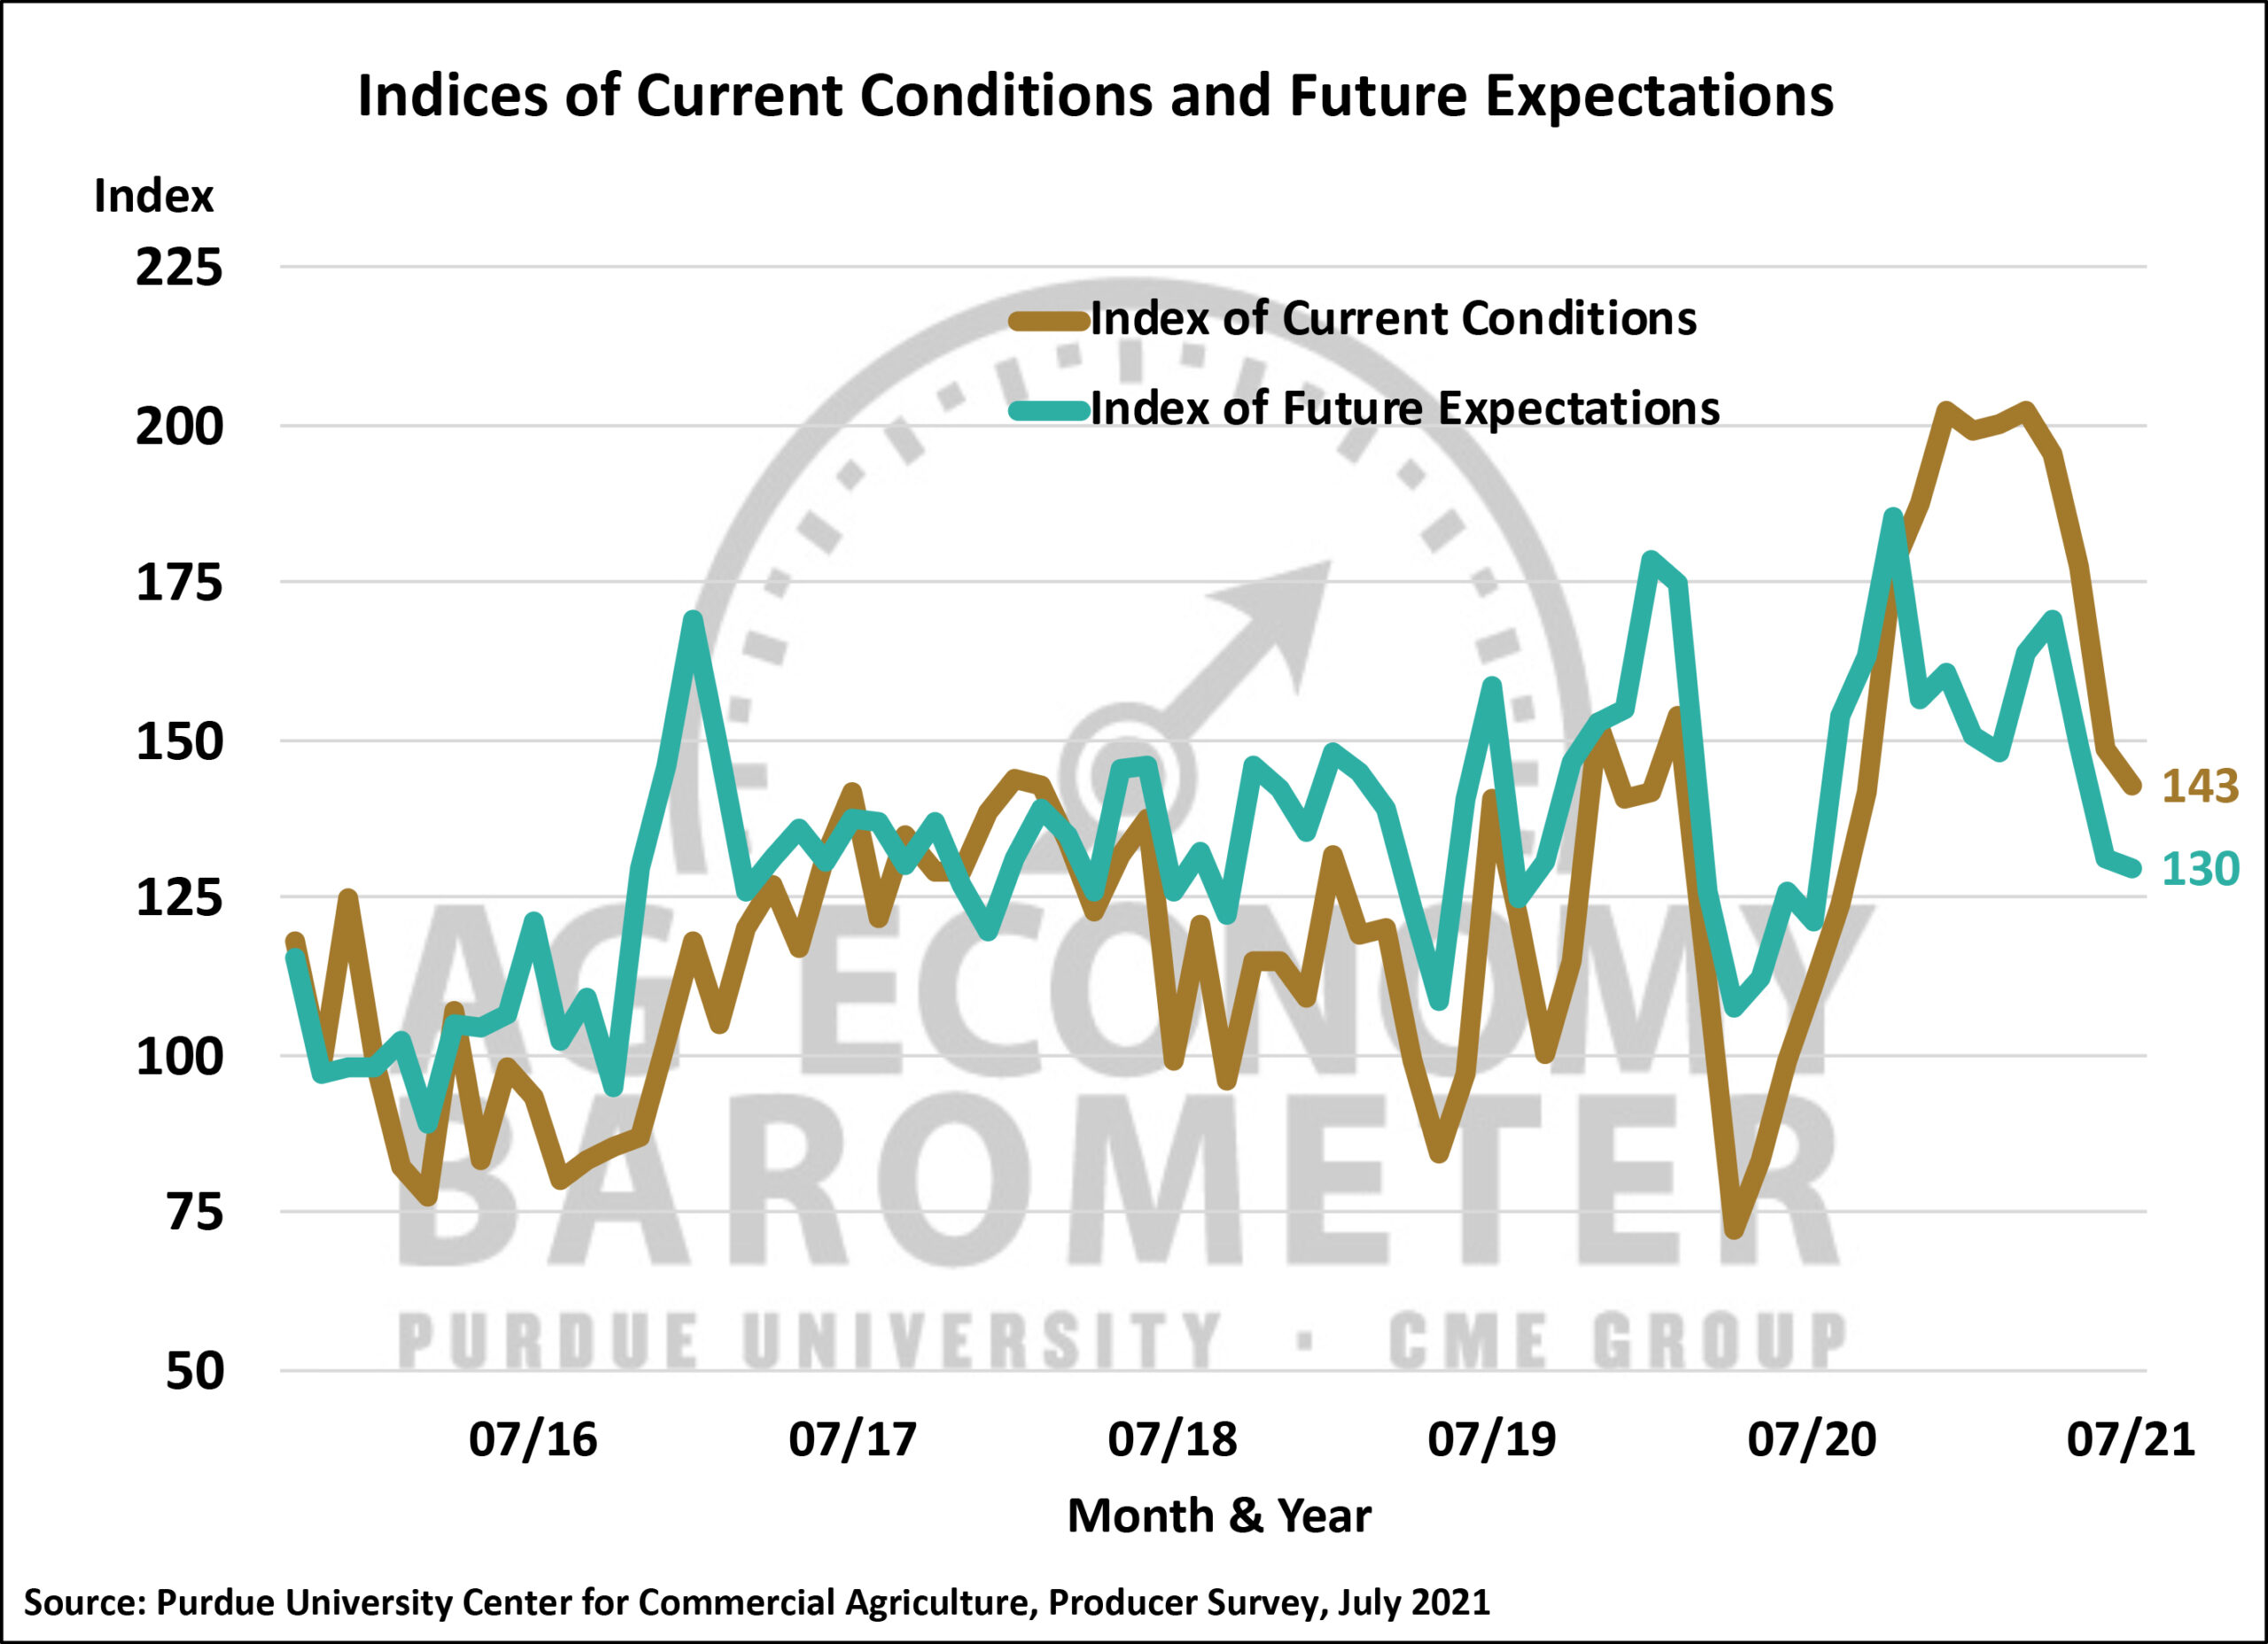
Figure 2. Indices of Current Conditions and Future Expectations, October 2015-July 2021.
Following the 2020 presidential election, the sentiment shift was not nearly as pronounced as in 2016, but there was a dip in sentiment as the barometer declined 9% following the election. The sentiment shift was entirely attributable to weaker expectations about the future as the Index of Future Expectations fell 16% from October 2020 to November 2020 while the Index of Current Conditions, riding the wave of strengthening commodity prices in late 2020, actually rose 5%. A series of questions posed just prior to the election in October 2020 and repeated following the election revealed some of the reasons for the decline in future expectations. Following the 2020 election, producers were much more concerned about the agricultural sector facing more restrictive environmental regulations, higher estate taxes, and higher income taxes than they were just before the election. Producers also expressed concerns that the farm income safety net would be weaker in the future and that support for the ethanol industry would decline.
Farm Capital Investment Index
Similar to the Survey of Consumers’ goal of using sentiment to better understand consumer behavior, the Ag Economy Barometer and its sub-indices try to provide insight into agricultural producers’ investment decisions. The Farm Capital Investment Index is based upon a question posed each month that asks producers whether now is a good time or a bad time to make large investments in their farming operation, in things like buildings and machinery. The index often fluctuates in a band between 40 and 70, but in 2020 the index dipped to a near-record low of 38 in April as the pandemic was unfolding across the U.S. causing producers to lose confidence, in turn leading them to pull back from making long-term investments. But the investment index recovered rapidly during the summer and the fall as commodity prices strengthened, peaking at a record 93 in both December 2020 and January 2021. The strengthening in the investment index coincided with strong U.S. farm equipment sales.
One of the challenges in interpreting the Farm Capital Investment Index is differentiating between producers’ perspectives on purchasing machinery vs. investing in buildings and grain bins. To shed additional light on producers’ perspectives, two new questions were added to the monthly survey. In March 2020 a question that asks producers what their plans are for farm machinery purchases in the upcoming year was added and in May 2021 an additional question that asks producers what their plans are for constructing new farm buildings and/or grain bins in the upcoming year was included in the survey. Although we don’t have a long history for these two new questions, early results are insightful.
After peaking this past winter, the Farm Capital Investment Index began to weaken, dropping 43 points from January to July, which left the index 10 points below its July 2020 reading. Examining responses to the farm machinery purchase question, the percentage of producers planning to reduce purchases compared to a year earlier increased from 36% in the first three months of 2021 to 48% in July. At the same time, the percentage of producers planning to hold their machinery purchases constant declined from an average of 52% in January-March 2021 to 42% in July. It’s obvious that some of the investment index’s weakness was attributable to producers shifting from the “about the same” purchases category to the “lower” purchases category. But that doesn’t explain the entire decline.
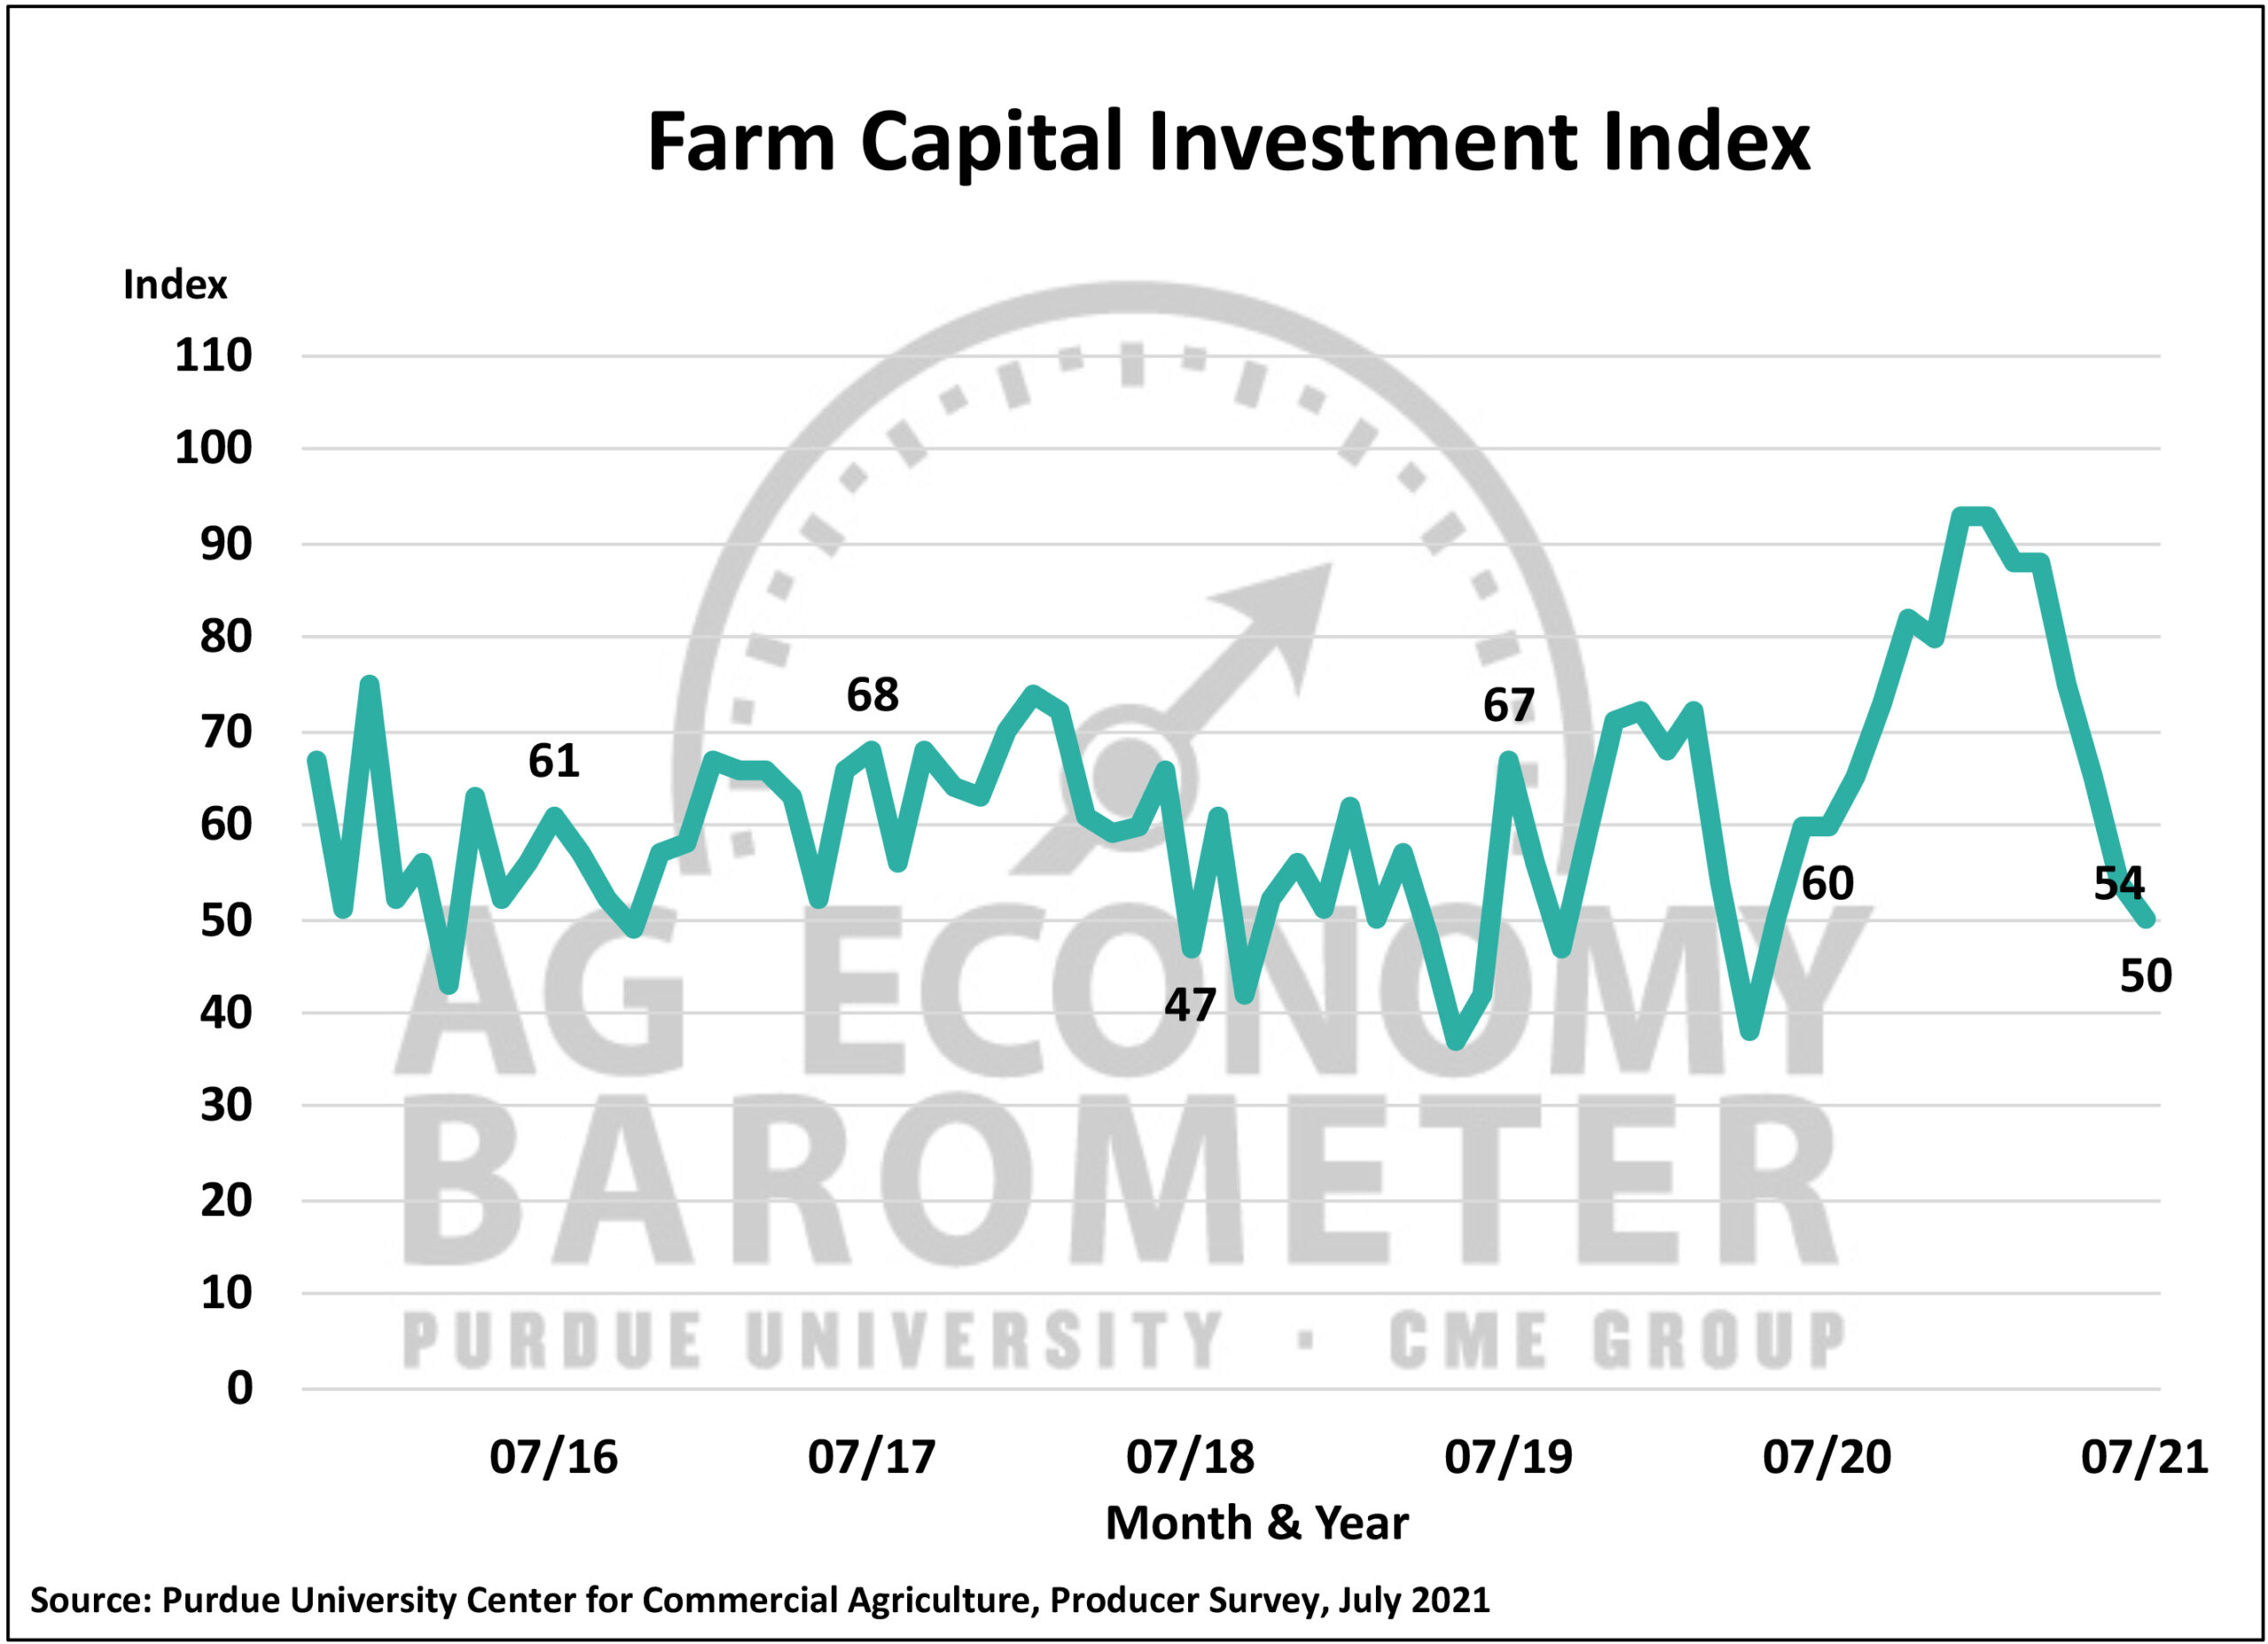
Figure 3. Farm Capital Investment Index, October 2015-July 2021.
The farm building and grain bin construction question was added to the monthly barometer survey to better differentiate producers’ perspectives on machinery investments compared to construction plans. Early responses to the farm building and grain bin construction question indicate that perspectives on new construction vs. farm machinery purchases do indeed differ. In May a majority of producers said construction plans for the upcoming year were lower than a year earlier. That percentage rose in June and in July reached two-thirds of survey respondents saying their construction plans for the upcoming year are lower than a year earlier. This perspective is significantly more negative than the outlook provided by producers regarding their farm machinery purchase plans and helps explain weakness in the investment index.
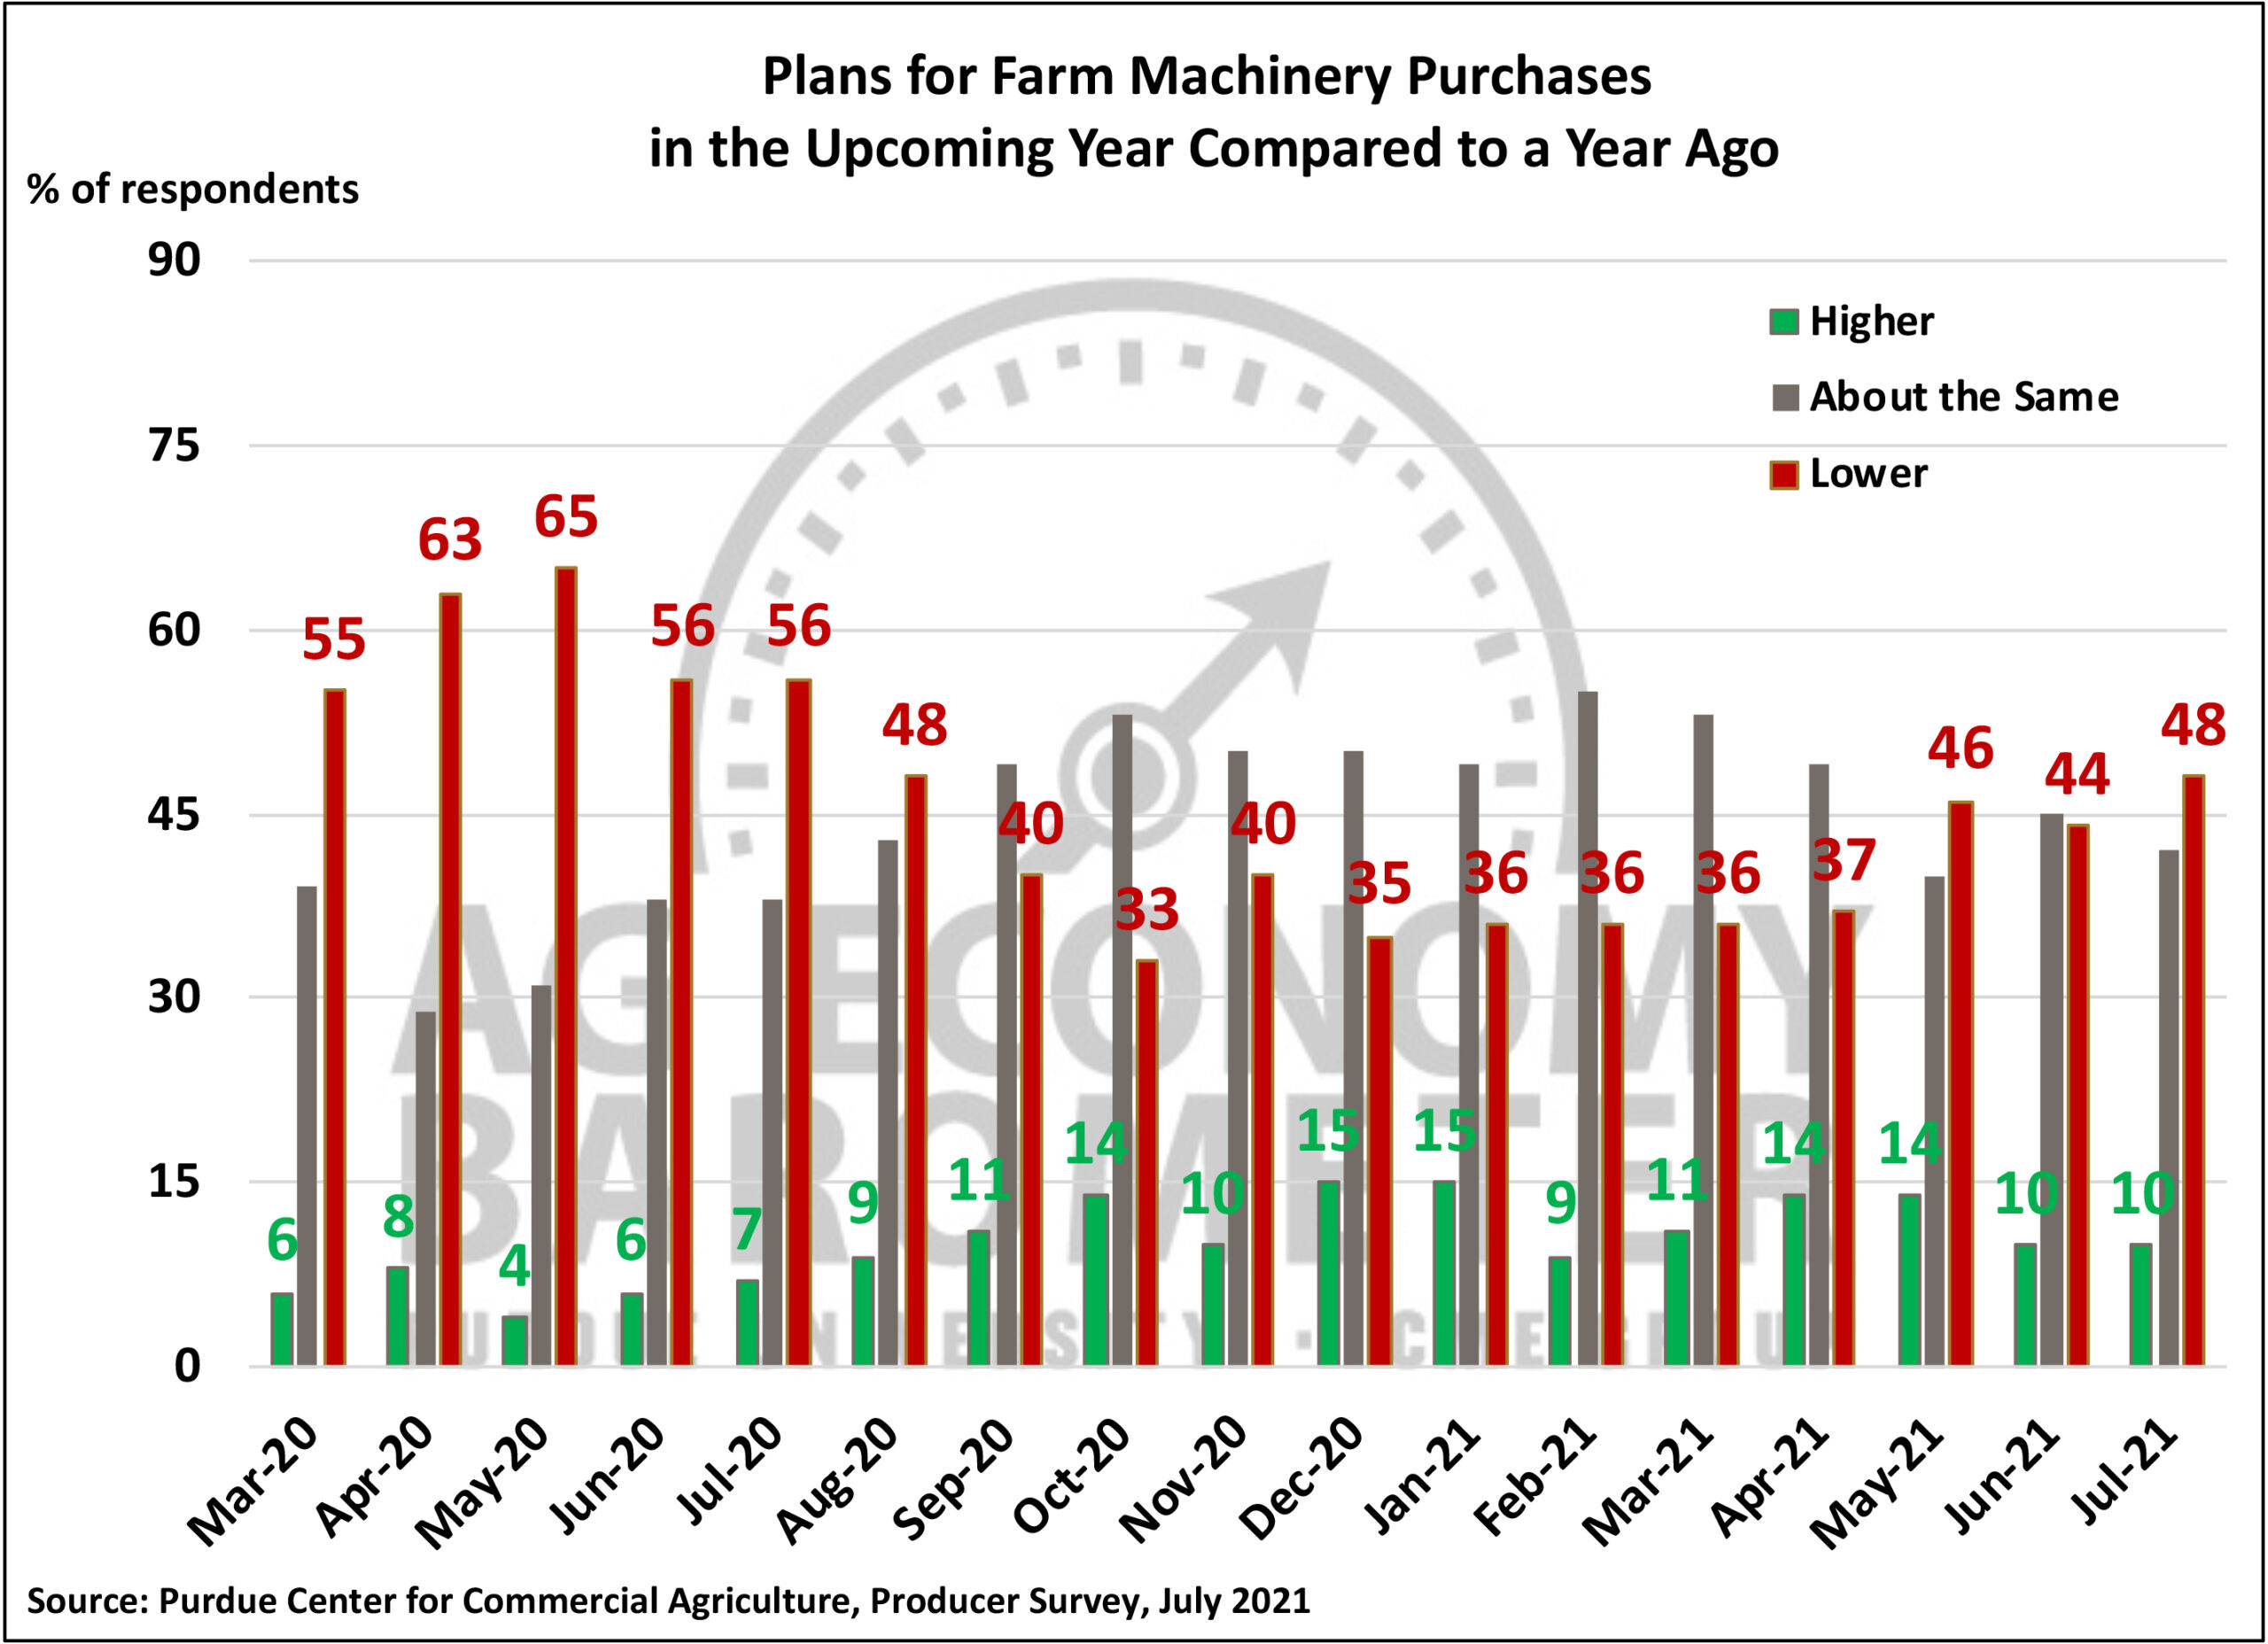
Figure 4. Plans for Farm Machinery Purchase in the Upcoming Year Compared to a Year Ago, March 2020-July 2021.
Is this the whole story? Perhaps not. The investment index results in 2021 are further clouded by widespread supply chain problems leading to long delivery lead times and rising purchase costs. What we don’t know is how much impact these two factors had on farmers’ machinery purchase and new construction plans in 2021. We do know ag producers are concerned about rising farm input prices. Thirty percent of respondents on our July 2021 survey said they expect farm input prices to rise 8% or more in the upcoming year. That’s more than four times the average annual farm input price rise of the last decade.
For more information about the Purdue University-CME Group Ag Economy Barometer, visit the barometer website at: https://purdue.edu/agbarometer where you can subscribe to receive the monthly Ag Economy Barometer report which is released on the first Tuesday of every month.
![]()
![]()
![]()
![]()
![]()
TAGS:
TEAM LINKS:

RELATED RESOURCES
Producers continued to express concern about farm finances as the June Purdue University/CME Group Ag Economy Barometer recorded a 6-point decline in farmer sentiment to 113.
READ MOREUPCOMING EVENTS
We are taking a short break, but please plan to join us at one of our future programs that is a little farther in the future.