Record High Milk Prices: What Lies Ahead?
March 16, 1990
PAER-1990-4
Author: Harold W. Lough, Ph.D., Dairy Research Associate
![]()
![]()
![]()
![]()
![]()
Milk prices in Indiana have reached record highs in recent months. The Order 49 (Indiana Federal Milk Marketing Order) blend price for January 1990 was $15.99 per hundredweight. That was $2.52 per hundredweight over the year-earlier blend price and $2.21 per hundred weight over the blend price of any month before 1989.
These milk price increases were unexpected, as the supply and demand conditions for dairy products had changed little from 1988. U.S. milk production and consumption levels in 1989 were only one-half percent less than those of 1988. High prices were the result of a unique combination of low cheese stocks, high nonfat dry milk sales, and declining milk production per cow in 1989.
Nonfat dry milk prices in March 1989 were attractive to international traders, and heavy export commitments were made. These agreements ultimately tied up enough nonfat to send domestic prices far above international prices. At the same time export agreements were being made for nonfat dry milk, American cheesemakers were experiencing strong domestic sales and low stocks. Cheesemakers evidently decided to rely on spring flush milk production to rebuild stocks rather than bidding milk away from butter-powder operations. These conditions made milk prices highly responsive to even slight milk production decreases.
Ironically, milk production in the United States did decline from year-earlier levels during the last half of 1989. The number of milk cows was about one percent lower in 1989 and the milk production per cow decreased for much of the last half of the year due to higher feed price and lower forage quality.
The reduction in milk production combined with large nonfat dry milk export commitments, low cheese stocks, and heavy demand for cheese set off a scramble for farm milk resulting in rapid increases in dairy product prices and ultimately in milk prices.
Given the current high milk prices, two issues will be addressed:
- How milk prices are set, including the relationship between dairy product prices and the farmer’s milk check, and
- The prospects for future farm milk prices.
Fluid grade milk prices will be discussed since 82% of milk production in Indiana is fluid grade.
Dairy Product Prices
Changes in the price of fluid grade milk originate with changes in prices of the dairy products–hard cheese, butter, and nonfat dry milk. The price of each of these products is determined in a national market.
Hard Cheese. The National Cheese Exchange, located in Green Bay, Wisconsin, is the only central spot market for cheese in the country. It meets every Friday and provides a place for members to buy or sell 40-pound block cheddar, barrel American, and Swiss block cheese. The prices negotiated on Friday provide the basis for nearly all transactions in hard cheese across the United States for the following week. The Exchange price used by federal milk orders is the 40-pound block cheddar.
Butter. The national price of butter is established at the Chicago Mercantile Exchange in the cash butter market. The price used by federal milk orders is for Grade A butter.
Nonfat Dry Milk. The Dairy Division, USDA, reports weekly the prices of high heat, low heat, and Grade A nonfat dry milk. The price used by federal milk orders is the simple average of the three nonfat dry milk products.
Minnesota-Wisconsin Price
The Minnesota-Wisconsin price (M-W) reported monthly by USDA is one of the most widely used measures of changes in milk values. This is an average price for manufacturing grade milk paid by dairy products processors in the two states. However, the M-W is affected when wholesale product prices are close to government support prices. Thus, the M-W price represents national supply and demand conditions for manufactured dairy products, including the impact of USDA price support purchases.
Regulation
Milk prices in Indiana are influenced by two federal programs, milk price supports and milk marketing orders. The intended pricing impact of these programs is on farm milk although the price support program also directly affects the price of dairy products.
Price Support of Milk. The Agriculture Act of 1949 directs the Secretary of Agriculture to support the price of milk. The objective of supporting the price of manufacturing grade milk at an administratively determined price is achieved by USDA’s Commodity Credit Corporation (CCC) purchasing, at announced prices, all the natural cheddar cheese, butter, and nonfat dry milk that is offered to it for sale.
The support price increased throughout the 1970s and reached a high of $13.49 per hundredweight in 1980. It has since declined to $10.10 per hundredweight, effective January 1, 1990. This is the lowest support price for milk since 1978 and the lowest in real prices (including inflation) since 1966.
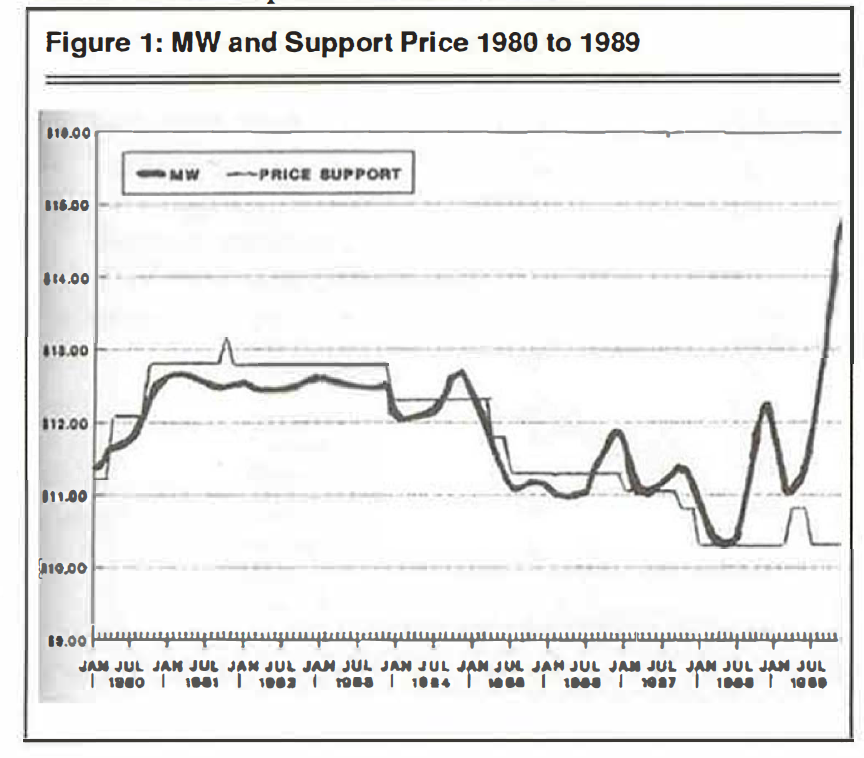
Figure 1: MW and Support Price 1980 to 1989
The Minnesota-Wisconsin prices closely followed the support price through the 1980s until the summer of 1987 (Figure 1). During the last months of 1989 the M-W soared above the support price by over $4 per hundredweight.
Indiana Milk Marketing Order. The 166 million pounds of fluid grade milk produced in Indiana in December 1988 was regulated under six federal milk marketing orders (Chicago, Indiana, Louisville-Lexington-Evansville, Ohio Valley, Southern Illinois, and Southern Michigan). The Indiana order was largest at 128.6 million pounds or 77 percent of the total fluid grade (Edwards and Lough).
Under the Indiana order (as in all federal milk marketing orders) milk is priced each month based on its final use. The final use of fluid grade milk is divided into three classes:
Class I – fluid milk products
Class II – fluid cream, eggnog, yogurt and fluid milk and cream products used to produce cottage cheese, milk shakes and similar products.
Class III – cheese, butter, dry milk, etc.
The class prices for the Indiana order are computed as follows:
Class III price – The Class III price is the basic formula price for the month. The basic formula price is the price of manufacturing grade milk for the month as reported in the Minnesota-Wisconsin (M-W) series.
Class II price – The Class II price is the basic formula price for the second preceding month adjusted by prices of butter, cheddar cheese, nonfat dry milk, and dry whey for the first 15 days of the month.
Class I price – The Class I price is the basic formula price for the second preceding month plus $2.00.
Dairy farmers under the Indiana order receive a weighted average blend price for their milk. This is the Class I price times the proportion of the market’s milk used to produce Class I products, plus the Class II price times the proportion of the market’s milk used to produce Class II products, plus the Class III price times the proportion of the market’s milk used to produce the Class ill products. The proportion of the milk used to produce Class I products (Class I utilization) varies from month to month in a seasonal pattern and as such affects the blend price farmers receive.
Indiana Order Blend Price
Under the Indiana order the steps used to arrive at the monthly milk price take three months. Included in the blend price are the M-W from two months earlier, product prices (for butter, cheese, nonfat dry milk, and edible whey) and market utilization. For example, the January 1990 blend price was determined as follows:
December 5 November M-W announced (Class III price). January Class I determined (as Class I price= November Class III+ $2.00/cwt).
M-W = $14.69 Class I = $16.69
December 15 January Class II computed based on a formula including the November M-W price, and prices for butter, cheddar cheese, nonfat dry milk, and dry whey.
Class II= $15.43
February 1 Producers received payments for milk sold during first 15 days of January based on December Class III price.
February 12 Milk utilization for January was announced.
Class I = 63% Class II = 18% Class III = 19%
February 14 Last day to announce blend price for January. Blend= $15.99
February 18 Must settle by this date for the remainder of the January producer obligation at the blend price.
The blend price may then be adjusted in several ways. First, location adjustments of $.20-$.40 per hundredweight may be deducted for milk received by a plant in roughly the northern one-third of lndiana. In addition, an advertising and promotion fee of $.15 per hundredweight is currently deducted. The handler may deduct hauling charges and adjust payment based on the fat test.
The blend price is a minimum price. The Indiana Cooperative Milk Producers Federation, Inc., has negotiated an over-order premium with handlers to more fully reflect market conditions.
Dairy Prices in 1990
The biggest price change expected in 1990 is a return to more normal markets. The declines from current prices could be dramatic.
Prices of dairy products have already gone down from their high levels of 1989. Forty-pound block cheddar cheese at the National Cheese Exchange, which reached a high of $1.54 1/2 per pound the last of November, declined to $1.26 3/4 per pound by February 8. Grade A nonfat dry milk, which was $1.80 per pound at its November peak, was $.84 1/2 per pound February 8. The export market for nonfat dry milk is weaker and the CCC again started buying stocks of this product in 1990.
As a result, the January M-W fell to $13.94 per hundredweight, off $.99 from the December high. The February MW fell $1.72 to $12.22 per hundredweight. The M-W has declined 18% in the first two months of 1990 and is expected to decline further in March. This broke 10 straight months of increases. As a result, a stronger-than-seasonal decline in milk prices is expected this spring. The farm price into the flush period could decline by $2 to 3 per hundredweight, from year-earlier levels. For the year, the U.S. all-farm milk price is expected to be $12.30 per hundredweight which is $1.00 lower than 1989 (slightly above milk prices for 1988).
As a final note, the unusual dairy prices of late 1989 resulted in a 36% M-W price increase from March to December. The M-W price was 41% above the $10.60 per hundredweight support price in December. A search for similar price movements in previous years reveals only one, a 47% increase in the M-W from March 1973 through March 1974. At that time the M-W reached 54 percent above the support price of $5.29 per hundredweight. In the following three months of 1974, a 23% price decline brought the MW down to $6.31 per hundredweight. However, during that same period in 1973-74, the support price was administratively increased from $5.29 to $6.57 per hundredweight. As expected, government removals of dairy products increased (following little or no removals the previous year), and when the price decline reached the support price, a rebound in milk prices occurred through the rest of 1974.
The farm milk price is still expected to be a market price, above the support level, for 1990. But unlike the 1973-74 price movement during which there was a $1.28 per hundredweight increase in the support price, the recent support level was lowered $.50 per hundredweight as of January 1, 1990. Milk producers should keep in mind that any break in prices face a price support cushion that is now sharply lower than current prices.
Those interested in receiving reports on milk and product price series mentioned above can receive publications from:
Cheese, butter, and nonfat dry milk wholesale prices
Dairy Market News P.O. Box 8911
Madison, WI 53708
Minnesota-Wisconsin Price
Market Information Branch USDNAMS/Dairy Division Rm. 2753
P.O. Box 96456
Washington, D.C. 20090-6456
Indiana Order Utilization, Class II Price, and Uniform Price
Chicago Regional Marketing Area 800 Roosevelt Road
Building A, Suite 200
Glen Ellyn, IL 60137
Reference
Edwards, P. B. and H. W. Lough. “Changes in Indiana Producers and Milk Suppliers for Federal Order Markets, December 1988.” Dairy Marketing Information Series, Purdue Cooperative Extension Service, Purdue University, December 1989.
![]()
![]()
![]()
![]()
![]()
