December 6, 2022
U.S. Farm Sector Capital Expenditures
by: Michael Langemeier
![]()
![]()
![]()
![]()
![]()
In response to relatively stronger net farm incomes, U.S. farm sector capital expenditures have increased dramatically in the last three years. In 2019, farm sector capital expenditures were approximately $30.1 billion. The forecasted value for 2022 is $44.2 billion. This article examines trends in capital expenditures and compares capital expenditures to capital consumption (i.e., economic depreciation).
Trends in Real Capital Expenditures
Figure 1 illustrates real U.S. farm capital expenditures and consumption from 1973 to 2022. Capital expenditures and consumption are expressed in 2021 dollars in figure 1. Capital expenditures include tractors, trucks, autos, machinery, buildings, land improvements, and miscellaneous capital expenditures. Capital consumption represents the declining balance of capital stock or economic depreciation. Using figure 1, three large increases in capital expenditures and two large decreases in capital expenditures have occurred since 1973. The first increase occurred during the 1973 to 1979 period. During this period, real capital expenditures increased from $49.4 billion in 1973 to $62.3 billion in 1979. The 1979 peak represents the highest annual capital expenditures level since 1973. The second increase occurred during the 2009 to 2014 period. During this period, real capital expenditures increased from $29.0 billion to $50.3 billion. We are currently experiencing the third large increase; real capital expenditures have increased from $31.6 billion in 2019 to a projected value of $41.7 billion in 2022. The first large decrease in real capital expenditures occurred from 1979 to 1986. Real capital expenditures declined approximately 71 percent from the 1979 peak to the 1986 trough. The second large decrease occurred from 2014 to 2018. Real capital expenditures declined approximately 39 percent during this period.
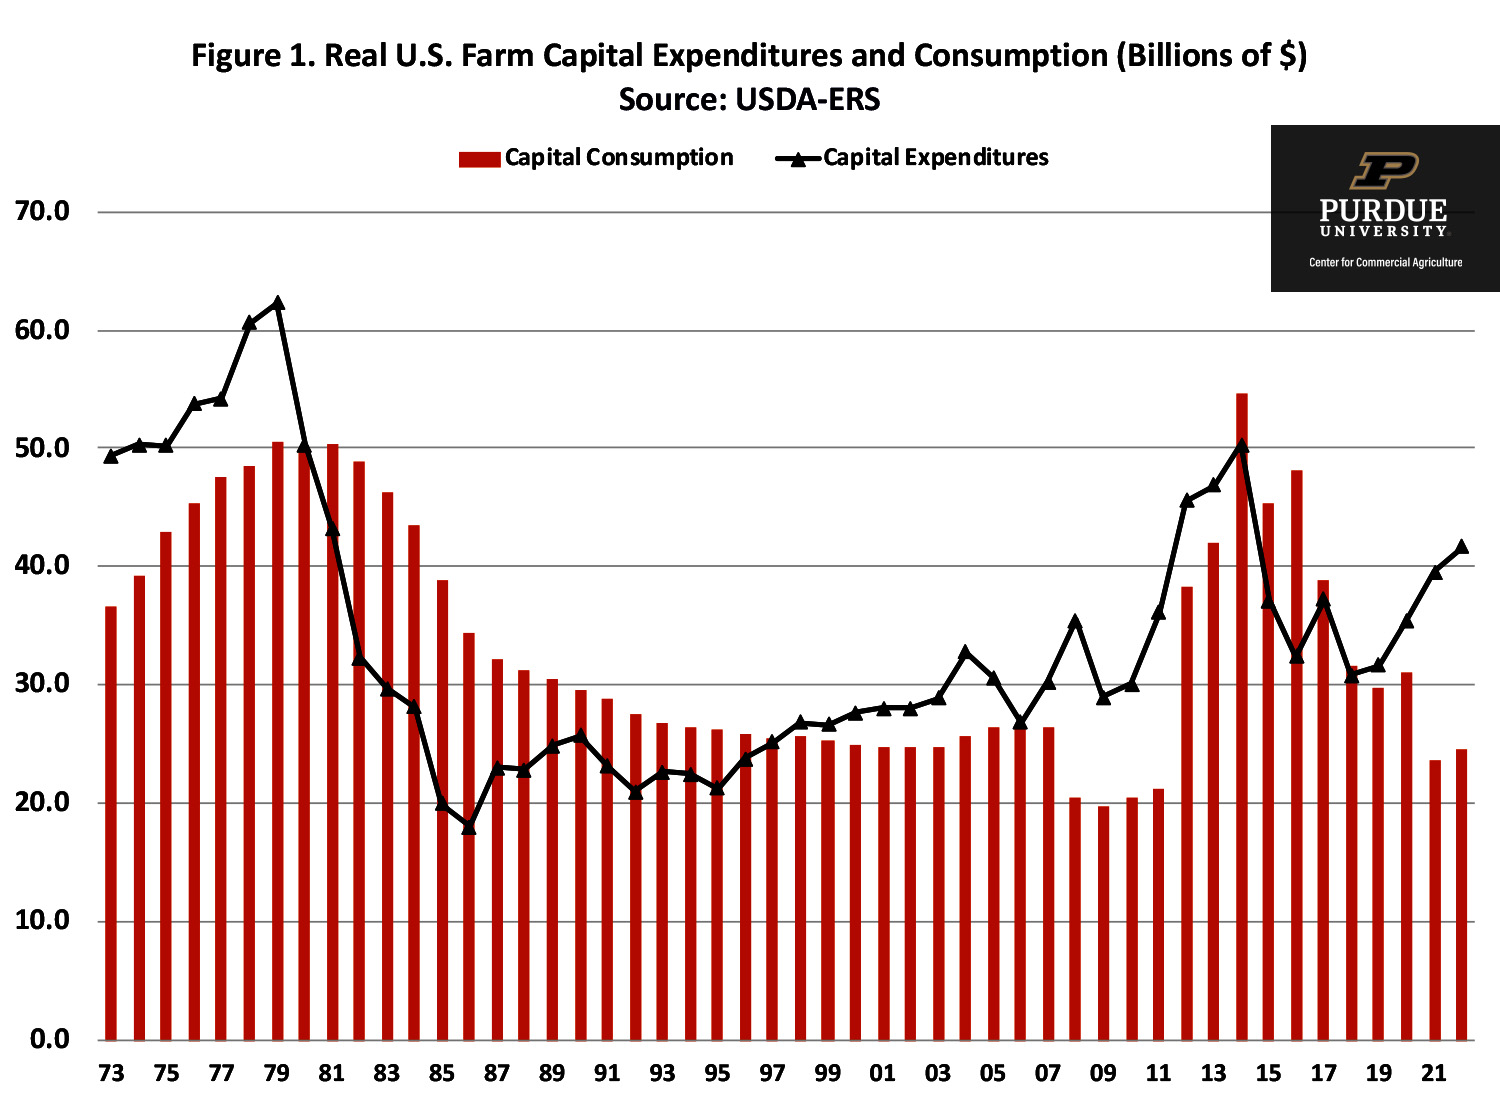
Figure 1. Real U.S. Farm Capital Expenditures and Consumption (Billions of $)
Source: USDA-ERS
An alternative way to examine trends in capital expenditures and consumption is to compute the ratio of capital expenditures to capital consumption. This ratio is depicted in figure 2. A ratio above 1 indicates that capital is being replaced at a rate higher than economic depreciation. Conversely, a ratio below 1 indicates that economic depreciation is larger than capital replacement. The average ratio over the 1973 to 2022 period was 1.048, which indicates that on average capital replacement exceeded capital consumption. The annual ratio appears to be quite cyclical. The ratio of capital expenditures to capital consumption was above 1 from 1973 to 1980, below 1 from 1981 to 1997, above 1 from 1998 to 2013, below 1 from 2014 to 2018, and above 1 since 2019. The lowest annual ratios occurred during the 1980s farm financial crisis. As noted above there was a substantial decrease in capital expenditures in the 1980s. At the trough (i.e., 1986), the capital expenditures to capital consumption ratio was only 0.52. The three highest ratios occurred in 2008 (1.73), 2011 (1.70), and 2022 (1.70). Notice the inclusion of 2022 in the ranking of the highest ratios. The ratio of capital expenditures to capital consumption increased from 1.06 in 2019 to 1.67 and 1.70 in 2021 and 2022, respectively. Obviously, farms have used a portion of their strong net farm incomes in the last few years to replenish their capital stock.
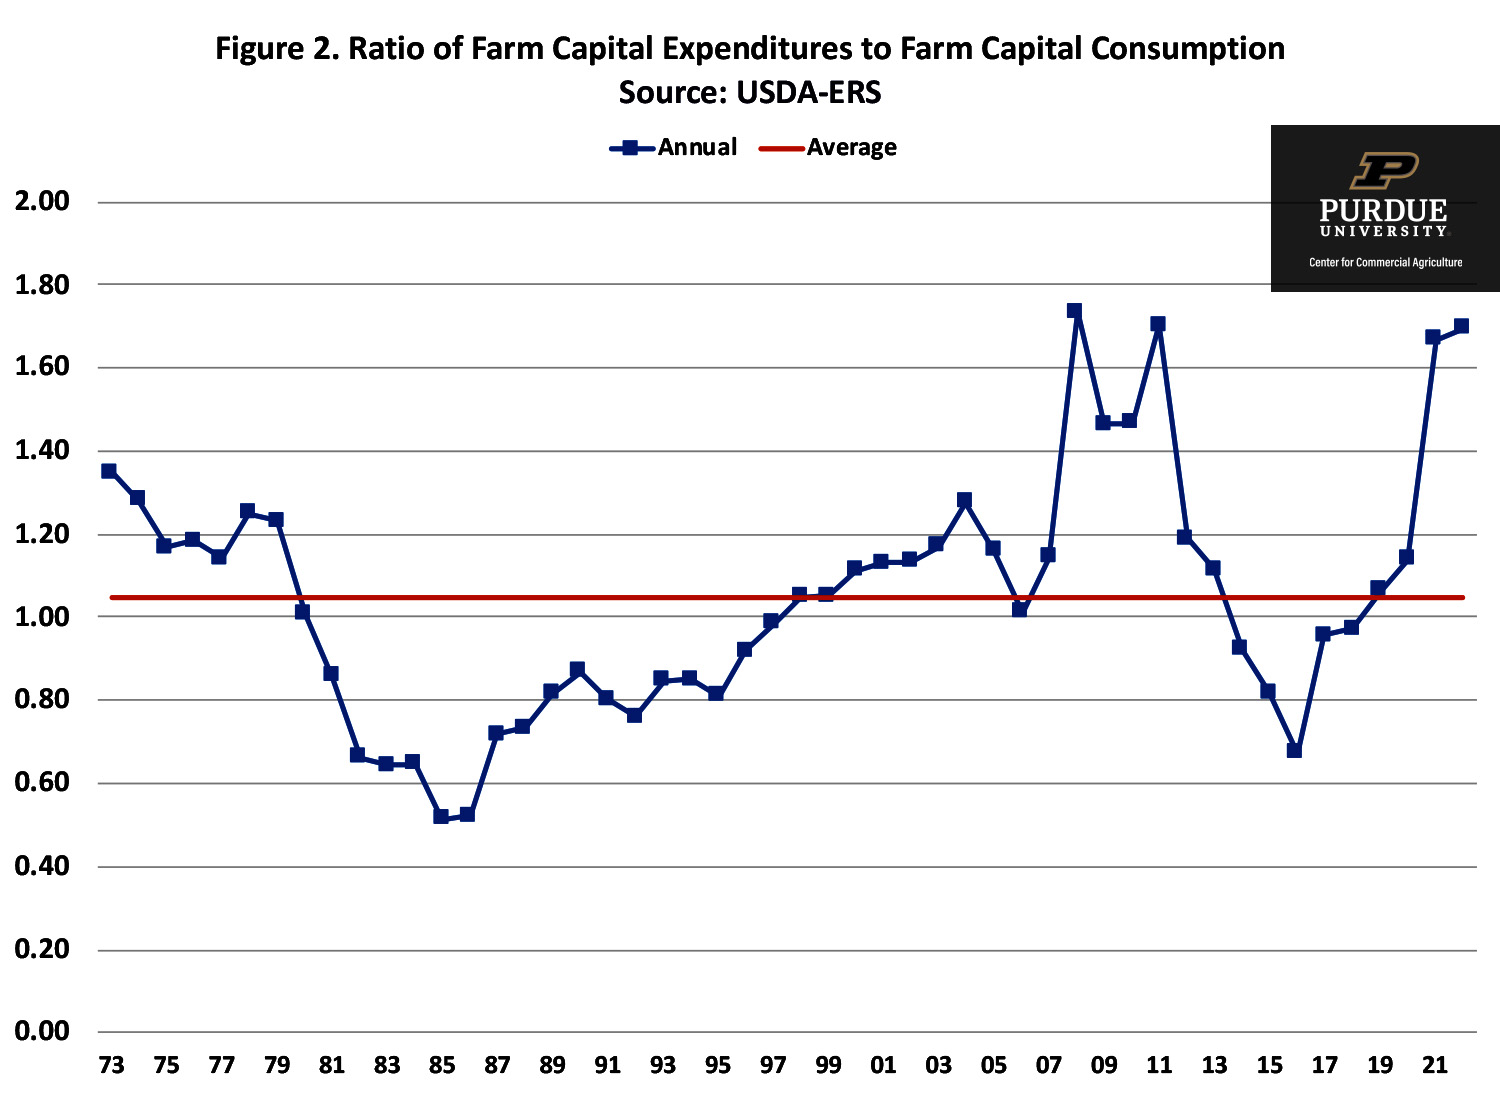
Figure 2. Ratio of Farm Capital Expenditures to Farm Capital Consumption
Source: USDA-ERS
The discussion above applies to total capital expenditures. The changes in expenditures during the last four years have differed among expenditure categories. Specifically, increases have been larger for tractors and machinery than they have been for autos, trucks, buildings, and land improvements.
Capital Spending Diffusion Index
The Federal Reserve Bank of Kansas City has reported a capital diffusion index on a quarterly basis since the second quarter of 2002. This diffusion index is computed by asking bankers whether capital spending during a quarter was higher than, lower than, or the same as in the year-earlier period. The index is then computed by subtracting the percentage of bankers who responded “lower” from the percentage who responded “higher” and adding 100. An index below 100 indicates that capital spending is relatively lower than the year-earlier period. Conversely, an index above 100 indicates that capital spending is relatively higher than the year-earlier period.
Figure 3 reports the capital spending diffusion index from the second quarter of 2002 to the third quarter of 2022. The index was below 100 from the second quarter of 2013 through the fourth quarter of 2020, and has been above 100 since the first quarter of 2021. The diffusion index was 108 for the third quarter of 2022.
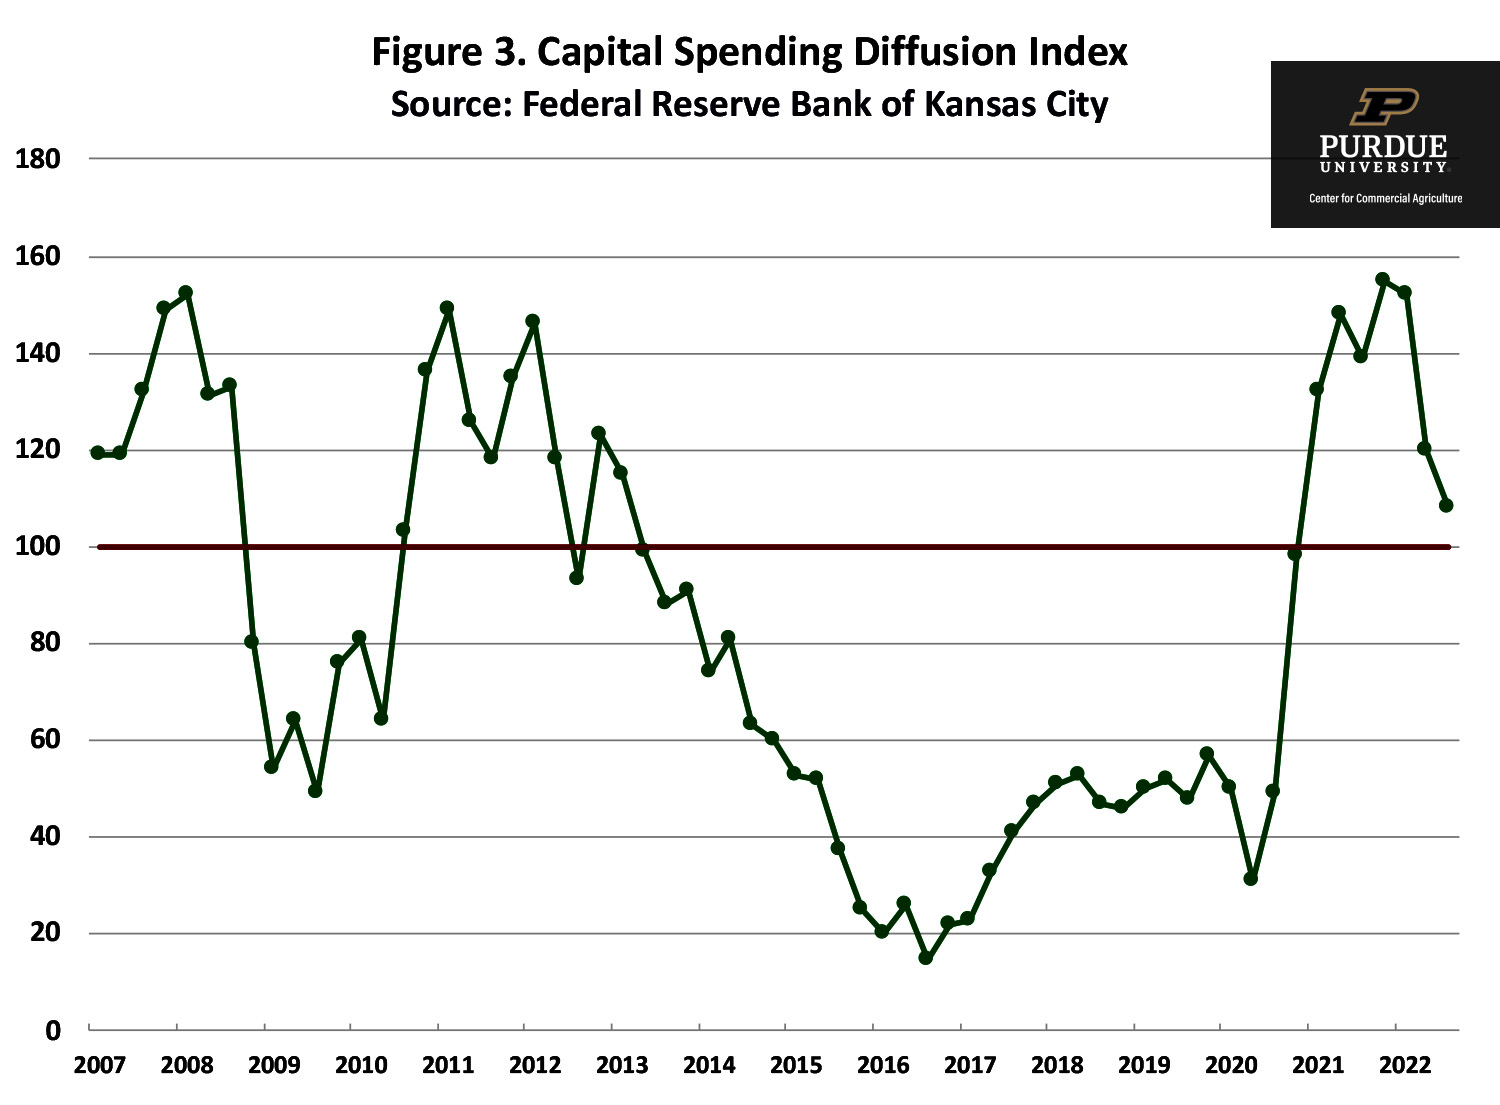
Figure 3. Capital Spending Diffusion Index
Source: Federal Reserve Bank of Kansas City
Conclusions
In response to relatively strong net farm income during the last three years, real capital expenditures have increased approximately 32 percent. The projected ratio of capital expenditures to capital consumption is currently 1.70, indicating that capital expenditures are substantially above replacement rates. The capital spending diffusion index reported by the Federal Reserve Bank of Kansas City has been above 100 since the first quarter of 2021, providing further evidence that capital expenditures have been relatively strong the last few years. Whether capital expenditures continue to increase depends on future net farm income prospects as well as factors such as interest rates, machinery inventories, and machinery and building prices. A recent survey suggests that farmers are concerned about high machinery prices, rising interest rates, and the uncertainty of farm profitability (Mintert and Langemeier, 2022). These concerns could dampen capital expenditures in the upcoming year.
References
Federal Reserve Bank of Kansas City. “Strong Farm Economy, but Interest Expenses and Drought Intensify Pressures.” November 10, 2022.
Mintert, J. and M. Langemeier. “Ag Economy Barometer Declines Again, Producers Express Concern About Interest Rate Policy.” Purdue/CME Group Ag Economy Barometer, November 1, 2022.
USDA-ERS. “Farm Income and Wealth Statistics.” www.ers.usda.gov/data-products/farm-income-and-wealth-statistics/, accessed November 14, 2022.
![]()
![]()
![]()
![]()
![]()
TAGS:
TEAM LINKS:

RELATED RESOURCES
UPCOMING EVENTS
We are taking a short break, but please plan to join us at one of our future programs that is a little farther in the future.