Impacts of Mexico’s Proposed GMO Ban for US and Global Corn Trade
May 15, 2024
PAER-2024-20
Dewey J. Robertson, Graduate Research Assistant; and Roman Keeney, Associate Professor of Ag Economics
Introduction
Genetically modified organisms (GMOs) and other genetically engineered (GE) foodstuffs have been a major point of controversy in agricultural trade for the better part of three decades. Though GMO crops produce higher outputs at lower costs with less land use, many worry about the potential threat that import GMO commodities pose to culinary heritage, domestic producers, and human health (Touyz, 2013; Chiang et al., 2005; Zhang et al., 2016; Bellon, 2006). As the United States is a major producer of GMO commodities, we are motivated in this preliminary study to analyze the economic impacts of a Mexican ban on GMO commodities for the US, Mexican, and world corn markets.
In late 2020, President Lopez-Obrador of Mexico signed a decree banning genetically modified (GM) corn and the use of herbicide glyphosate in the production of food for human consumption. At the time of writing, the current version of this presidential initiative identifies the effective date as January 31, 2024. Mexico’s agricultural ministry has identified a domestic agenda concordant with the GM ban that calls for increasing domestic production to replace an aimed 30-40% reduction in import purchases. In a sobering realization of Mexico’s dependency on imported US corn, the executive decree has been modified multiple times, pushing back its effective date and narrowing the definition of GM corn in the human food system. At current, the ban is not expected to be applied to corn intended for animal feed and industrial use, provided that heightened protocols for keeping corn out of food processing are maintained (Reuters, 2023).
The US is one of the world’s largest exporters of corn, commanding roughly 30% of the global corn market. Mexico has become the top destination for US corn exports in the past two decades. In 2022, the USDA recorded that 15.4 million metric tons went to Mexico, accounting for 26.6% of total exported volume (USDA FAS GATS, 2023). Imported corn is mainly utilized in the growing beef industries to be used as feed. Current beef production levels have left Mexico dependent on imported US GMO corn.
Restrictions on US GM corn into Mexico represent a novel case for quantitative analysis. This bilateral trade relationship has all the characteristics you might expect from two countries that have been party to relatively free trade for 30-plus years. According to GTAP’s version 11 database (Aguiar et al., 2023), more than 90% of Mexico’s imported corn is from the US, and those imports are nearly one-third of Mexican demand for corn across all uses. From the US perspective, corn is a major agricultural export, and 20-25% of US exports are bound for Mexico. The novelty of this case lies in this high integration of the US and Mexico’s corn markets. The previous analysis of GM trade frictions focused on countries that applied bans or restrictions as new GM traits were being developed or adopted. As of 2020, some 93% of US corn production is characterized as GM production (USDA ERS, 2023).
Our stylized study characterizes the economic effects of a Mexican GMO ban. With US trade to Mexico being restricted, we expect to see some level of increase in domestic production as well as increased imports from other countries. We are interested to quantify the expected changes in output and price in both the US and Mexico, as well as in other corn-exporting countries such as Brazil and Argentina.
Methods
The agricultural trade literature offers some insight into the case of the US-Mexico corn trade. Even under modest restrictions, the increased costs of labeling, traceability, and certification create supply-side distortions (Vigani & Olper, 2012). As GM adoption has increased and policies have diverged, methods for indexing relative openness have been developed to summarize policy differences by country. Empirical analysis shows that if the US faces a +1% change in GM restrictiveness – as measured by Addey’s GMO index – for corn, the expected result would be -$72 million in lost exports (Addey, 2021). Various partial equilibrium studies have analyzed sanitary and phytosanitary restrictions (SPS) on agricultural imports, many of which have focused on the EU import case. The policy literature on the use of SPS measures as a substitute for protecting domestic industries as opposed to valid instruments of managing risk to the food system is similarly robust (Santeramo, 2020).
The current research leaves aside the question of motivation for a GM ban, focusing squarely on key economic outcomes that arise from a series of counterfactuals that require reductions in US-sourced corn in Mexico. Modeling these questions requires a model that captures the ability of Mexico to replace corn imports with either domestic production or imports that can be certified non-GM. This will drive impacts across the Mexican agricultural economy, as replacing US-sourced corn with domestic production will require considerable expansion that requires farmland, labor, and capital currently employed for other uses. Some of the lost US imports may be replaced by alternative exporters, though many countries that produce surplus corn for export have widespread GM adoption. For the US economy, the quantitative analysis must be able to track how much reduced corn exports to Mexico leads to exporting elsewhere versus shifting production into alternative crops. In both economies, tracking the domestic price and farm incomes will be key to understanding what follow-on farm policies may be triggered in the wake of the Mexican GM ban.
A computable general equilibrium (CGE) model of the global economy with detailed agricultural sectors linked by the economic resource base (primarily land) and fully specified bilateral trade that includes border protection measures is the obvious platform for the quantitative investigation. Our stylized analysis adopts the standard GTAP framework with a series of experiments that consider tiered reductions in the US-to-Mexico corn trade. Our stylized approach does not distinguish GM products separately from non-GM as this is not a separation currently available in the GTAP data. Assembling a consistent data set on GM corn sectors for Mexico and major exporters is beyond the scope of the current study, where our aim is to identify the primary and secondary economic responses in agricultural production and trade of GM product.
Experiment design and results
The applied policy mechanism for eliminating US GM imports in Mexico remains unspecified and has proven to be a moving target as the presidential decree has been modified (Associated Press, 2023). As a result, we construct a series of experiments that simply ramp up reductions in imports by Mexico of grains sourced from the US. The model outputs will then give us a series of economic adjustments to increasingly restrictive definitions of the Mexican GM ban.
Our modeling was conducted using the GTAP CGE modeling framework (Aguiar et al., 2023; Corong et al., 2017). The standard GTAP Model is a multiregional, multisector computable general equilibrium model that operates under the assumptions of perfect competition and constant returns to scale. The accompanying GTAP database describes bilateral trade patterns, production, consumption, and intermediate use of commodities and services.
Using this CGE framework, we aggregate the GTAP model to 11 regions and 18 commodities, as listed in Table 1. This scheme selects regions that are significant in grain trade as well as maintaining as much farm and food production detail as the GTAP database allows. The results come from five counterfactual scenarios that represent different levels of reduction in US grain imports to Mexico. We model this as an import quota restriction – with quota rents accruing to the Mexican economy – varying from 15% to 75% in 15 percentage point intervals.

Table 1. Model primary factors, regions, and commodities
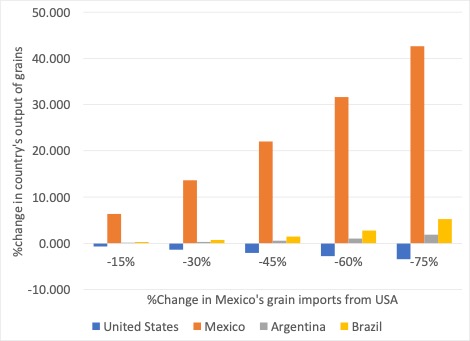
We find that increasing the restriction of US imports to Mexico leads to a marginal decrease in grain production in the US. The small scale of reductions is expected as the US is a large producer and can shift exports elsewhere. The most dominant result we see is the increase in Mexican grain production. The increase in domestic production will have a spillover effect as Mexico will need to convert other factors of production to the grains industry. This will cause a larger impact on Mexico than it will on any other market involved. Figure 1 below reports the output response in the US and Mexico as well as other large corn producers, such as Brazil and Argentina. As import quotas for US grains become more stringent, we see that reduced US imports are replaced primarily by increased domestic production. We expect the US to reduce grain outputs while other global producers slightly increase exports to Mexico.

Figure 1. Grain output changes by country for different shock levels; select countries
Source: Authors’ model results with GTAP v7 model and GTAP v11 database, standard versions.
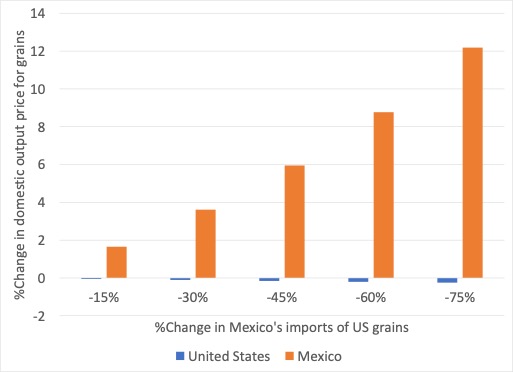
These shifts in output lead to price changes in both US and Mexican corn markets, with the largest impact appearing in Mexican markets. As imports from the US fall and domestic production replaces them, increasing quantities of agricultural resources will need to shift to grain production, raising production costs and leading to higher prices. The opposite effect occurs in the United States, with reduced output releasing land and other resources to alternative uses. Under the most drastic corn import ban we consider (i.e., a 75% reduction in US-sourced grains by Mexico), we see grain prices in Mexico increase by 12% in Figure 2. These price increases for grains in Mexico will attract new importers that were previously priced out of the market due to either transport costs or preferential trade relations with the United States.

Figure 2. Domestic grain price changes, USA and Mexico
Source: Authors’ model results with GTAP v7 model and GTAP v11 database, standard versions.
The results of our same five experiments are reported in Table 2, outlining the changes in US million dollars of Mexican imports for each level of shock. Notably, increased imports from Brazil complement the increased domestic production to meet Mexico’s grain demands. The table shows that a thirty percent reduction in US-sourced grains increases imports from Brazil by more than $100 million, replacing about fifteen percent of the reduced US grain import.

Table 2. Import changes of grain in Mexico by source, $US millions
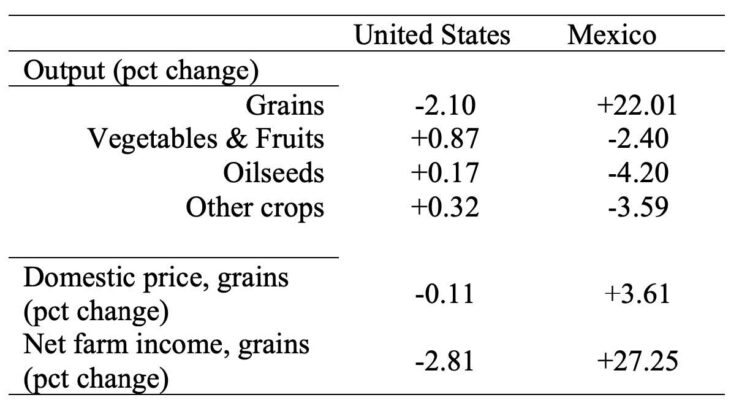
We focus on the thirty percent shock level in Table 3 to examine some sector-level results, including the change to farm income in the grains sector. For the US, we see that grain output falls by two percent as Mexico reduces imports. Output in fruit and vegetables, oilseeds, and other crops increases as land and capital are released to other uses. The price change to grains in the US is moderated by finding new export destinations and being able to shift production, but we estimate a farm income loss of -2.81 percent specific to the grains sector. These results are mirrored in Mexico, where grain outputs increase by more than twenty percent and cause a reduction in other sectors that use farmland. Bidding that land into grain production raises land values and, ultimately, grain prices, with an estimated farm income change of +27 percent for the grain sector.

Table 3. Select agricultural sector results from a 30 percent reduction in US grain imports by Mexico
Discussion and Conclusions
We use the GTAP model and data to explore responses to a Mexican GM ban in North American grain markets. As the actual Mexican policy application remains a moving target, we use a stylized approach using a variety of counterfactual scenarios to understand the follow-on effects and their scale. Model results provide both insight into the market implications of the policy and a sense of direction for refining model estimates. The GM ban will reduce US corn imports, the majority of which the model indicates will be replaced with domestic production. With skepticism to Mexican production capacity to match model predictions, empirical questions are raised about the model’s ability. Further study is needed to determine more accurate Mexican grain supply elasticity. An accurate representation of Mexican supply elasticity will refine model estimates to more accurately predict where the US import replacement will be sourced from. To more fully understand to what extent increased imports from Brazil and Argentina are valid, considerations of GM prevalence that exist in other grain shipments must be studied as well.
Our model results indicate that a Mexican ban on GM products would prompt policy responses in the US. There would likely be some form of tariff retaliation or ban on Mexican products coming to the US. Additionally, lost income to US grain producers would likely prompt government income support payments. Mexican markets for other grain exporters, such as Brazil and Argentina, become more attractive with a reduction in US market share. It would be likely that policies that gain and maintain market share in the Mexican economy would be prioritized.
Leaving aside the legal questions that will ultimately be decided under the auspices of USMCA as an economic mechanism, the proposed ban is an effective protectionist policy that should promote domestic grain production. Increased domestic production with increased domestic price will lead to a large net income increase for Mexican producers at the expense of the US grain sector, where a smaller net income decrease is seen.
References
Addey KA. (2021). The cost of partners’ genetically modified organisms regulatory index on U.S. corn and soybean exports. Food Energy Security, 10:e265. https://doi.org/10.1002/fes3.265
Aguiar, A., Chepeliev, M., Corong, E. & van der Mensbrugghe, D. (2022). The GTAP Data Base: Version 11. Journal of Global Economic Analysis, 7(2), 1-37. Retrieved from https://www.jgea.org/ojs/index.php/jgea/article/view/181
Associated Press. (2023, August 17). US escalates trade dispute with Mexico over limits on genetically modified corn. Voice of America. https://www.voanews.com/a/us-escalates-trade-dispute-with-mexico-over-limits-on-genetically-modified-corn/7230284.html
Bellon, M., Berthaud, J. (2006). Traditional Mexican agricultural systems and the potential impacts of transgenic varieties on maize diversity. Agriculture and Human Values 23, 3–14. https://doi.org/10.1007/s10460-004-5861-z
Corong, E. L., Hertel, T. W., McDougall, R., Tsigas, M. E., & van der Mensbrugghe, D. (2017). The Standard GTAP Model, Version 7. Journal of Global Economic Analysis, 2(1), 1–119. https://doi.org/10.21642/JGEA.020101AF
Garrison, C. (2023, March 8). Explainer: What is the US-Mexico GM corn dispute about? Reuters. https://www.reuters.com/markets/commodities/what-is-us-mexico-gm-corn-dispute-about-2023-03-08/
Santeramo, Fabio Gaetano. (2020, July 1). Trade Effects of SPS Measures in Regional Trade Agreements – IATRC Commissioned Paper 10.13140/RG.2.2.35856.02566
Touyz LZ. (2013). Genetically modified foods, cancer, and diet: myths and reality. Current Oncology, 20(2), 59–61. https://doi.org/10.3747/co.20.1283
USDA, Economic Research Service using data from USDA, National Agricultural Statistics Service (NASS), June Agricultural Survey as published in the NASS report Acreage (various years), available on the NASS website. USDA ERS – Adoption of Genetically Engineered Crops in the U.S. https://www.ers.usda.gov/data-products/adoption-of-genetically-engineered-crops-in-the-u-s/
Vigani, M., Raimondi, V., & Olper, A. (2012). International trade and endogenous standards: the case of GMO regulations. World Trade Review, 11(3), 415–437. https://doi.org/10.1017/s1474745612000262
Zhang, C., Wohlhueter, R. M., & Zhang, H. (2016). Genetically modified foods: A critical review of their promise and problems. Food Science and Human Wellness, 5(3), 116–123. https://doi.org/10.1016/j.fshw.2016.04.002
