April 17, 2025
Changes in Corn and Soybean Profitability (Dec ’24 – Apr ’25)
by Michael Langemeier


Due to changes in relative production costs and crop prices, the relationship between corn and soybean profitability in Indiana for 2025 has changed dramatically in the last few months. The impact of changes in relative costs is minor compared to the impact of changes in relative crop prices, which have been impacted by revised USDA yield estimates in the January 2025 WASDE report and the potential threat associated with tariffs. This article illustrates budget information from projections made in December, January, February, and March, and April; and illustrates the differences in net return estimates and the soybean to corn price ratio during this period. Rather than changing planting intentions, this article is meant to illustrate changing net return prospects for corn and soybeans.
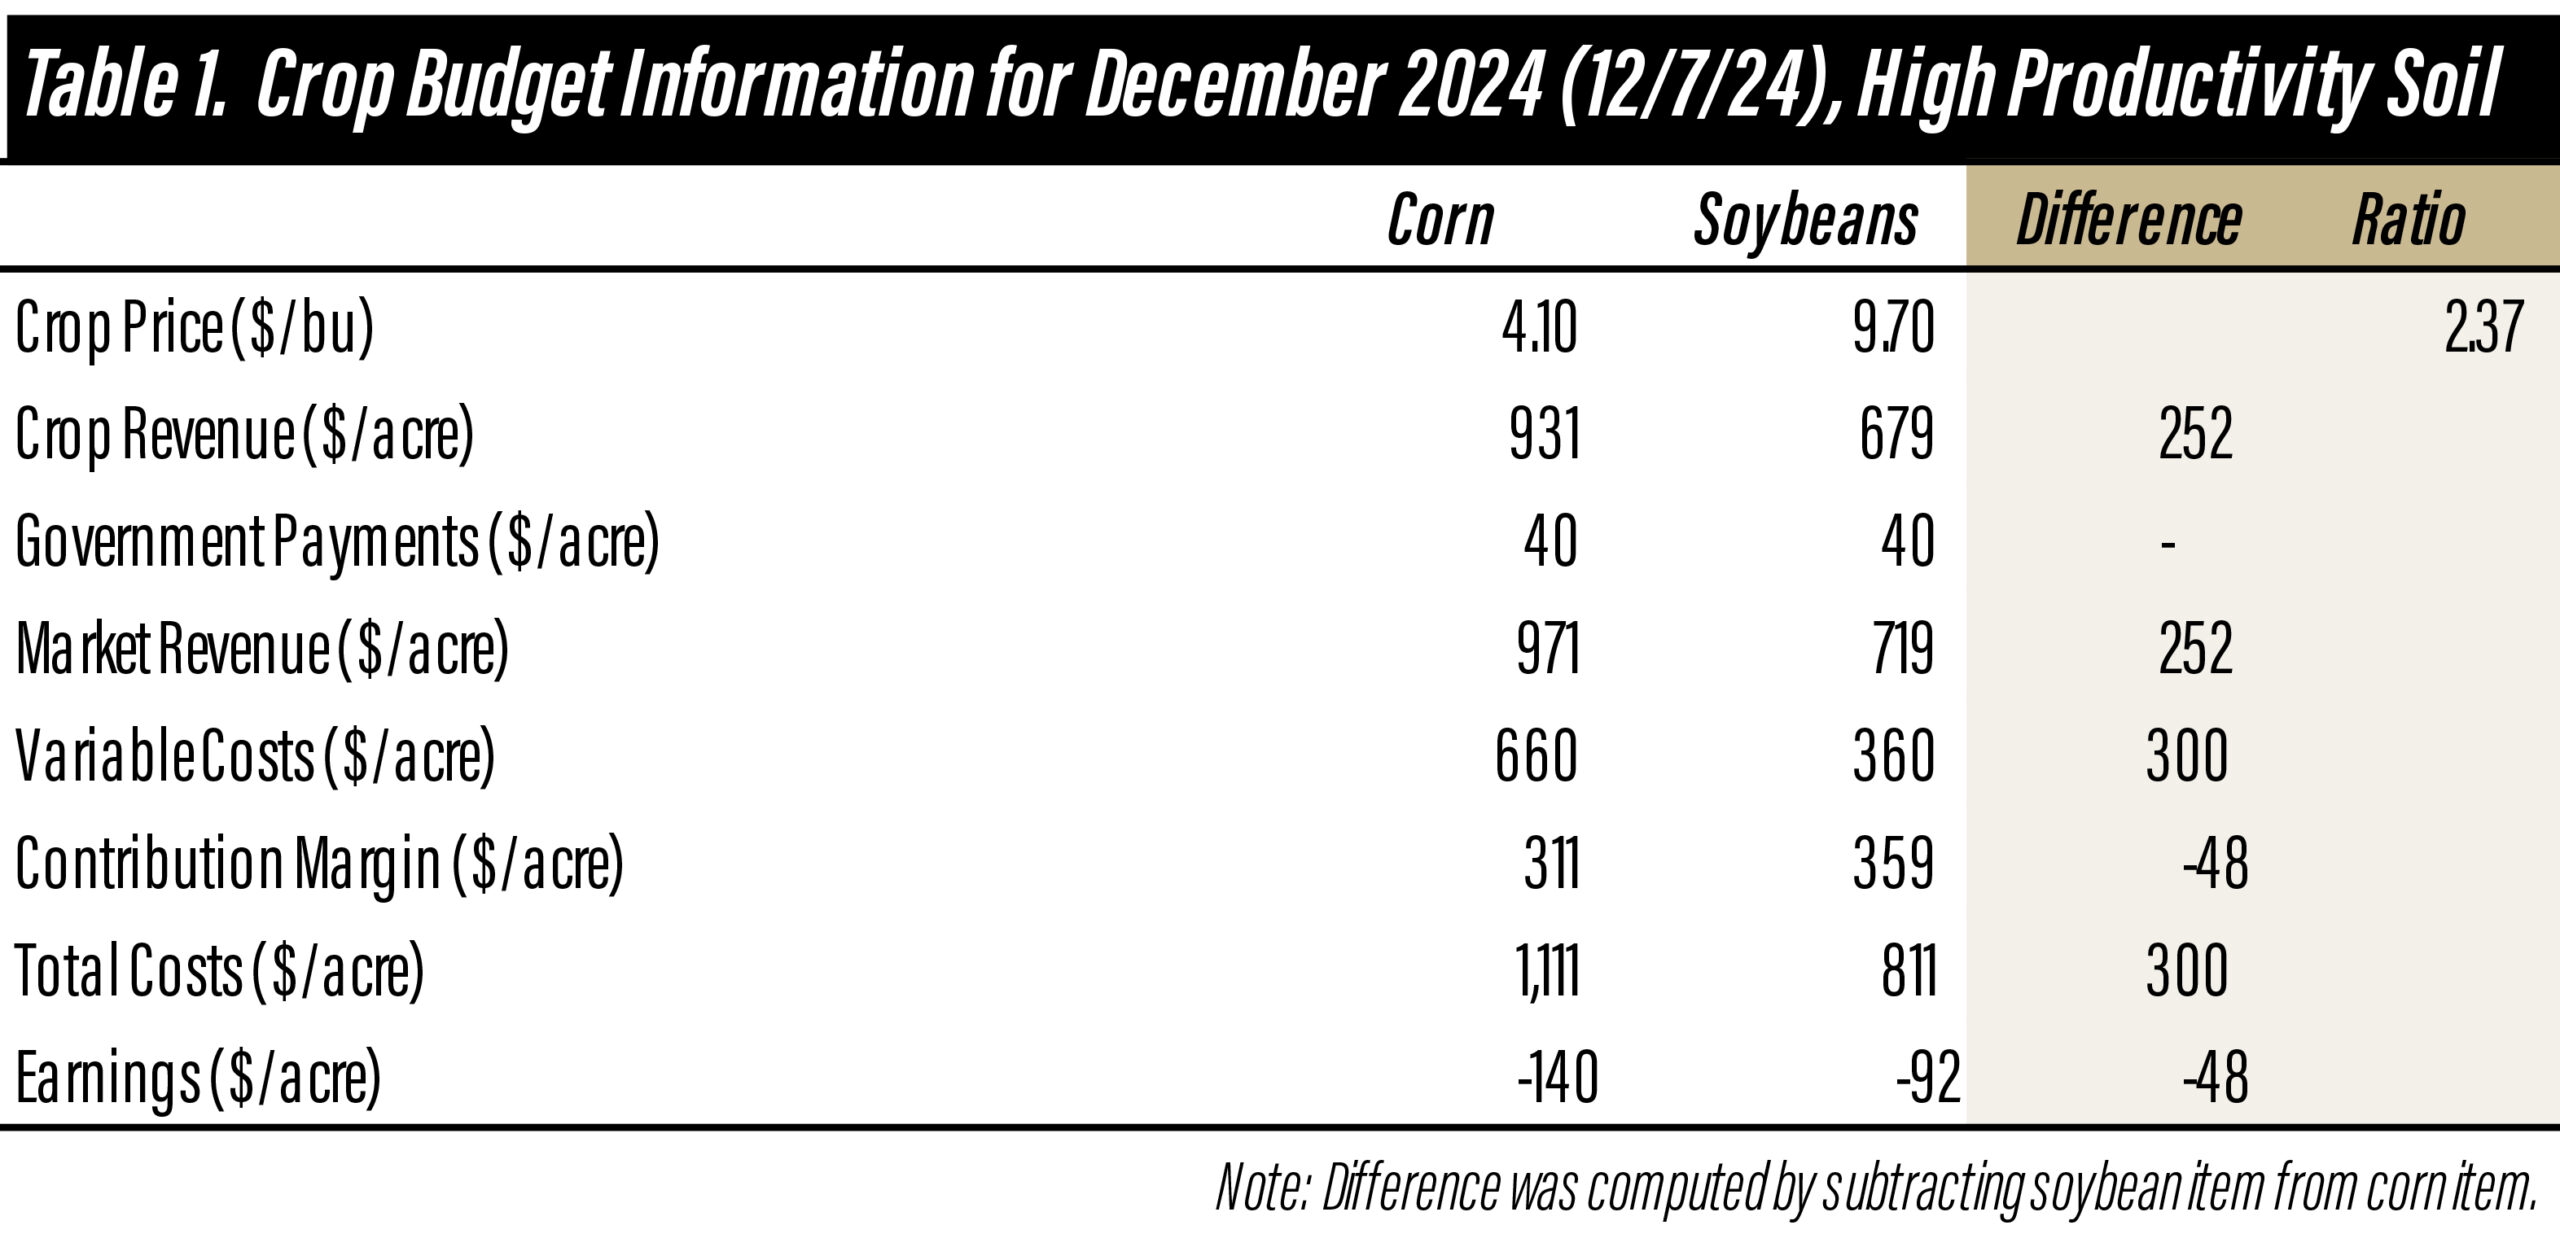
Table 1. Crop Budget Information for December 2024 (12/7/24), High Productivity Soil
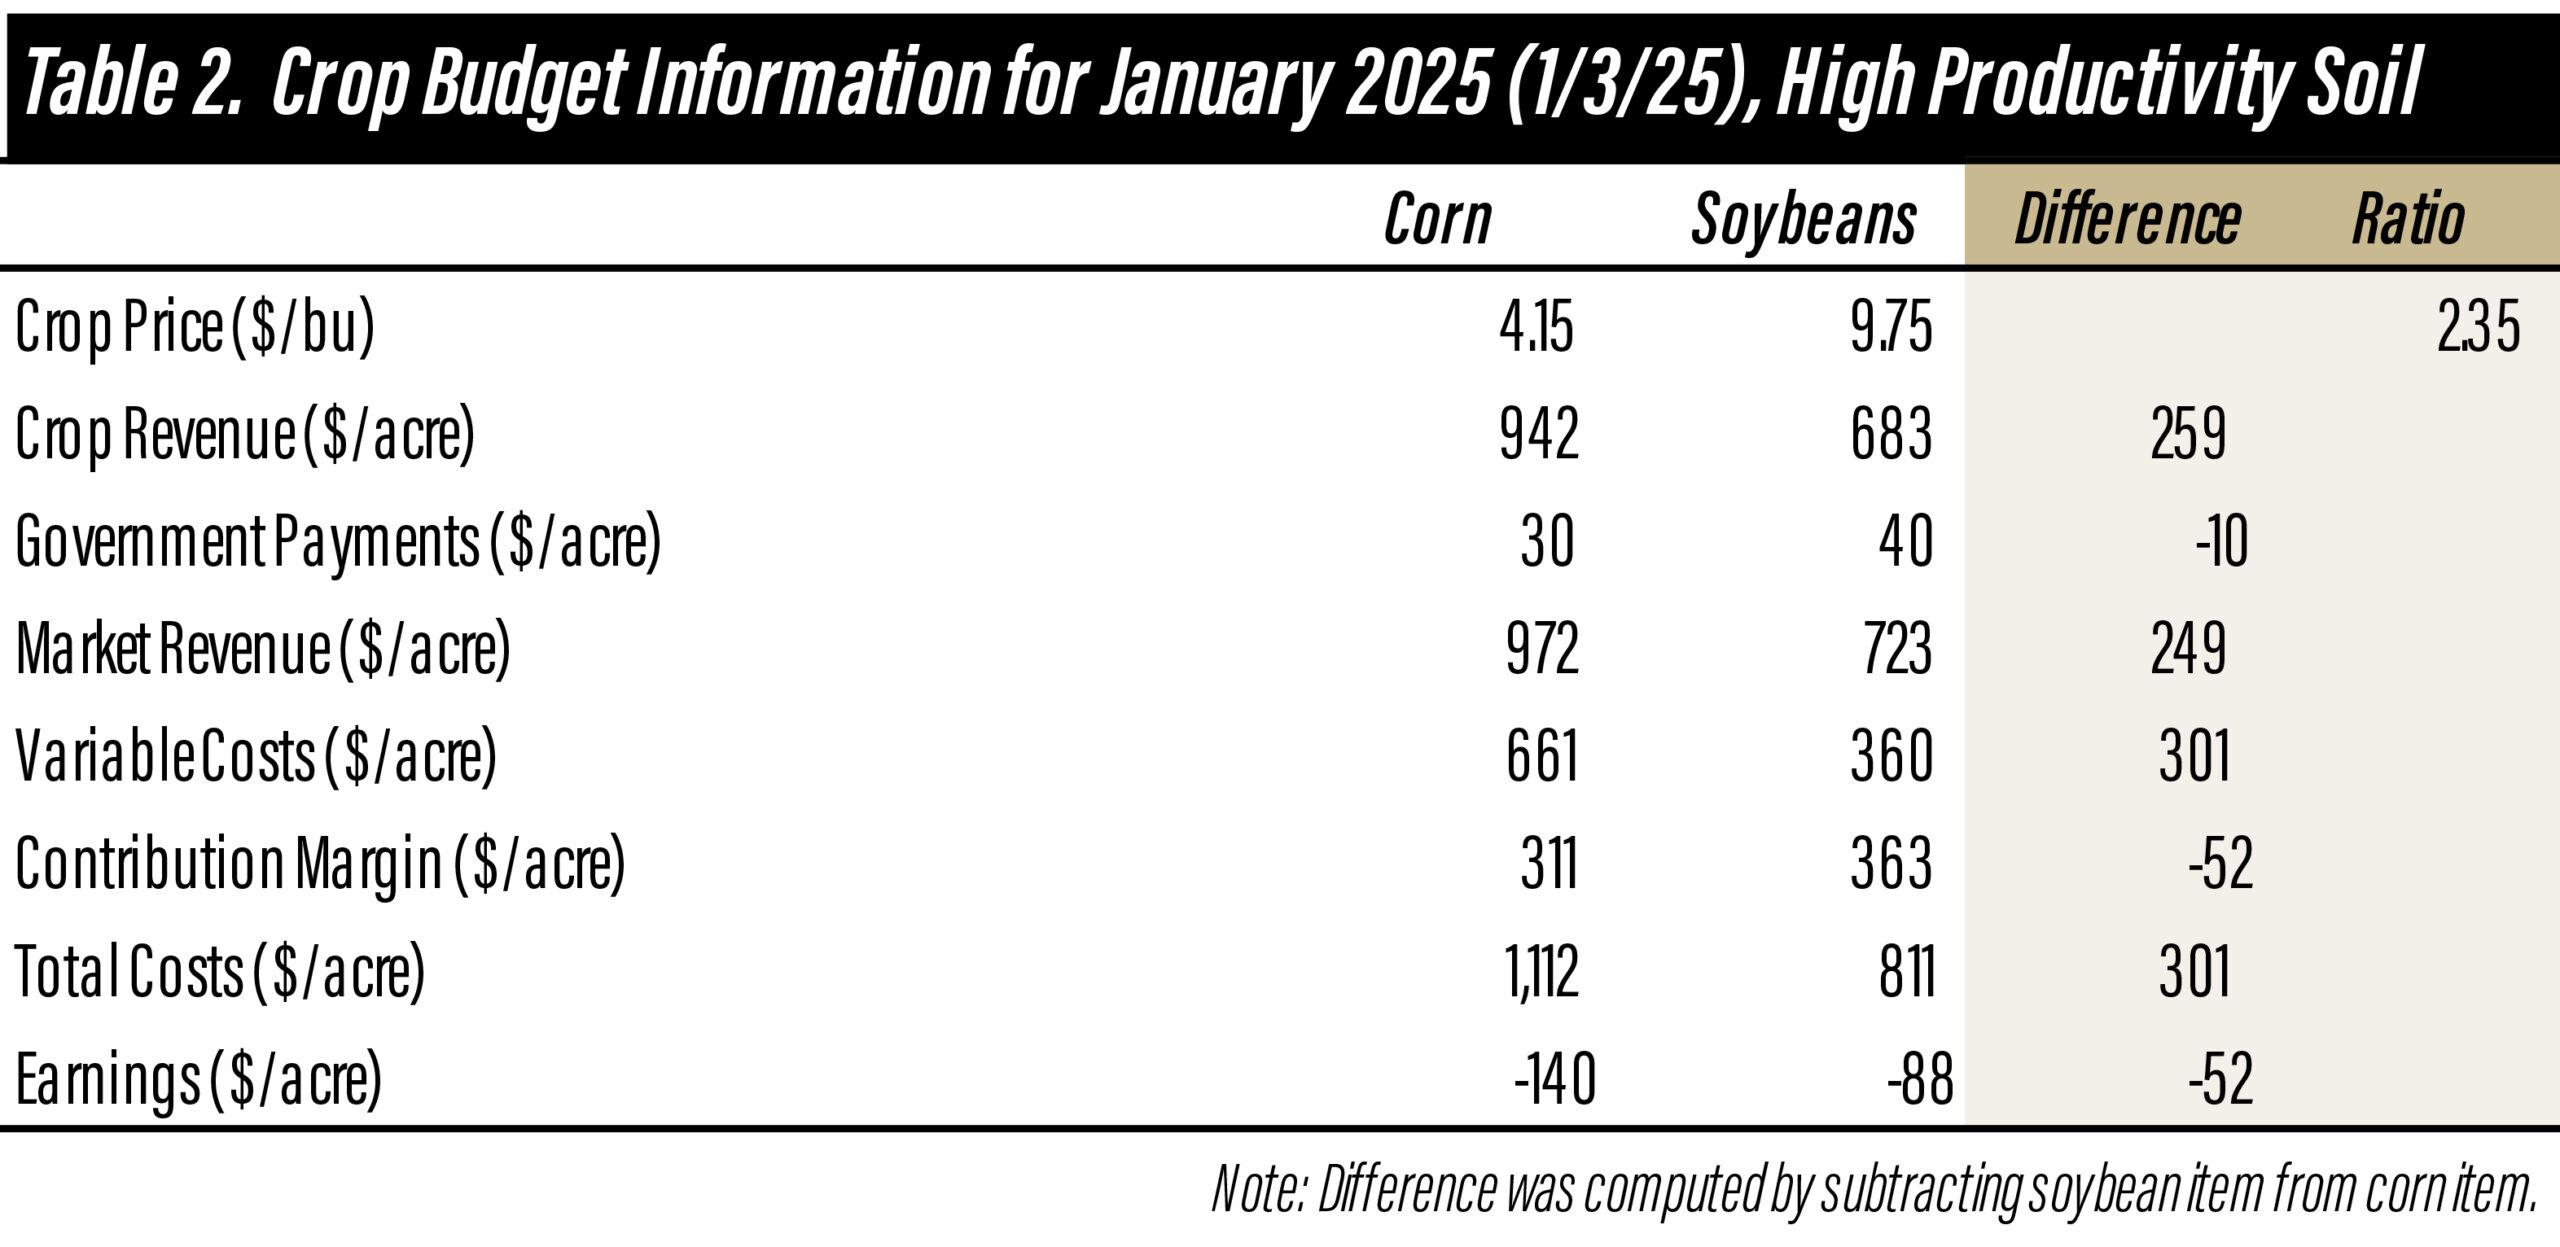
Table 2. Crop Budget Information for January 2025 (1/3/25), High Productivity Soil
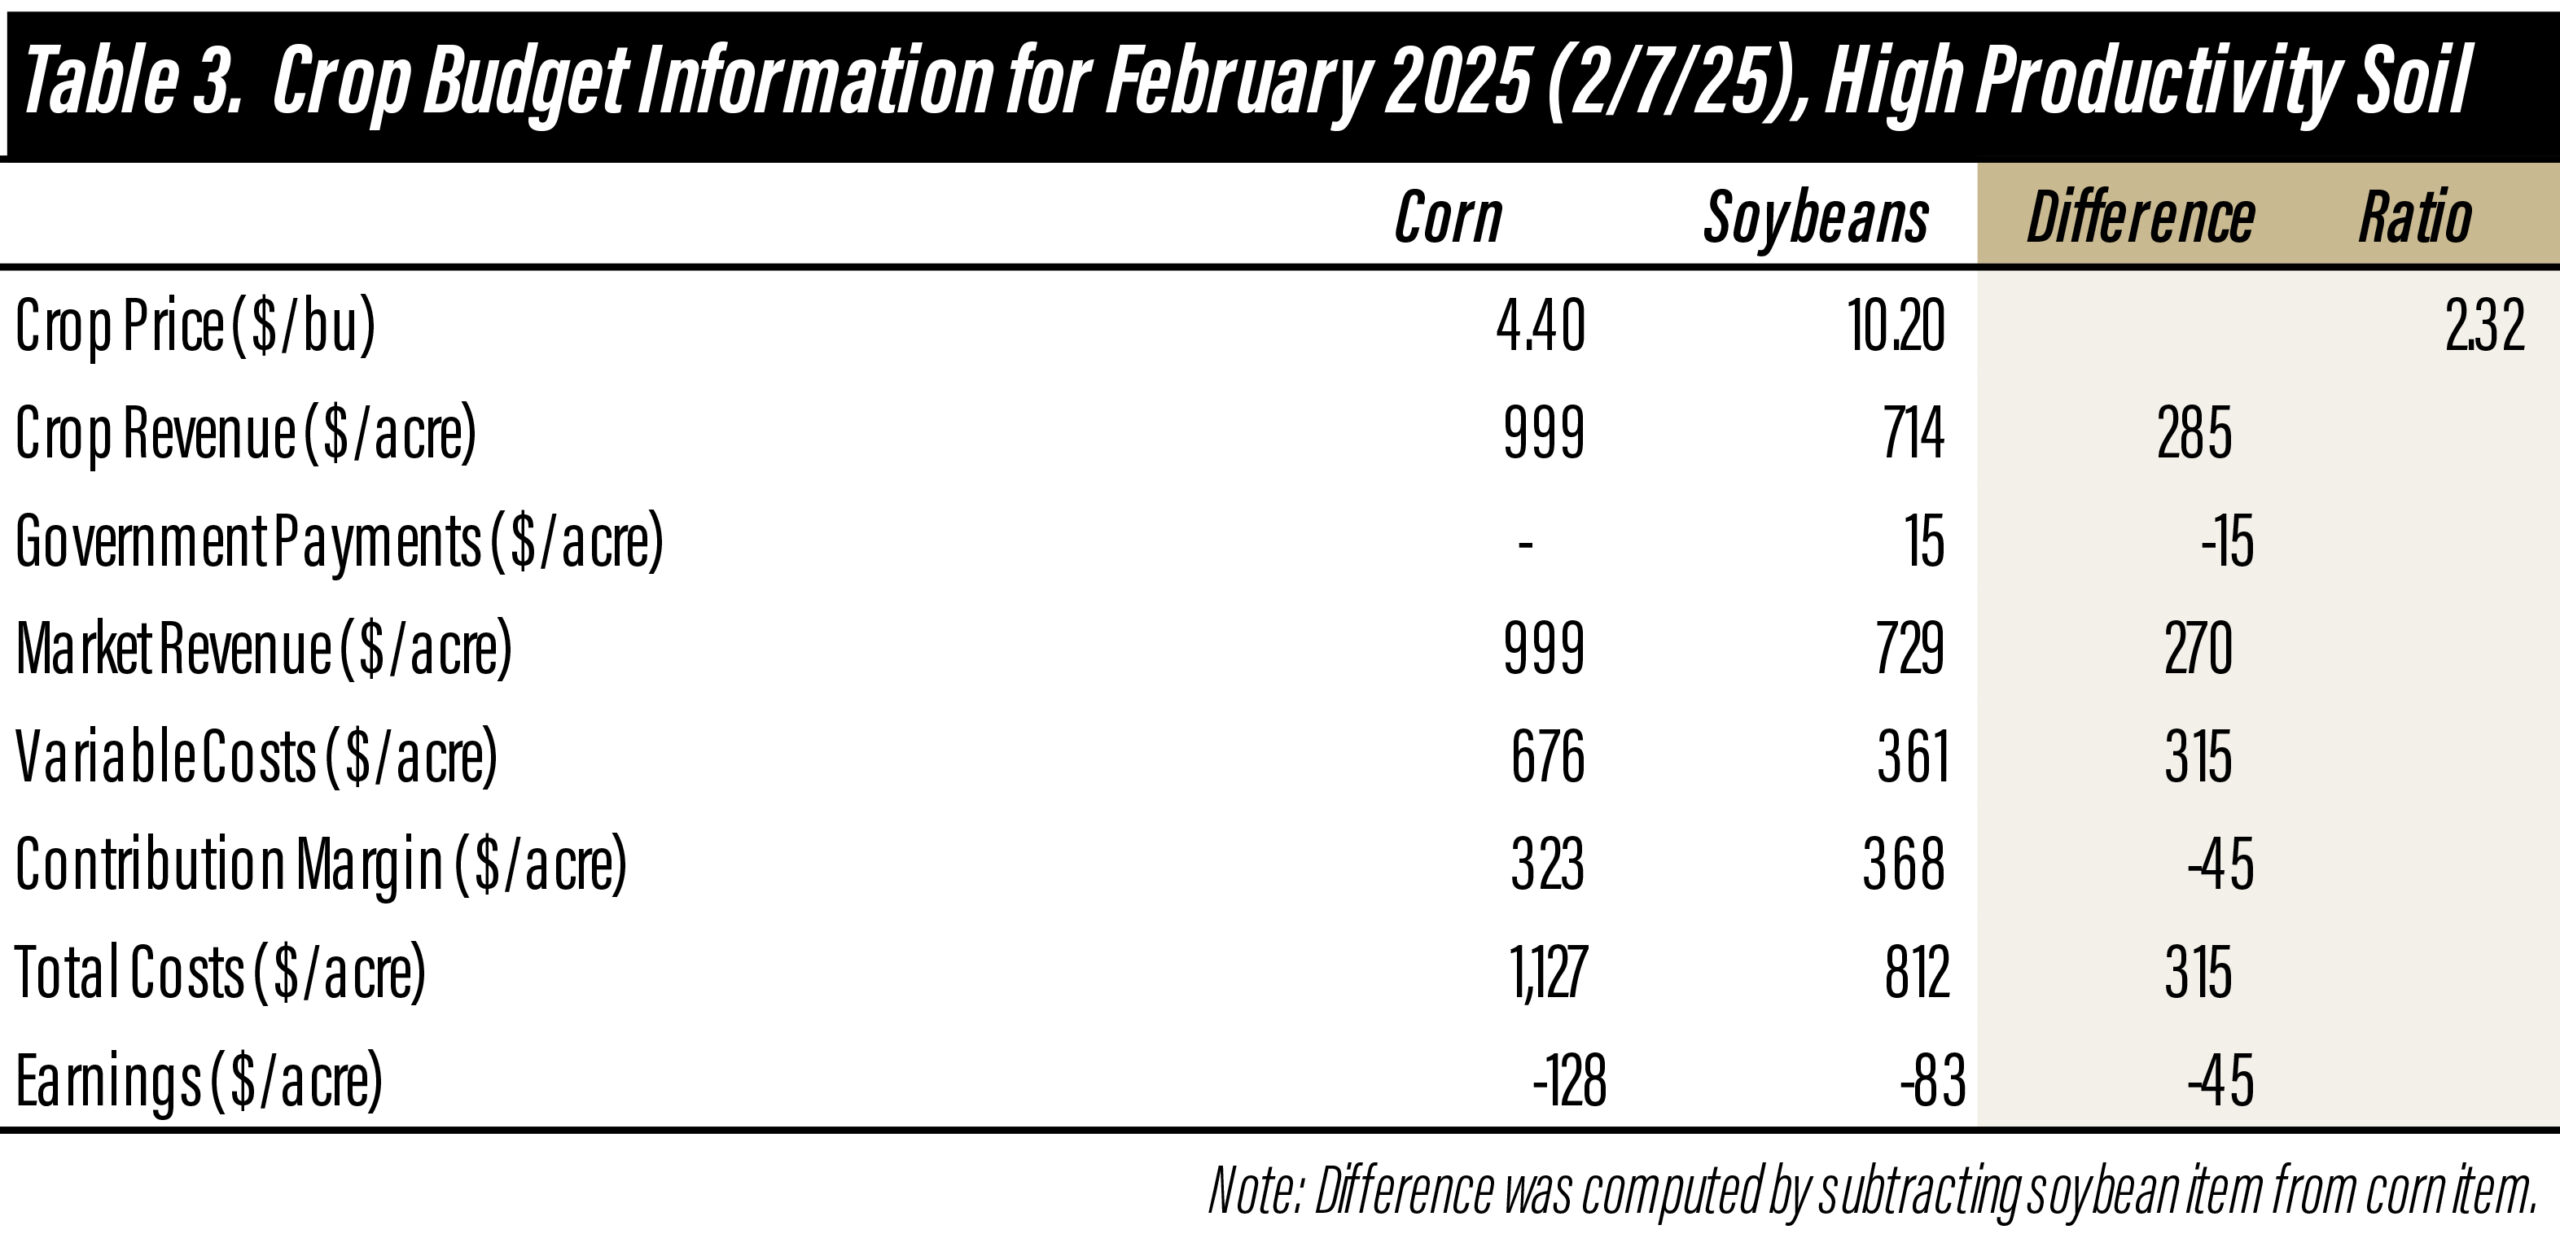
Table 3. Crop Budget Information for February 2025 (2/7/25), High Productivity Soil
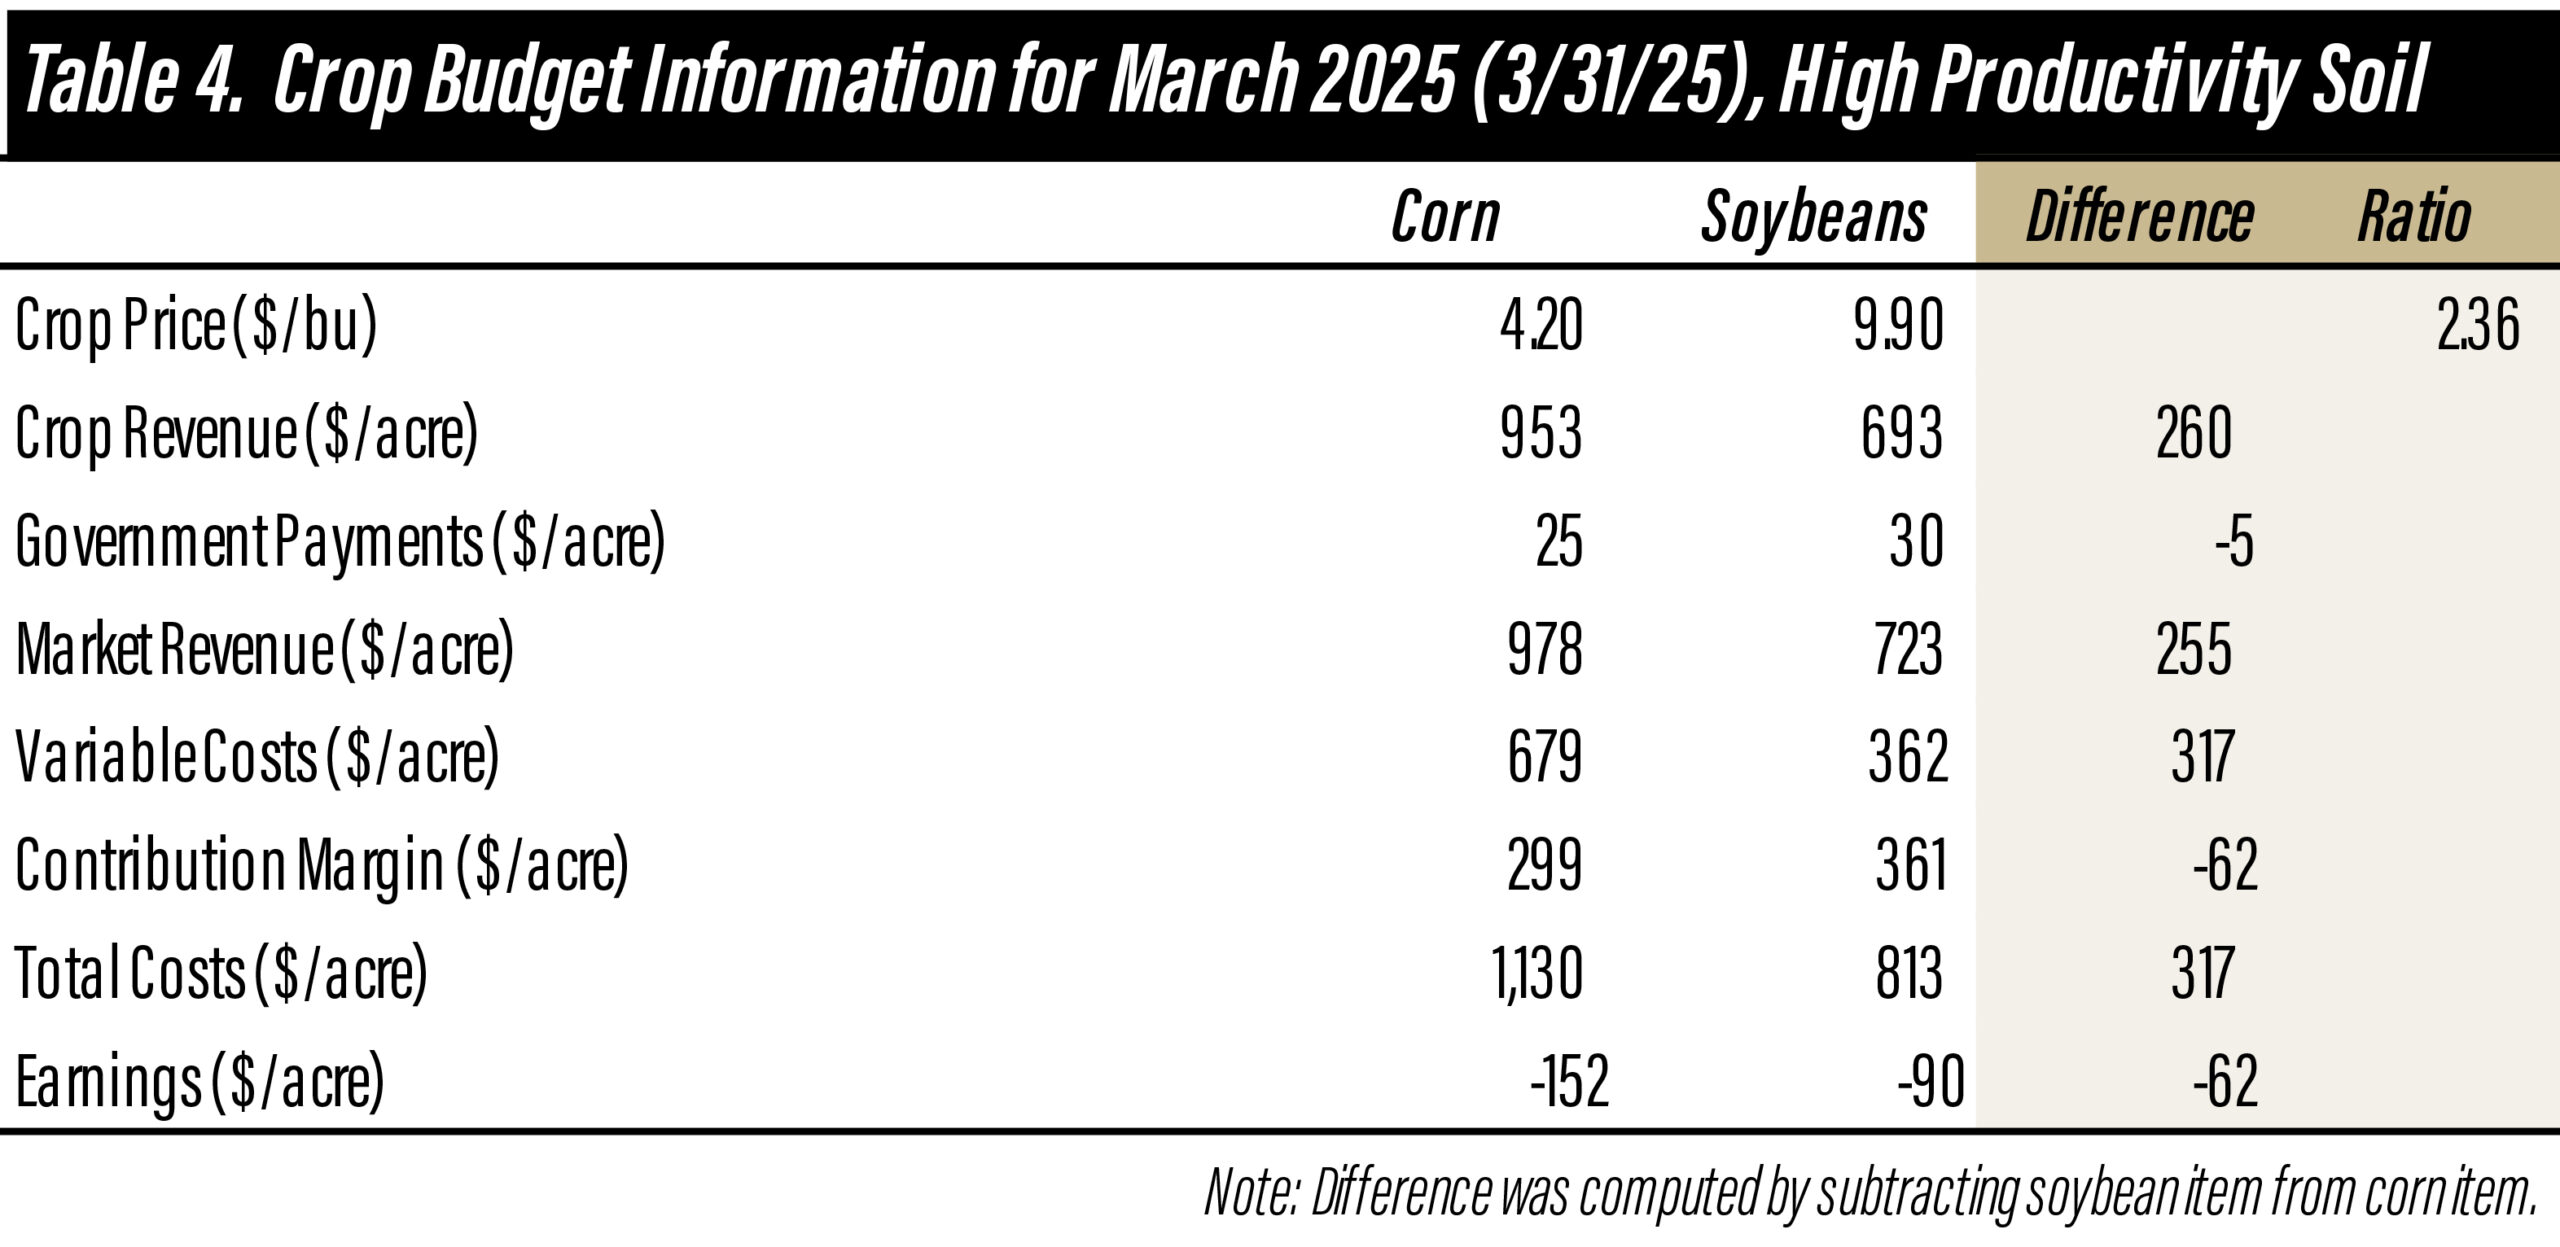
Table 4. Crop Budget Information for March 2025 (3/3/25), High Productivity Soil
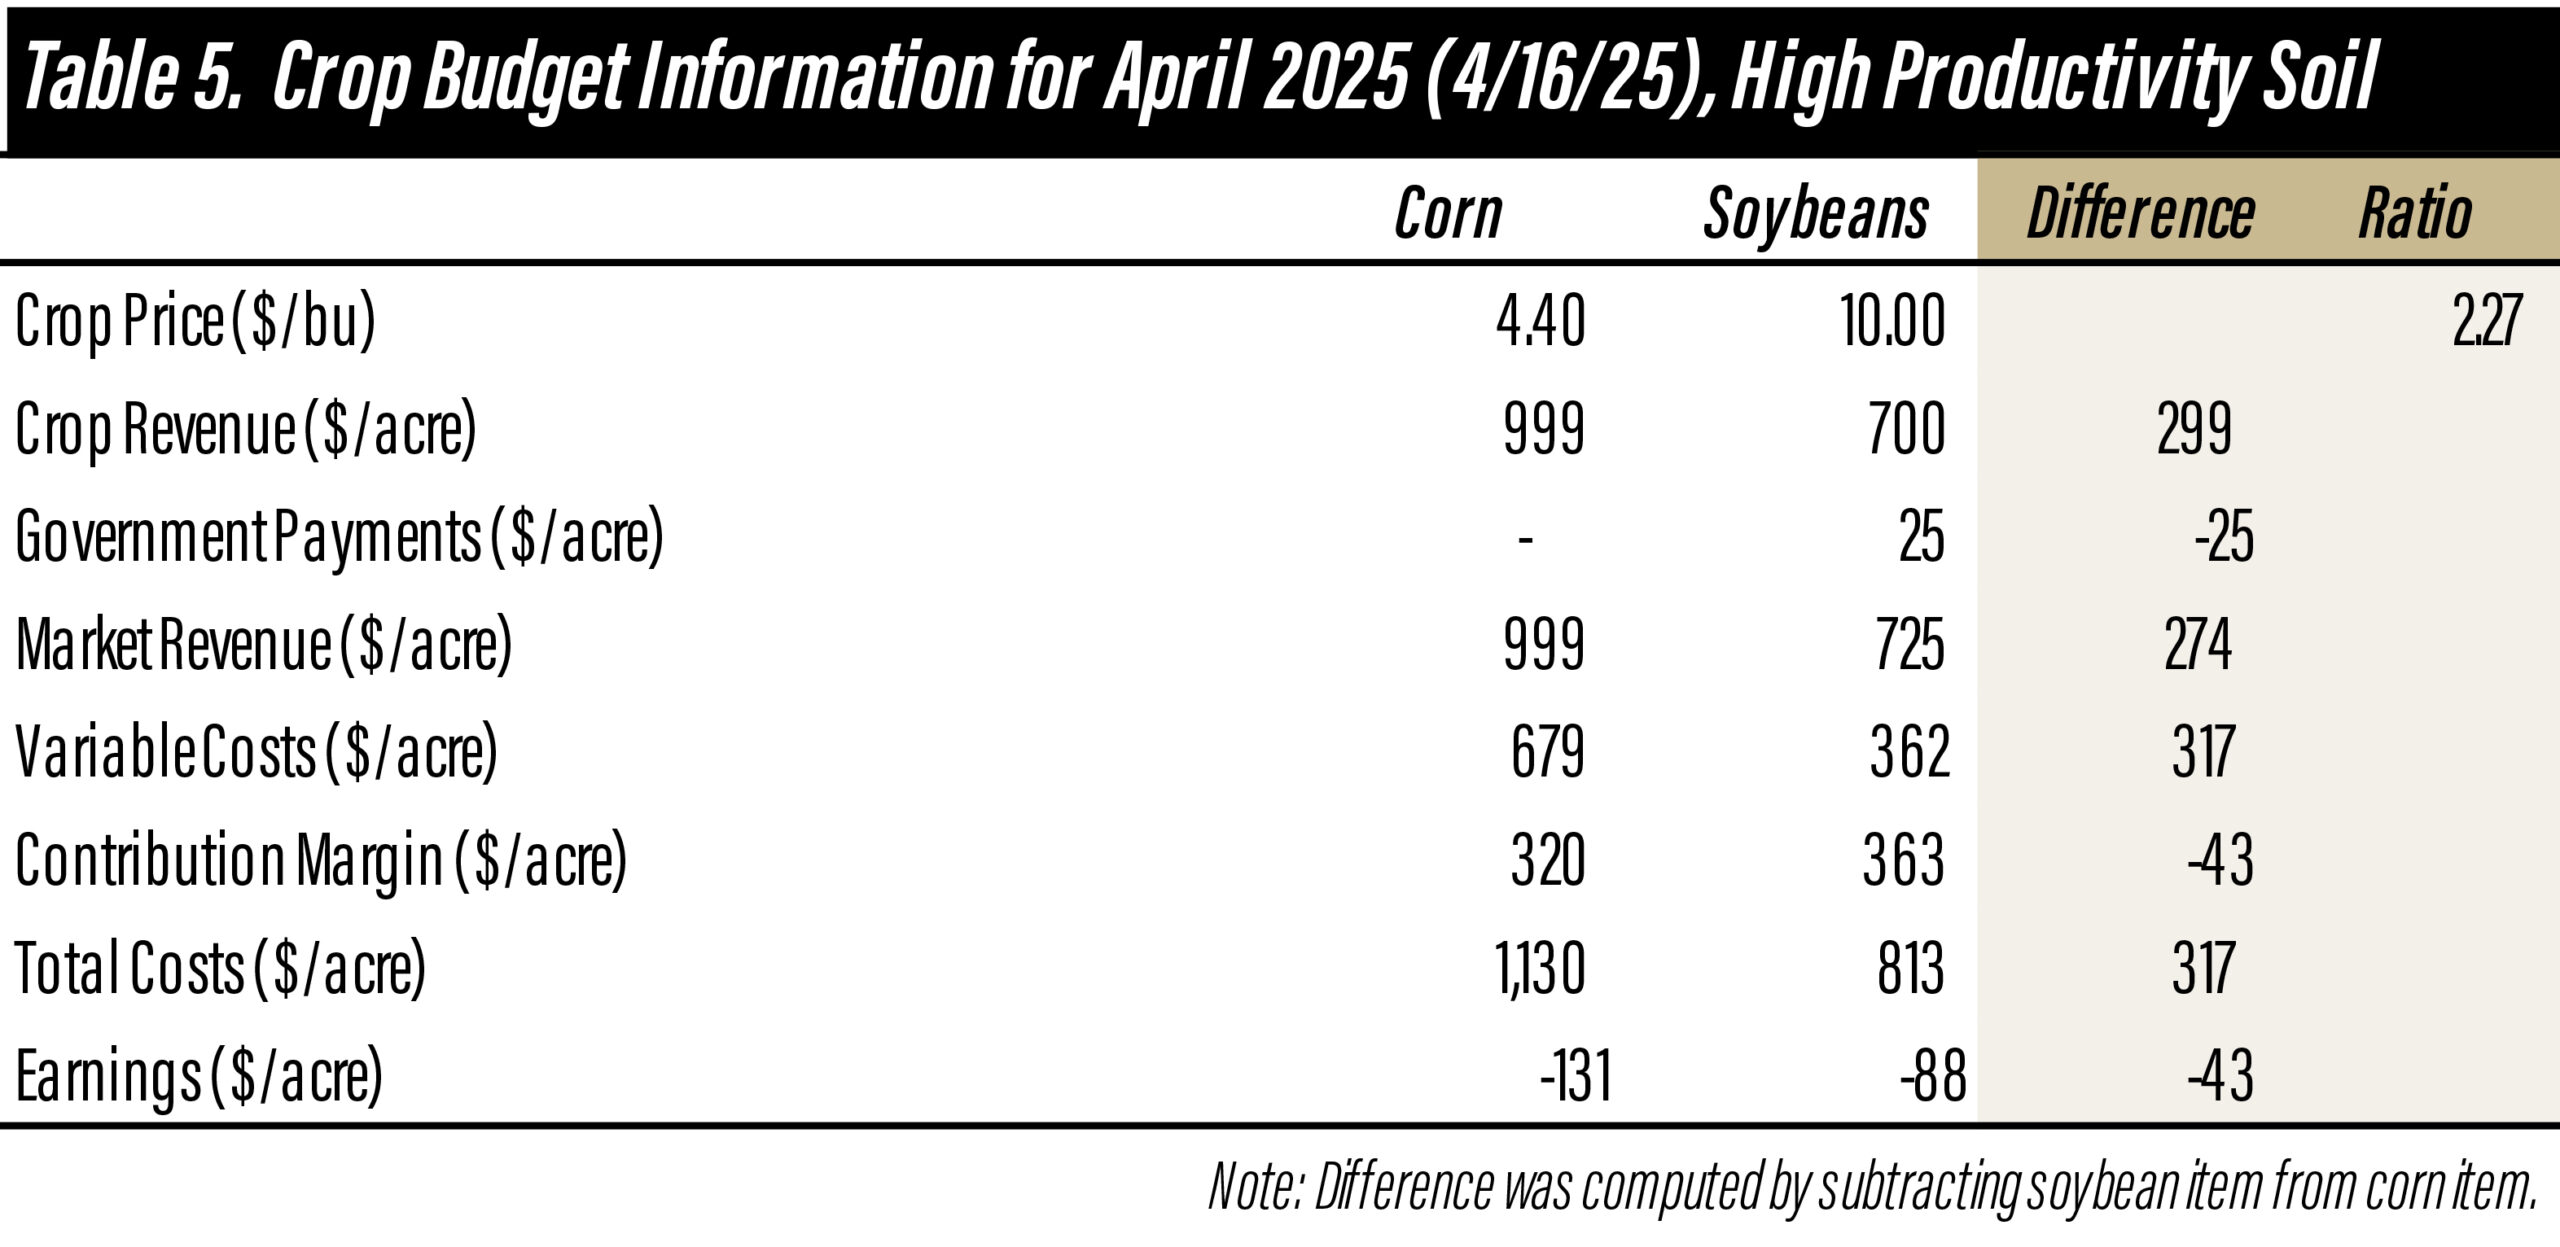
Table 5. Crop Budget Information for April 2025 (4/16/25), High Productivity Soil
Budget estimates made in December 2024, January 2025, February 2025, March 2025, and April 2025 are displayed in tables 1-5. Information in each table includes crop price, crop revenue, government payments, market revenue, variable costs, contribution margin, total costs, earnings, and the soybean to corn price ratio. Figures in the tables represent projections for the 2025 crop for corn and soybeans grown on high productivity soils.
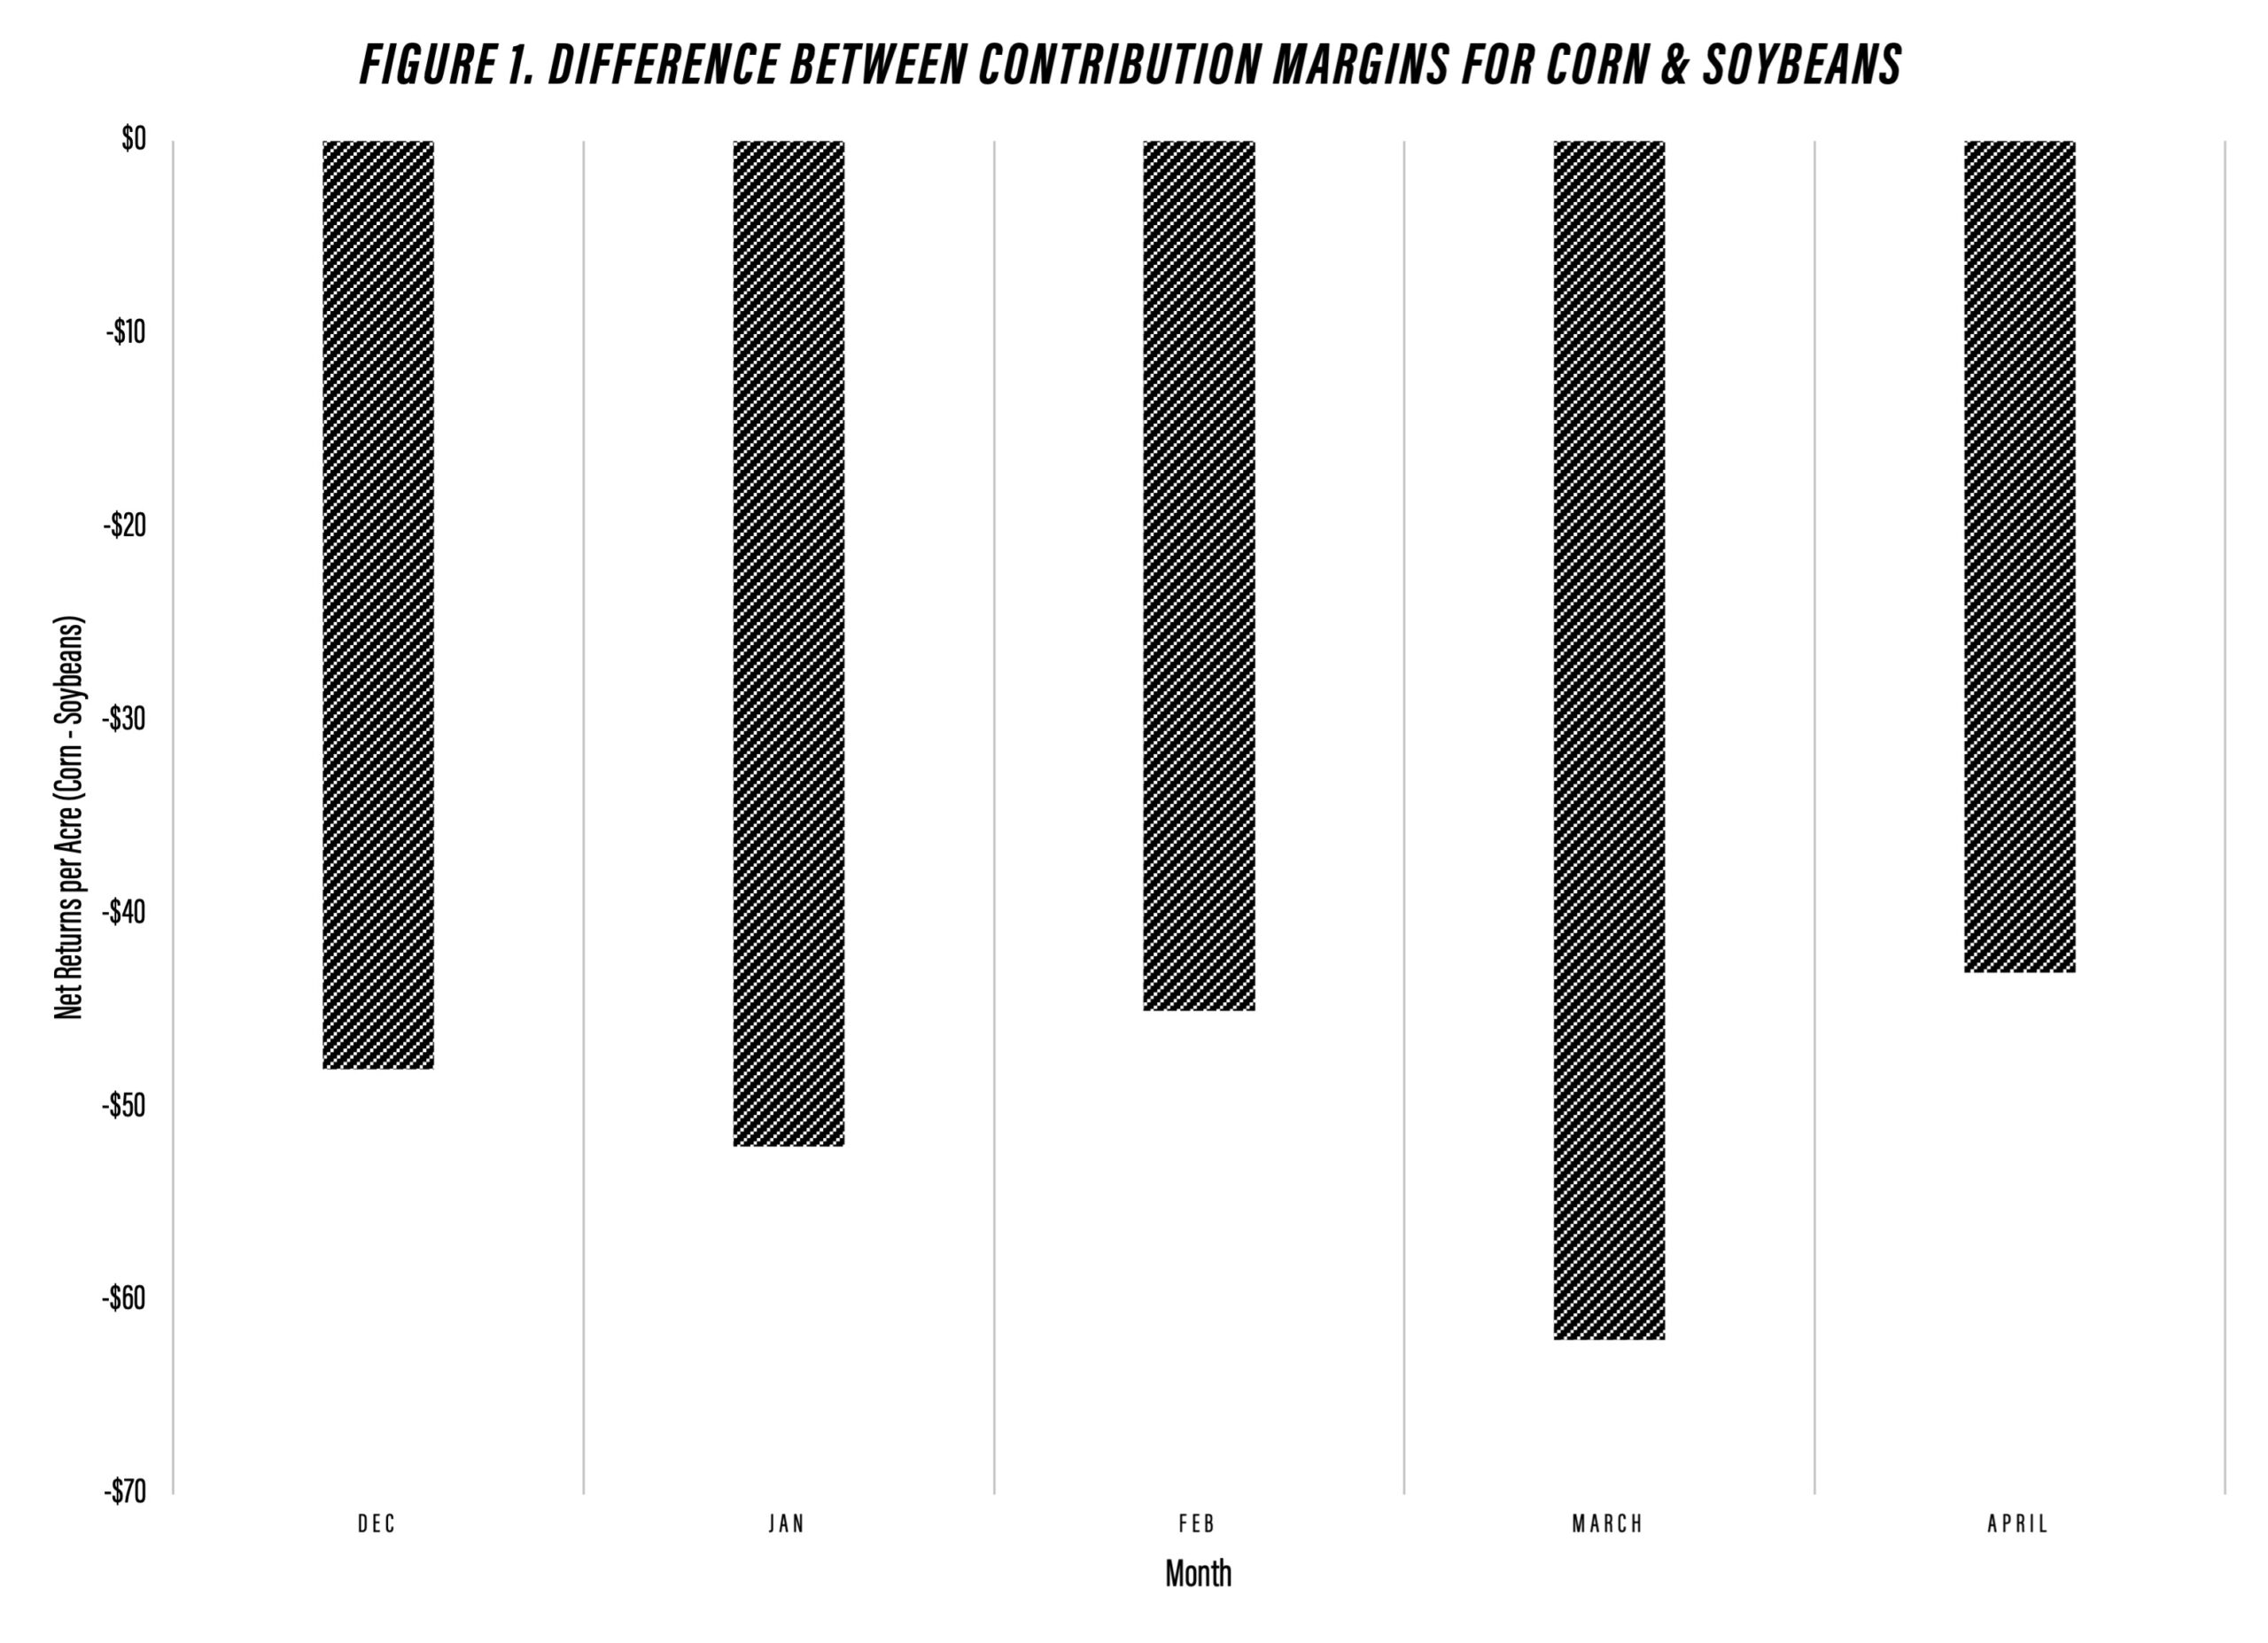
Figure 1. Difference Between Contribution Margins for Corn and Soybeans
Figure 1 illustrates the estimated differences in the contribution margin (i.e., net returns to variable costs) between corn and soybeans since December. Differences were computed by subtracting projected soybean net returns from projected corn net returns. Even though corn was more competitive in December 2024 than it has been in some of the most recent years, soybeans still appeared to be more profitability. The difference in net returns was the highest in March ($62 per acre) and the lowest in April ($43 per acre). As the tariffs have become more immanent, the difference in market revenue between the two crops has widened. However, with the inclusion of potential ARC-CO payments, the difference in net returns remains above $40 per acre, with the advantage accruing to soybeans. Average earnings per acre have below $100 since December. It is important to note that comparisons are made between rotation corn and rotation soybeans. In general, continuous corn does not appear to be a profitable alternative to rotation soybeans. However, there are likely regions in Indiana where continuous corn is more favorable than that depicted in the budget projections for the entire state.
Even though differences in relative profitability between corn and soybeans depend on relative yields, costs, and crop prices; relative crop prices have been a very important determinant of relative profitability in recent months. Given this, figure 2 presents the soybean to corn price ratio from December 2024 and April 2025. The soybean to corn price ratio varied from 2.32 to 2.37 from December through March, before dropping to 2.27 in April. The average soybean to corn price ratio in Indiana since 2007 is 2.42. With today’s cost structure, one cannot indicate that corn is more profitable than soybeans just because the price ratio is below the long-run average.
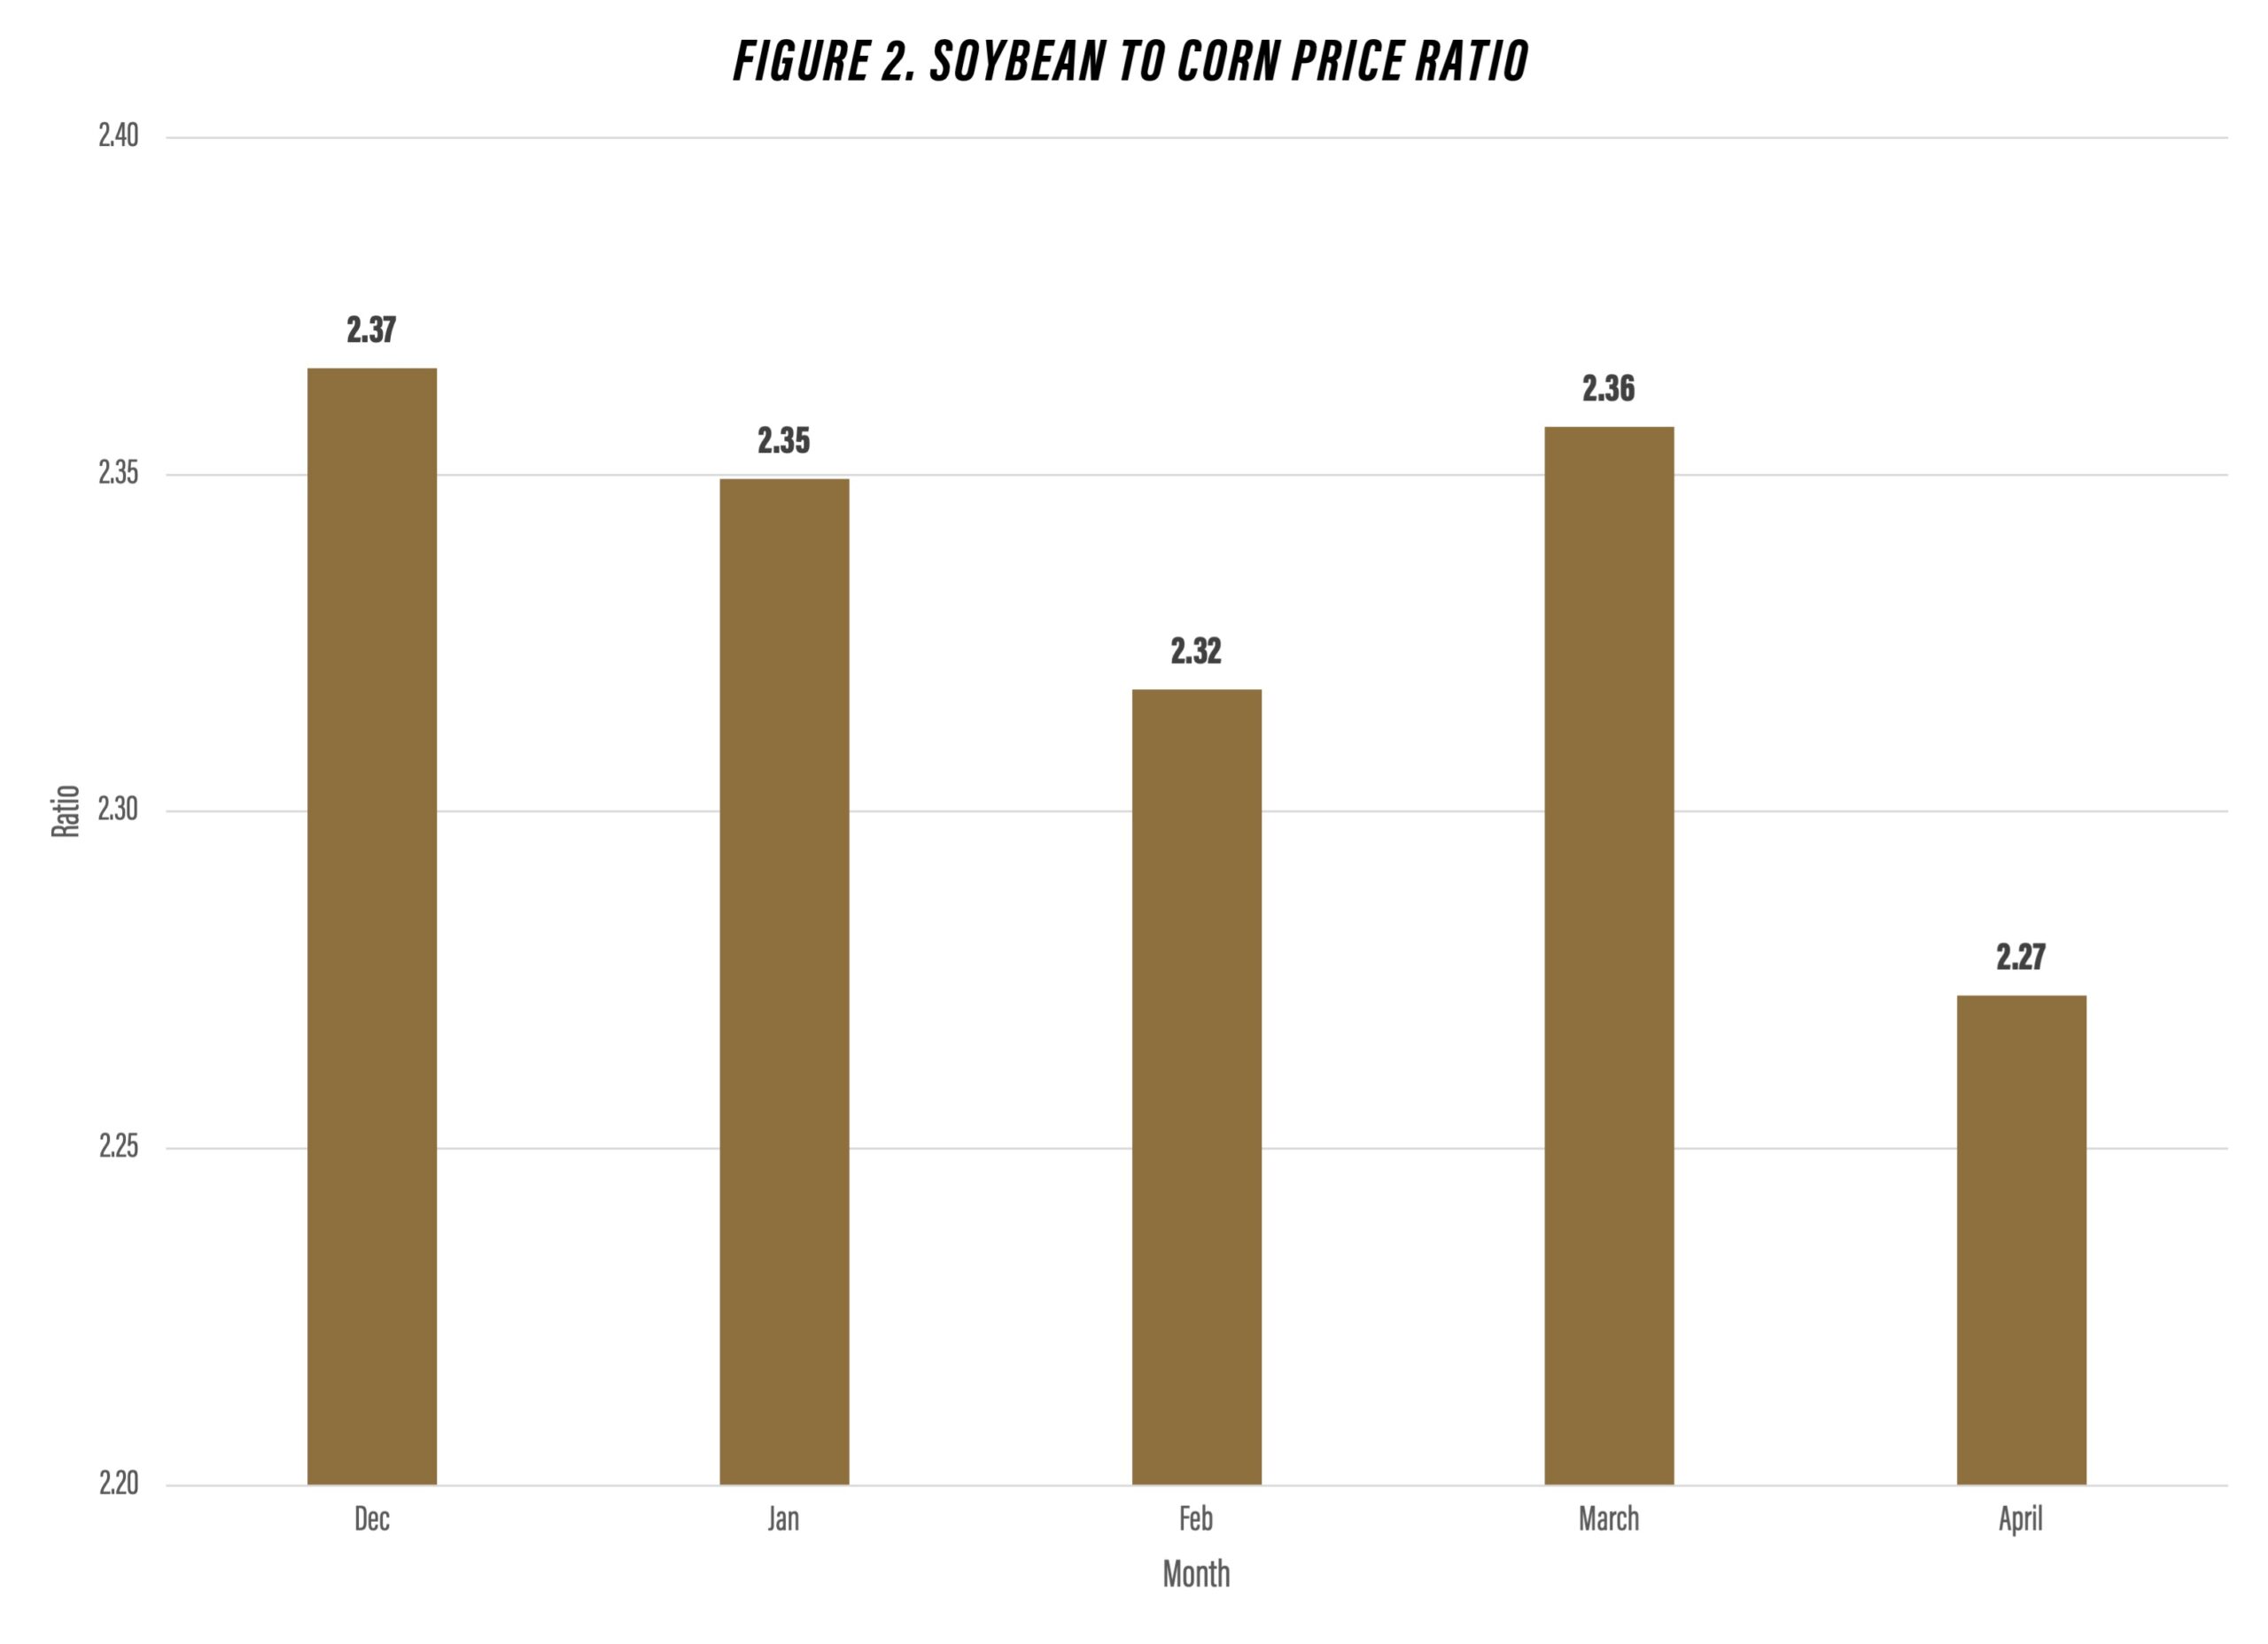
Figure 2. Soybean to Corn Price Ratio
The information in this article will be updated as policy developments evolve. Net return prospects will evolve as demand and supply fundamentals change. In addition, possible government payments related to trade could modify the comparisons made in this article.
TAGS:
TEAM LINKS:

RELATED RESOURCES
UPCOMING EVENTS
Join educators from across the Midwest to build skills for communicating soil health concepts on Nov. 4-5, 2026. In the field, we’ll evaluate the relationship between soil health and water management focusing on irrigation and edge of field practices. The in-service will have both classroom and on farm demonstrations.
The Land of Opportunity: A Conference for Farmland Owners will be held at two locations on October 5 and October 6, providing farmland owners with valuable information and resources to help them make informed decisions about their land. The conference will feature keynote presentations, educational breakout sessions, and networking opportunities designed specifically for those who own, manage, or have an interest in farmland.