Farmland Prices Increase Despite Downward Pressure
August 19, 2025
PAER-2025-11
Author: Todd Kuethe, Professor & Schrader Chair of Farmland Economics
![]()
![]()
![]()
![]()
![]()
State-wide average farmland prices once again hit a new record in 2025, according to the recent Purdue Farmland Value and Cash Rent Survey. The average price of top quality farmland is $14,826, up 3.0% from June 2024 (Table 1). Average and poor quality farmland also hit new highs at $12,254 and $9,761 per acre, with an annual increase of 5.4% and 7.6%, respectively. However, unlike previous years, the survey indicates a mixture of increases and decreases in farmland values and cash rents across regions.
In both the Southwest and Southeast regions, farmland values fell across all three quality grades. These regions, however, experienced the largest price increases since 2020. The survey suggests that farmland in the regions declined through the latter half of 2024 and rebounded in the first half of 2025. However, on net, the 2025 gain does not override the 2024 losses. The opposite pattern appears to hold in the four other regions of the state, increasing during the latter half of 2024 and declining in the first half of 2025. The highest per acre values across all three quality grades were found in the Northeast region, where top quality land fell just shy of $16,000 per acre. At the state-level, respondents are modestly optimistic about the remainder of 2025. However, further declines are expected across all quality grades in both the Southwest and Southeast regions.
The value of land transitioning out of agricultural production exhibited a 5.3% decline from 2024, falling to $29,043 per acre. The Purdue Farmland Values and Cash Rent Survey specifically asks for estimates of “farmland transitioning out of production agriculture and moving into residential, commercial, or industrial use.” As one respondent noted, however, “residential land has a price range that is much less than commercial or industrial use.” A number of other respondents note that major development projects, solar farms, and data centers are driving farmland prices in their market area. Several respondents also note that the price impacts are not limited to the county in which the development occurs but, instead, may extend to neighboring counties or other regions in the state as the result of 1031 exchange. Finally, one respondent notes that “development also raised housing costs and pushed recreational land values.” The survey indicates that state-wide recreational land values increased by 18.0% from 2024, to a per acre average of $9,542.
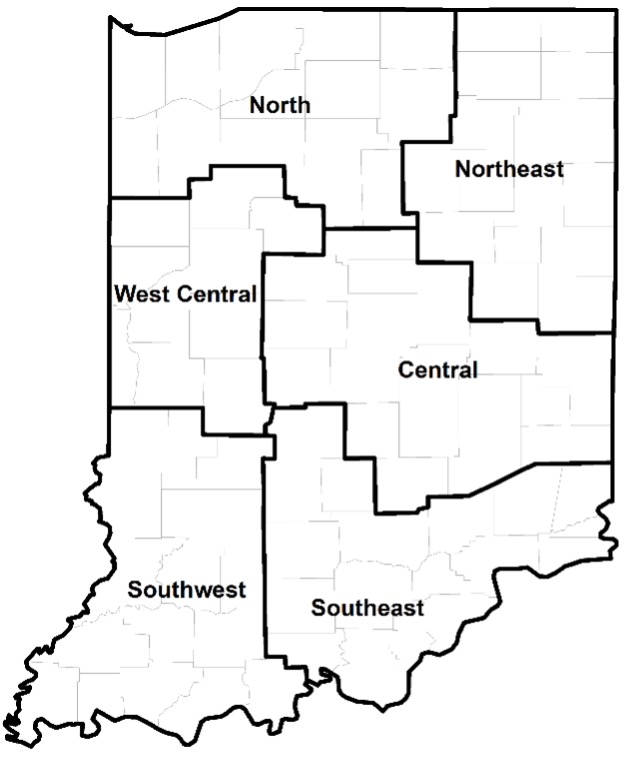
Figure 1: County clusters used in Purdue Land Values survey to create geographic regions
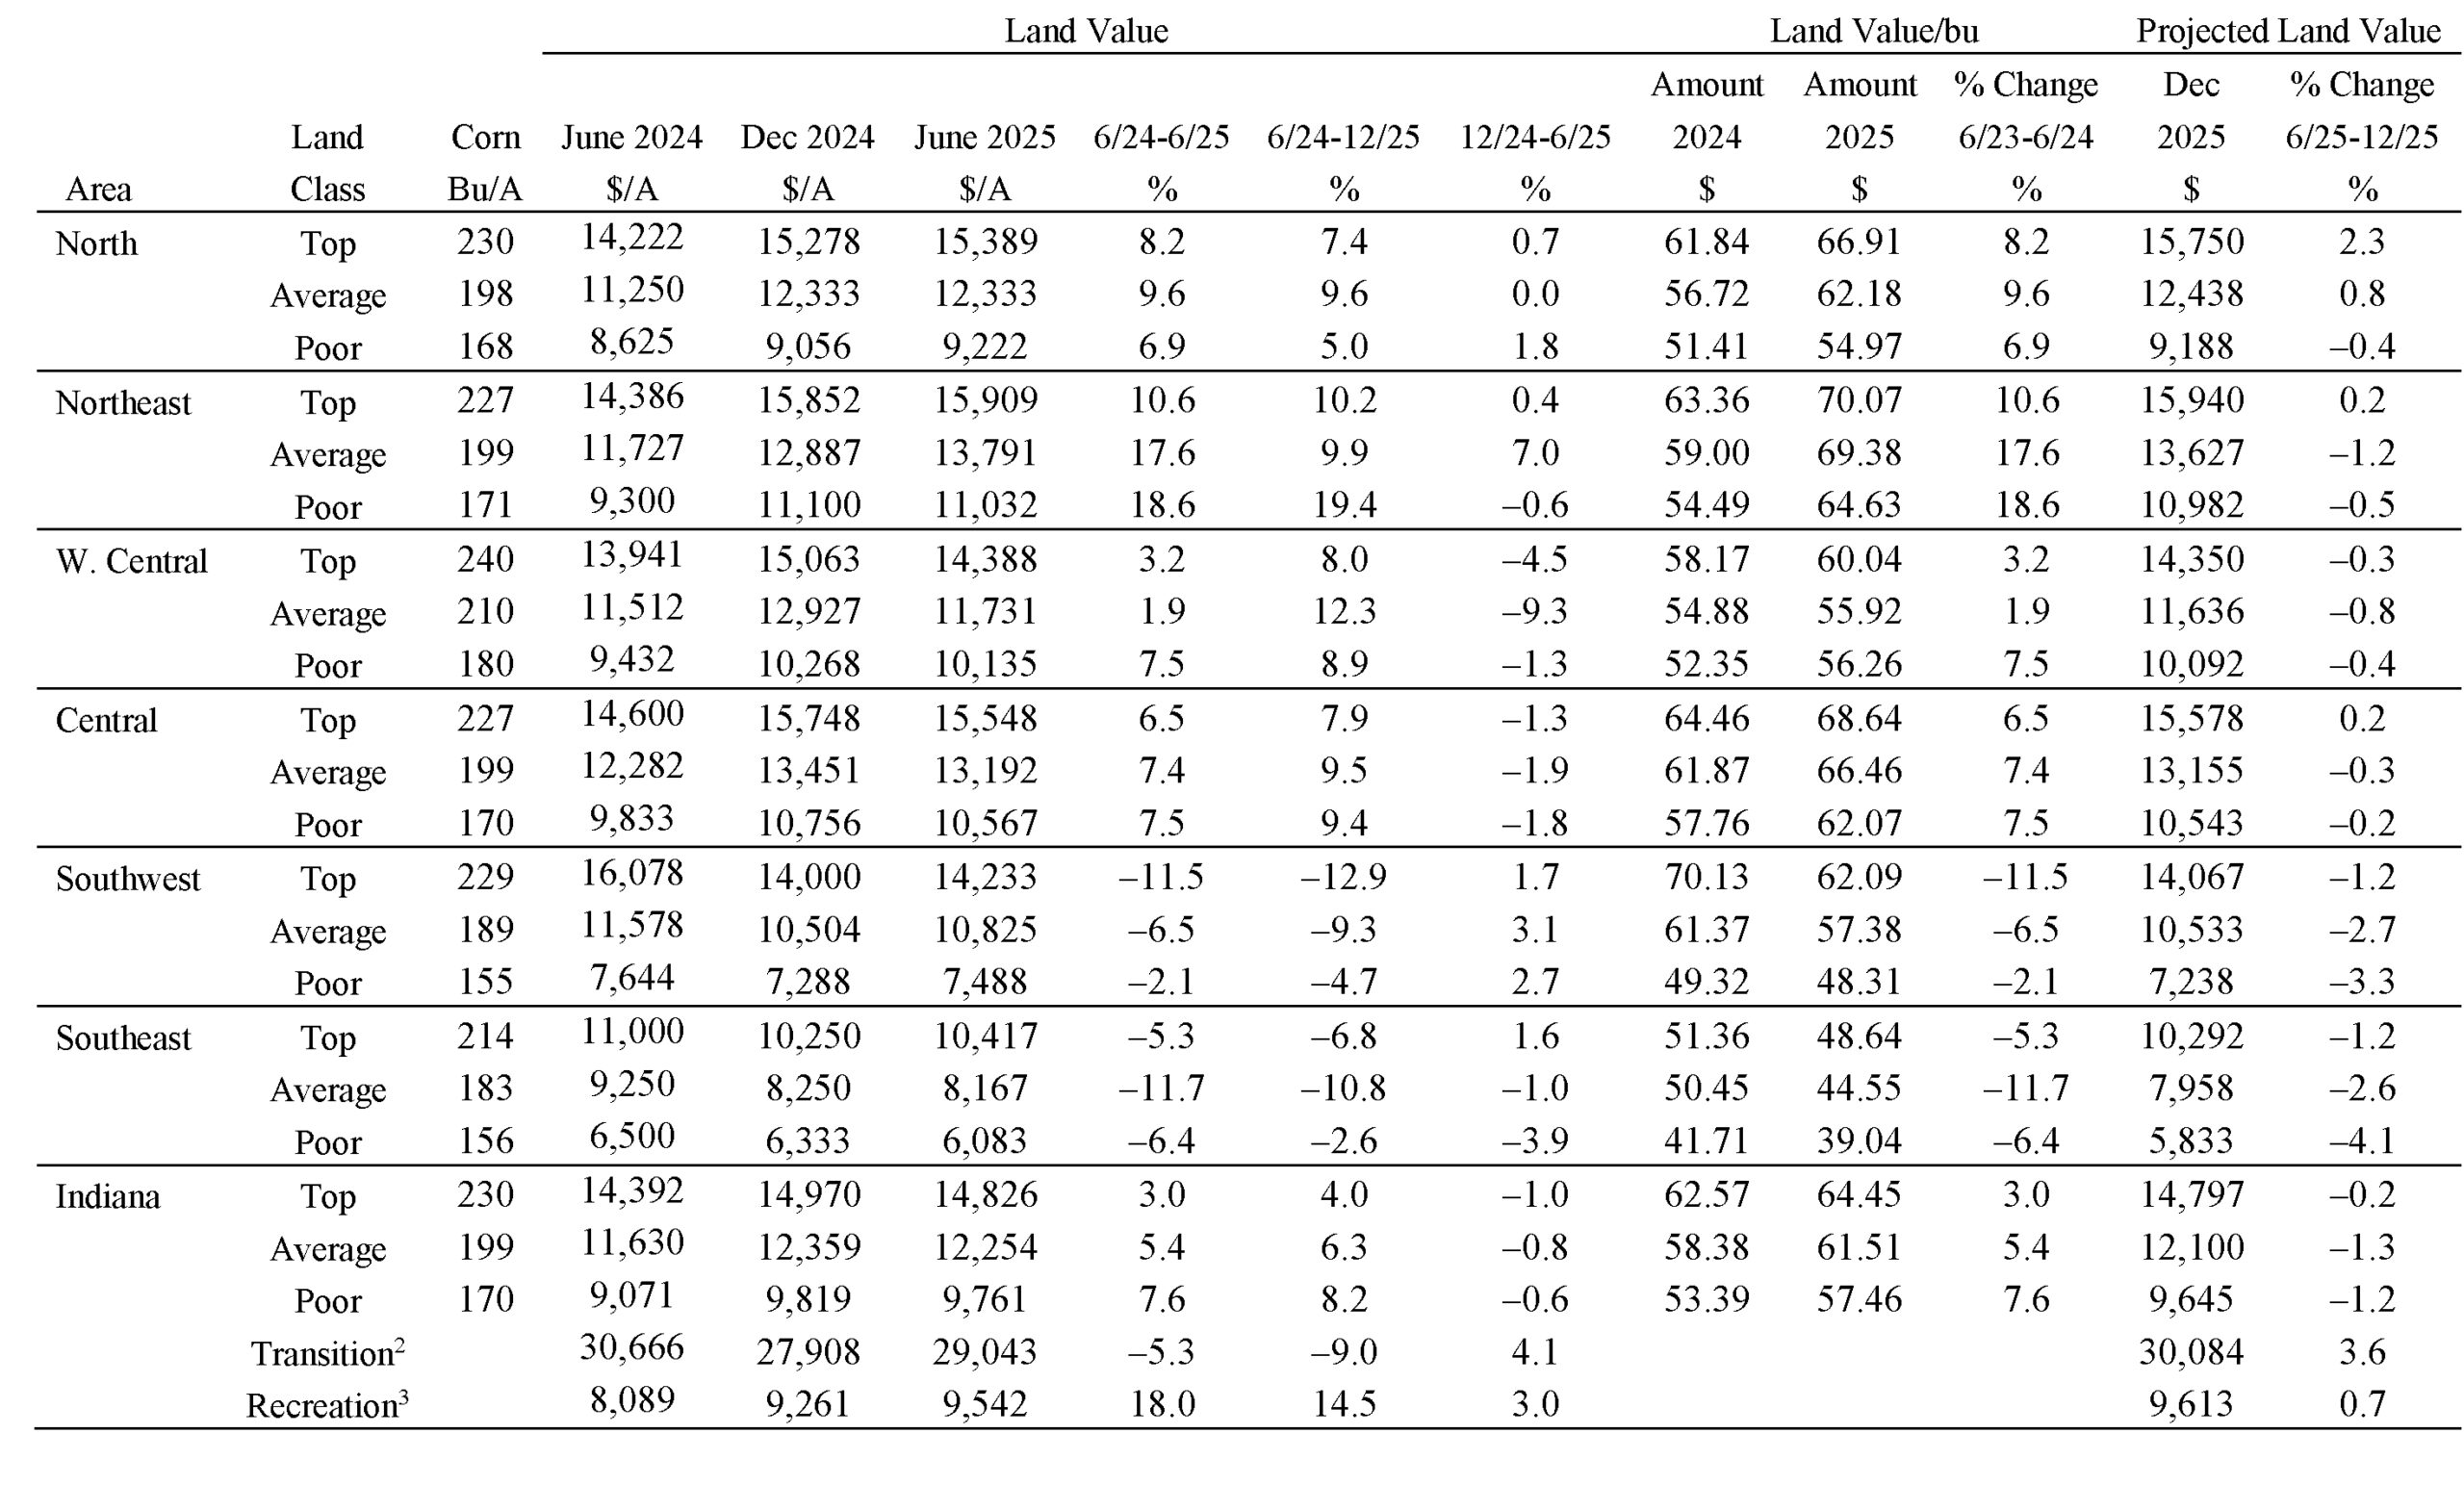
Table 1: Average estimated Indiana land value per acre (tillable, bare land), per bushel of corn yield, and percentage change by geographic area and land class, selected time periods, Purdue Land Value Survey, June 2025
Farmland Market Forces
Respondents were asked to evaluate the importance of ten market forces that may potentially influence the farmland market: (1) current net farm income, (2) expected growth rate in farm returns, (3) crop price level and outlook, (4) livestock price level and outlook, (5) current and expected interest rates, (6) returns to alternative investments, (7) outlook for U.S. agricultural export sales, (8) U.S. inflation rate, (9) cash liquidity of buyers, (10) current U.S. agricultural policy, and (11) farmland conversion to other uses. Respondents rate each market force on a scale of –5 to +5, with –5 being the strongest negative influence. A positive influence is given a value between 1 and 5, with 5 representing the strongest positive influence. A score of 0 indicates the force was not influential. An average for each item was calculated, and averages for 2023, 2024, and 2025 are included in Figure 2. The horizontal axis shows the item from the list above.
Similar to 2024, current farm incomes are putting downward pressure on farmland values, but the downward pressure appears greater in 2025. Crop prices continue to put downward pressure on farmland values, but the positive influence of livestock prices increased relative to the two previous years. As one respondent suggests, “the livestock market is helping hold up farmland values.” While interest rates continue to put downward pressure on farmland values, the pressure seems to being lower than it was in the recent years. One respondent also highlights the differences in adjustable and fixed mortgage rates this year. As suggested above, the strongest positive force for farmland prices remains the conversion to residential, commerical, or industrial uses (a category that was added to the survey in 2024).
Once again, a large portion of the respondents suggest less farmland on the market relative to a year earlier, yet at 49%, this sentiment was reported by slightly less half of all respondents. An additional 44% see transaction volumes unchanged from 2024. One respondent also notes that “sales are taking longer than previous years,” another measure of market liquidity.
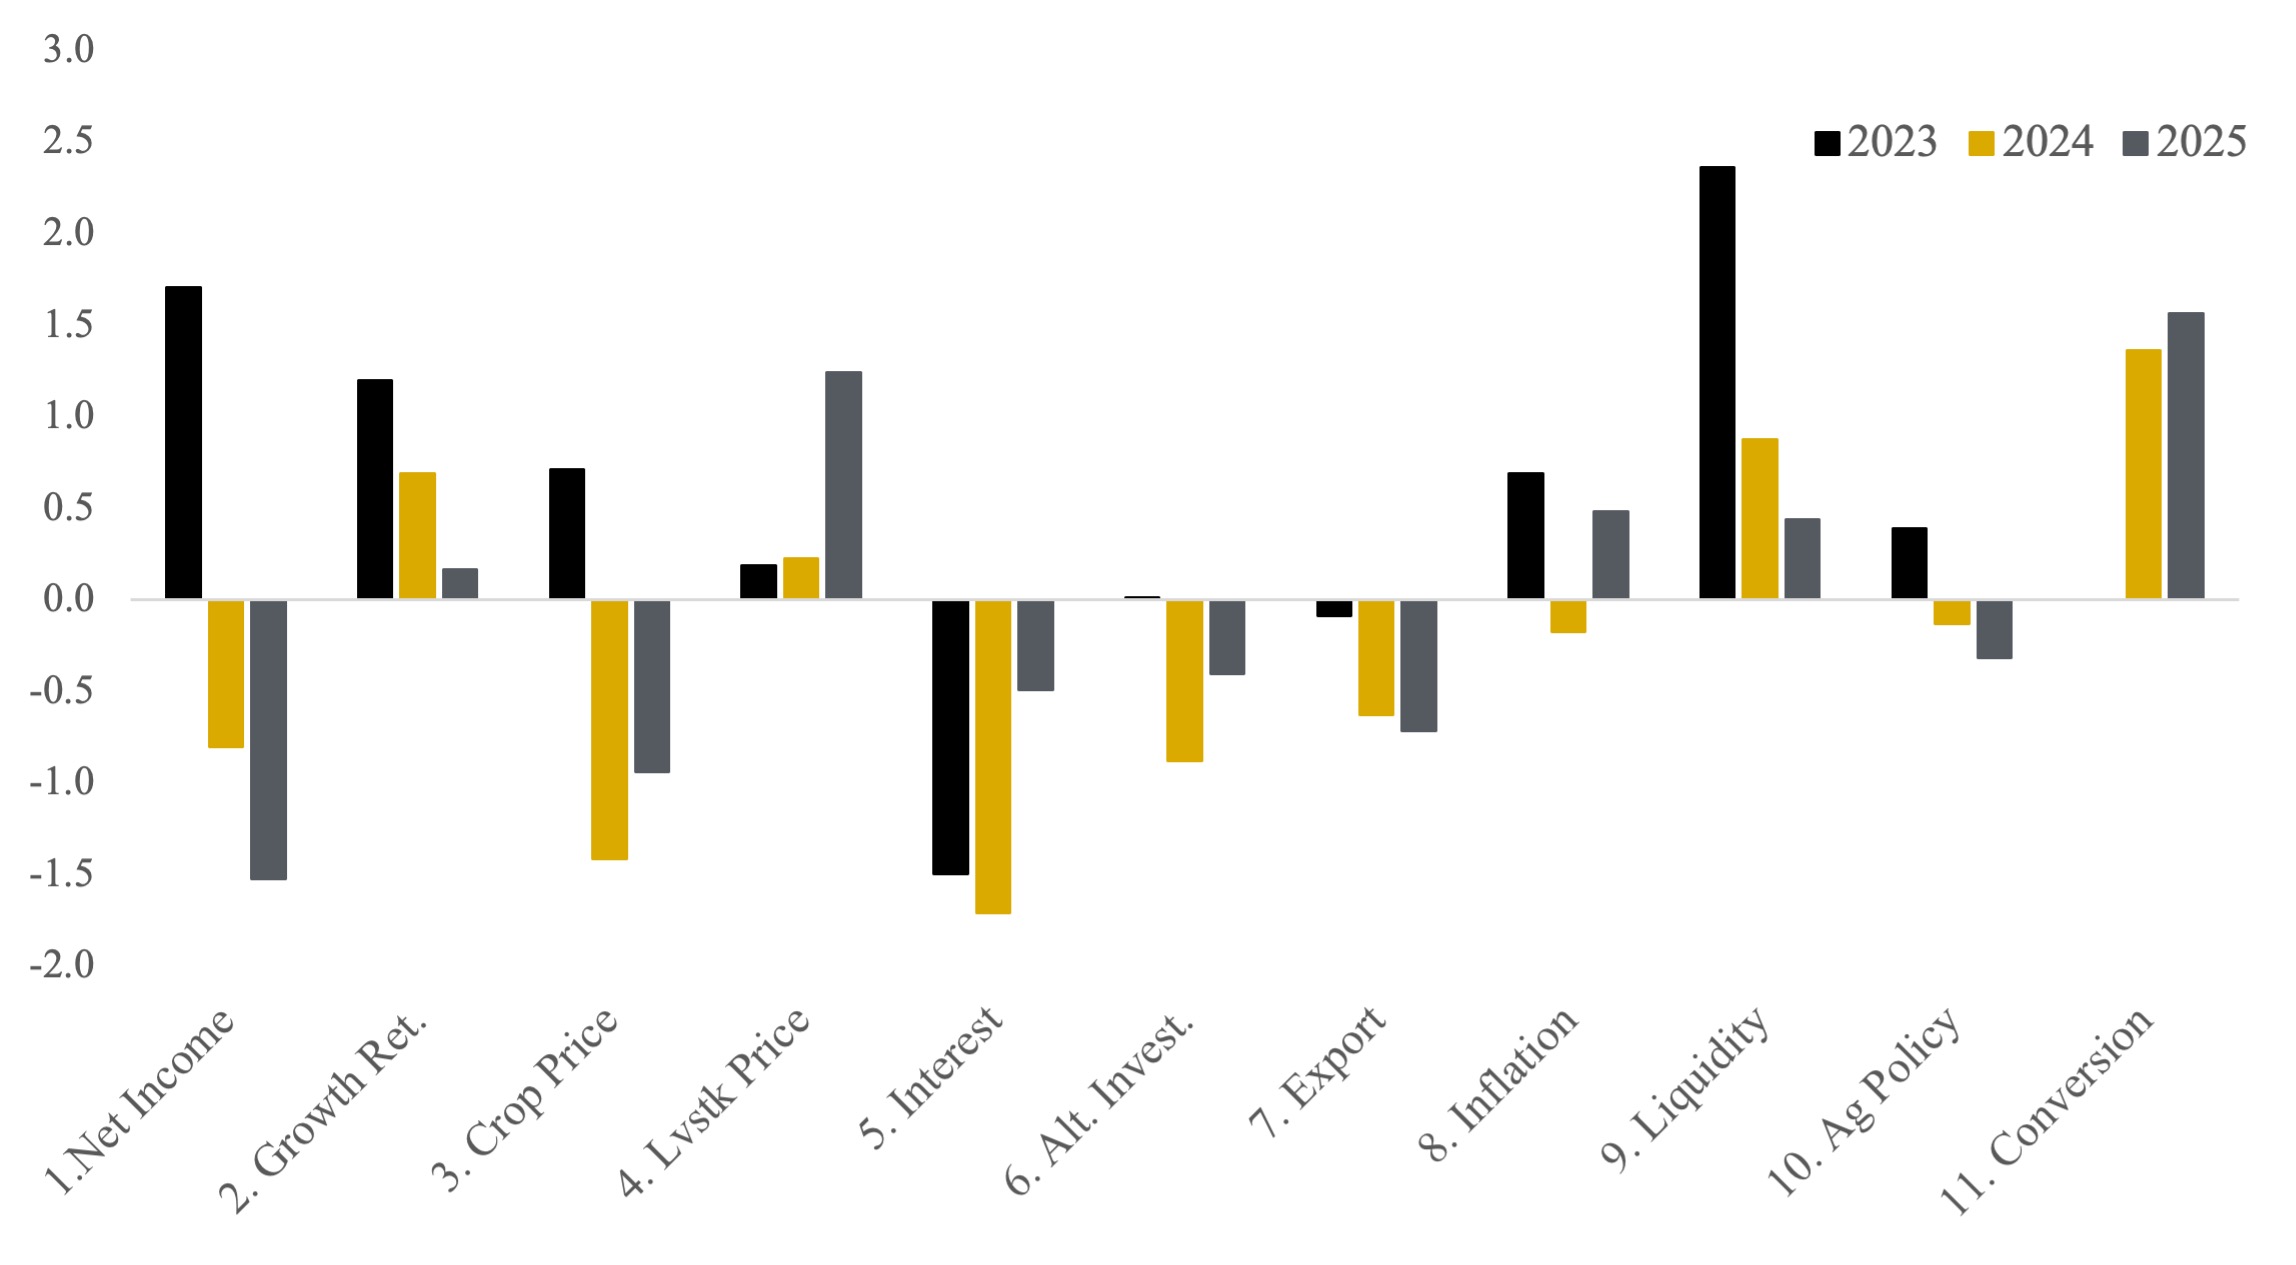
Figure 2: Influence of drivers of Indiana farmland values
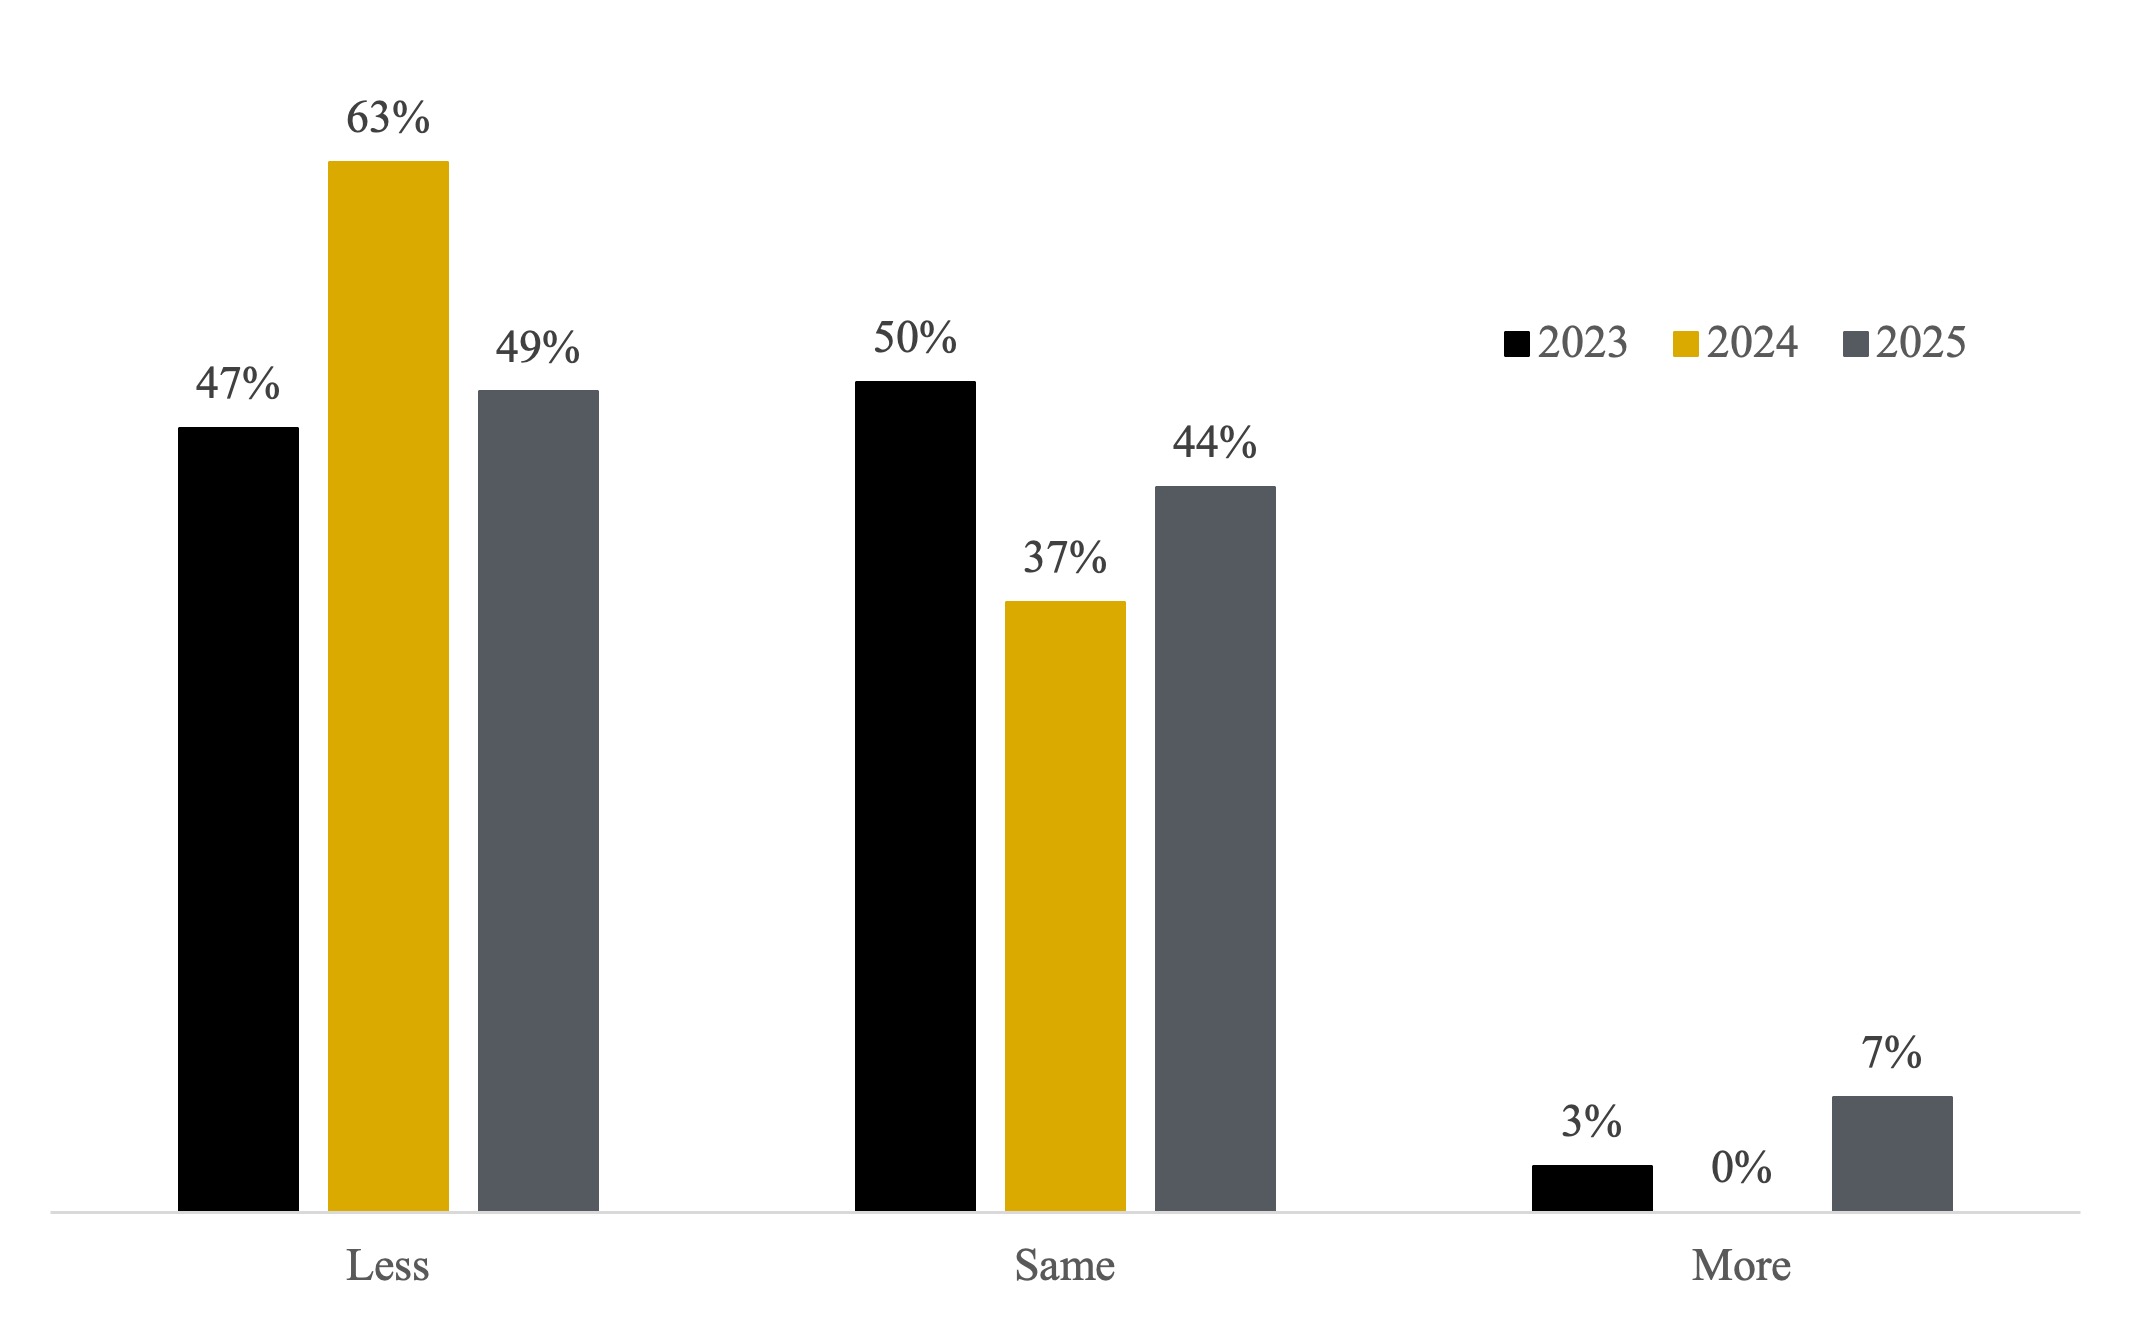
Figure 3: Percentage of respondents indicating less, same, or more farmland on the market than in the previous June
Five-Year Forecasts
While most respondents are modestly optomistic about farmland prices for the remainder of 2025, the survey’s five year outlook for corn and soybean prices is slightly more pessimist than recent years (Table 2). The respondents are optimistic for lower interest and inflation rates five years from now.
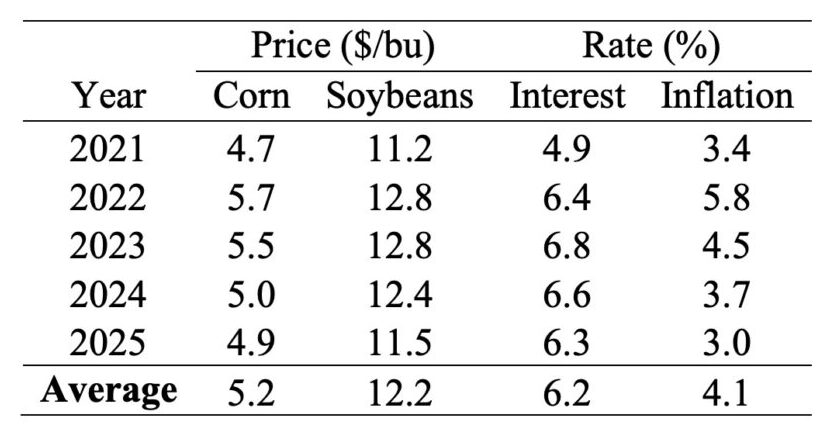
Table 2: Projected five-year average corn and soybean prices, mortgage interest, and inflation
Cash Rent
Statewide, cash rents exhibited a modest increase from 2024 to 2025 (Table 3). Indiana per acre cash rent for top quality land increased by 1.7% to $318, and per acre cash rent for average quality land increased by 1.6% to $264. The statewide average per acre cash rent for poor quality land increased by 1.53% to $207. Consistent with land vale changes, cash rents declined across all three quality grades in both the Southwest and Southeast regions. Thus, cash rent as a share of land values held relatively steady from the previous year and did not vary drastically across regions. In addition, rental rates per bushel of corn held relatively stable as well.
Looking Ahead
In sum, farmland prices increased modestly in 2025 at the state-level and across the northern two thirds of the state. However, farmland prices declined by varying degrees in the southern third of the state. Respondents generally expect prices to hold relatively stable for the remainder of the year, but, again, the expectations differ across the northern and southern poritons of Indiana. Traditional farmland price drivers suggest a mix of downward and upward pressure. Respondents remain concerned about interest expenses and crop prices but expect continued upward pressure from commercial and industrial development.
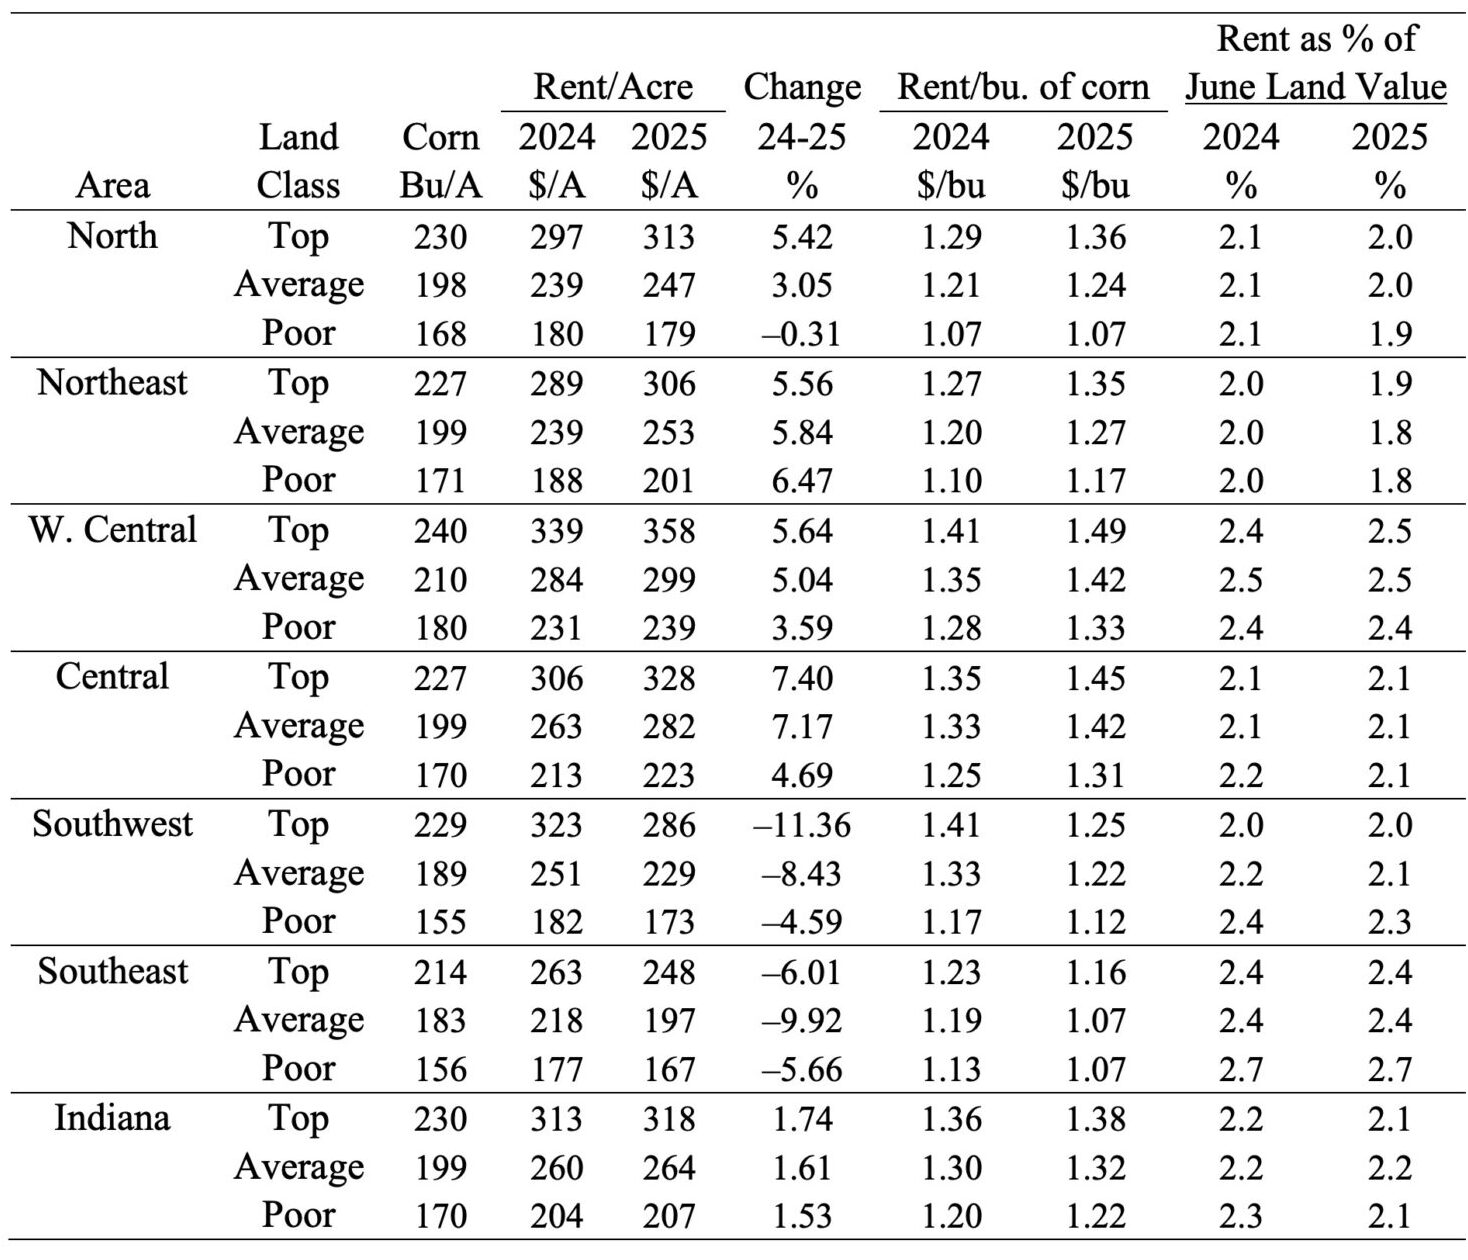
Table 3: Average estimated Indiana cash rent per acre, (tillable, bare land) 2024 and 2025, Purdue Land Value Survey, June 2025
Purdue Farmland Value and Cash Rent Survey
The Purdue Farmland Value and Cash Rent Survey is conducted each June. The survey is possible through the cooperation and contribution of numerous professionals knowledgable of Indiana’s farmland market. These professionals include farm managers, rural appraisers, land brokers, agricultural loan officers, farmers, and Farm Service Agency (FSA) county office directors.
These professionals were selected because their daily work requires they stay well informed about farmland values and cash rents. These professionals provide an estimate of the market value for bare poor, average, and top quality farmland in December 2024, June 2025, and a forecast for December 2025. To assess productivity of the farmland, respondents provide an estimate of long-term corn yield for top, average, and poor productivity farmland. Respondents also provide a market value estimate for land transitioning out of agriculture and for recreational land.
The data reported here provide general guidelines regarding farmland values and cash rent. To obtain a more precise value of an individual tract, contact a professional appraiser or farm manager that has a good understanding of the local market.
Prior reports are located at: https://purdue.ag/paer_archive
1 The land values contained in this summary represent averages over several different locations and soil types. Determing the value for a specific property requires more information than is contained in this report and should include an evaluation by a professional appraiser.
2 Transistion land is land moving out of production agriuclture into other, typically higher value, uses.
3 Recreation land is land located in rural areas used for hunting and other recreational uses.
![]()
![]()
![]()
![]()
![]()
