Are farmland price expectations “wrong”? It depends how you ask.
August 19, 2025
PAER-2025-12
Author: Dewey J. Robertson, MS Agricultural Economics Student
![]()
![]()
![]()
![]()
![]()
This article summarizes Dewey J. Robertson’s masters thesis, which is available here.
Farmland is the single largest asset in American agriculture— valued over $3.5 trillion, accounting for 83% of total U.S. farm assets (USDA ERS, 2024). Because land plays such a central role in farm wealth and credit, understanding how farmland expectations are formed are critical for producers, lenders, and landowners.
Every year, surveys, such as the Purdue Farmland Values and Cash Rents Survey, ask agricultural professionals to report future farmland price expectations. The Purdue Farmland Values and Cash Rents Survey provides farmland price expectations and observed prices for three quality grades (top, average, poor) at the state level and for six regions. Table 1 provides summary statistics on selected historical expectations and observed prices. Reports from these surveys enable producers and investors to make more informed decisions by providing reference points representative of their own lands.
Farmland prices vary quite a bit across Indiana. The West Central and Central Regions consistently have higher average observed farmland prices for all three quality grades. The Southeast region, in contrast, has the lowest average prices across all quality grades. These differences likely relet differences in productivity, land use potential, or other market influences such as proximity to growing urban areas.
Expectations, however, often fail to accurately predict future farmland prices. Figure 1 shows the prediction error of farmland price expectations as a percentage. While the magnitudes of expectation errors differ by region and quality grades, patterns of expectation errors remain constant through time. Two common measures of expectation errors, mean absolute error (MAE) and root mean square error (RMSE), are provided in table 1. MAE measures the average magnitude of errors in absolute value, treating all errors equally. RMSE, on the other hand, examine the average of square errors which penalizes large errors more than small ones. While average prices vary, the accuracy of price expectations is consistent across regions looking at the MAE. The higher RMSE, however, indicates that market experts in the Southeast make larger errors, likely due to unique market conditions or harder-to-predict factors.
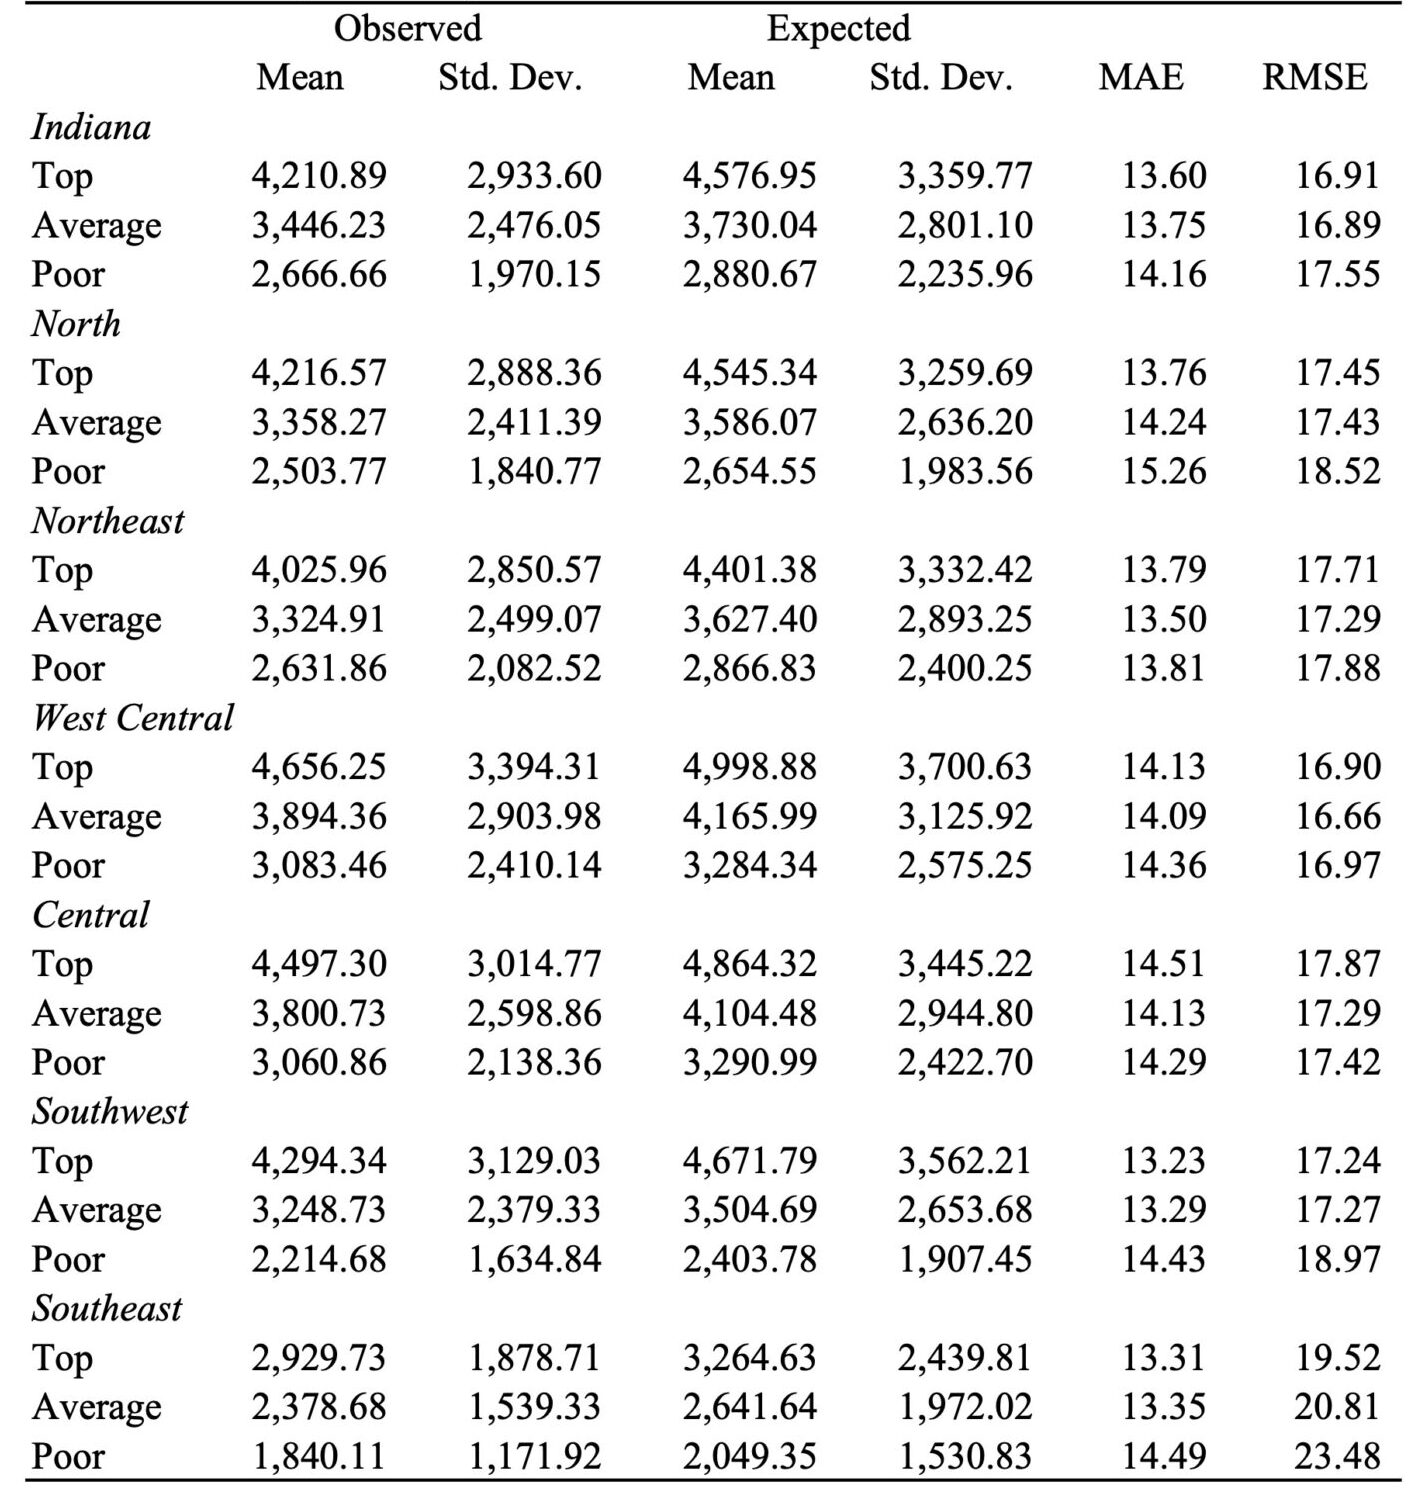
Figure 1. Farmland price expectation errors by quality grade and region, 1980-2023.
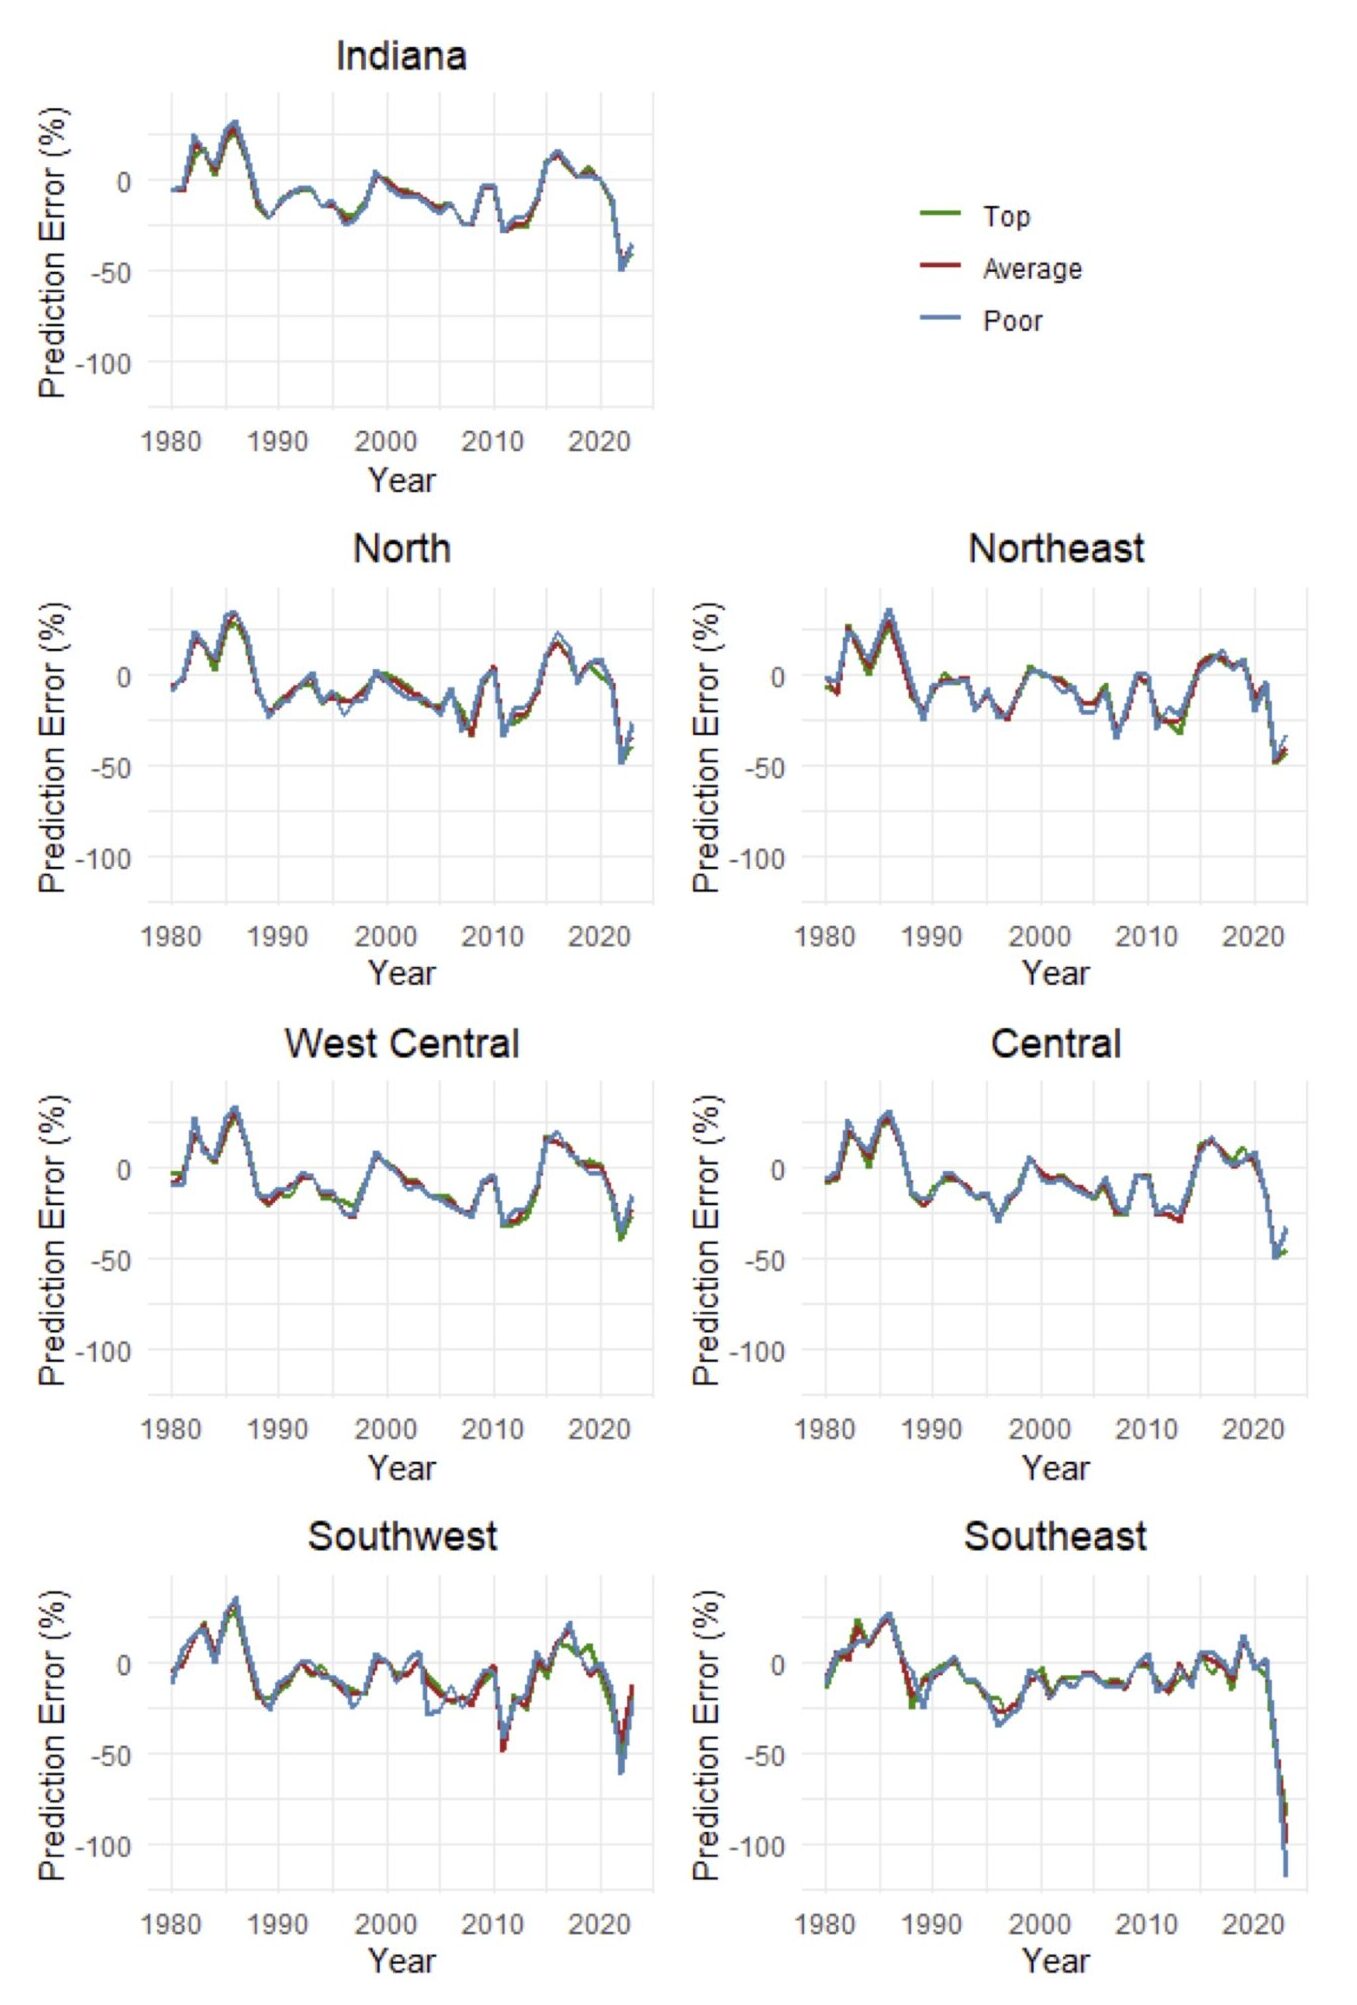
Figure 1. Farmland price expectation errors by quality grade and region, 1980-2023.
Prior economic research has found not only that farmland price expectations are often wrong but also that they are “irrational”—that is, they consistently over or underpredict (biased) or fail to fully use all available information (inefficient). But there may be an underlying issue causing this: what if we have been misunderstanding how people think about their expectations?
Most surveys, including the Purdue Farmland Values and Cash Rents Survey, ask for a single number to represent future price expectations but do not clarify the specific statistical number to report. Are respondents then reporting future price expectations as the average expected price, the most likely price, or something else entirely?
To answer this question, we test expectation rationality using data from the Purdue Farmland Values and Cash Rents Survey. Traditional rationality tests assume that reported values are the mean (average) of expected future prices. Because the survey does not specify to report the mean expected future price, these expectations may be deemed “irrational” when they fail to accurately predict the average future price. However, in reality, they may be rationally predicting other values of future prices such as the most likely (mode) or the midpoint (median).
In my thesis research, I use new statistical tools developed by Dimitriadis et al. (2025) to test farmland price expectation rationality at the mean, median, and mode. I found that expectations are rational in every case when interpreted as the mean or the mode, but never the median. In 52% of cases, expectations were considered rational when interpreted as the average (mean) expected price. In 72% of cases, expectations were considered rational when interpreted as the most likely value (the mode) of expected prices. In an overlapping 24% of cases the mean and mode are indistinguishable from one another meaning they could be reporting the average or most likely expected price or that these two values are close together. In these overlapping cases, it is possible to consider them as the most likely future price at the aggregated state level. They are found to be mode rational. Price expectations for higher quality lands (top and average) are more often the most likely future price when compared to price expectations for poorer quality lands that reflect the average future price.
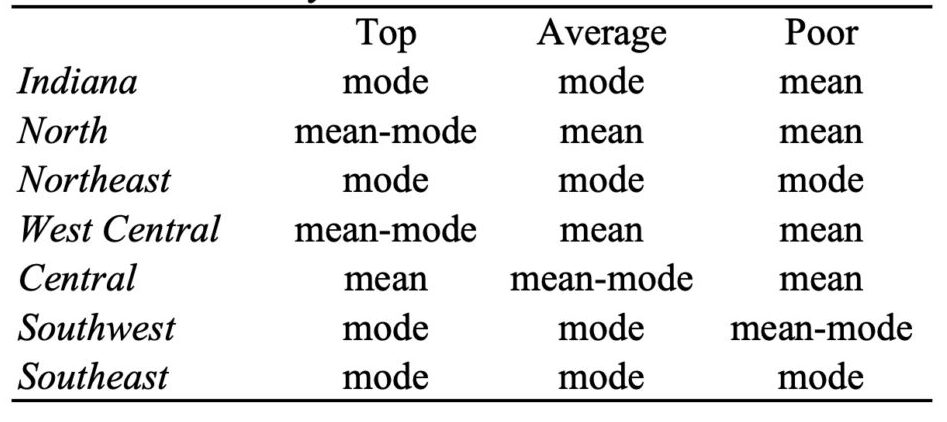
Table 2. Rationality Results
So, farmland price expectations aren’t “wrong”—they’re just not always averages. This explains, at least partially, why previous studies found bias; they assumed people were reporting the average expected price, when in reality, they may have been reporting the “most likely” expected price. Producers and investors using price expectations from the Purdue Farmland Values and Cash Rents Survey should consider expectations as the “most likely” future price in their decision making.
Key takeaway: farmland price expectations may be more useful than they look—if we understand how to read them right.
References
Dimitriadis, T., A.J. Patton, and P.W. Schmidt (2025) “Testing Forecast Rationality for Measures of Central Tendency” Review of Economics and Statistics, forthcoming. https://doi.org/10.1162/rest_a_01535
![]()
![]()
![]()
![]()
![]()
