2026 Agricultural Credit Outlook
March 23, 2026
PAER-2026-11
Authors: Joshua Strine, Ph.D. Student, Agricultural Economics; Morgan Mastrianni, Ph.D. Student, Agricultural Economics
![]()
![]()
![]()
![]()
![]()
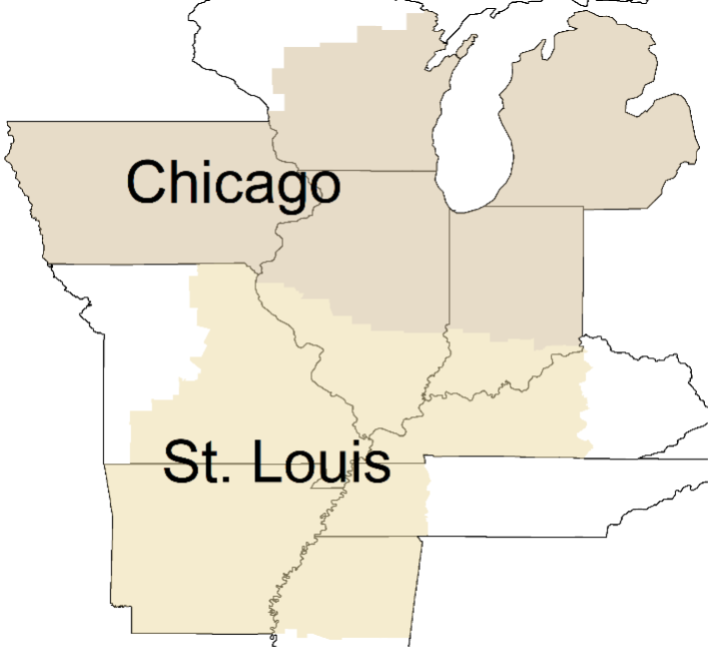
This article examines trends in three key areas of the agricultural credit markets: interest rates, loan supply and demand, and non-performing loans. We examine data obtained from the Federal Reserve Banks of Chicago and St. Louis. As shown in Figure 1, 68 counties in northern and central Indiana are part of the Federal Reserve Bank of Chicago District, and 24 counties in southern Indiana are part of the Federal Reserve Bank of St. Louis. Both Federal Reserve banks conduct quarterly surveys of agricultural bankers in their District. The surveys address fundamental issues in farmland and agricultural credit markets. It is important to note that both Federal Reserve Districts cover large areas with diverse agricultural sectors. Thus, local conditions may deviate from District-level trends. At the time of writing, data for the St. Louis District and Chicago District were available through the third quarter of 2025 through the Federal Reserve Bank of Kansas City’s Agricultural Finance Updates.
Figure 1
Chicago and St. Louis Federal Reserve Districts
For the second year in a row, agricultural credit market conditions have deteriorated in the St. Louis and Chicago Districts. While crop prices have decreased, input costs have increased. Decreasing farm profits over the past three years have contributed to an increased demand for agricultural loans and lower agricultural loan repayment rates. However, land prices have remained stable or increased, and interest rates have decreased (Kreitman, 2025; Oppedahl and Kepner, 2025).
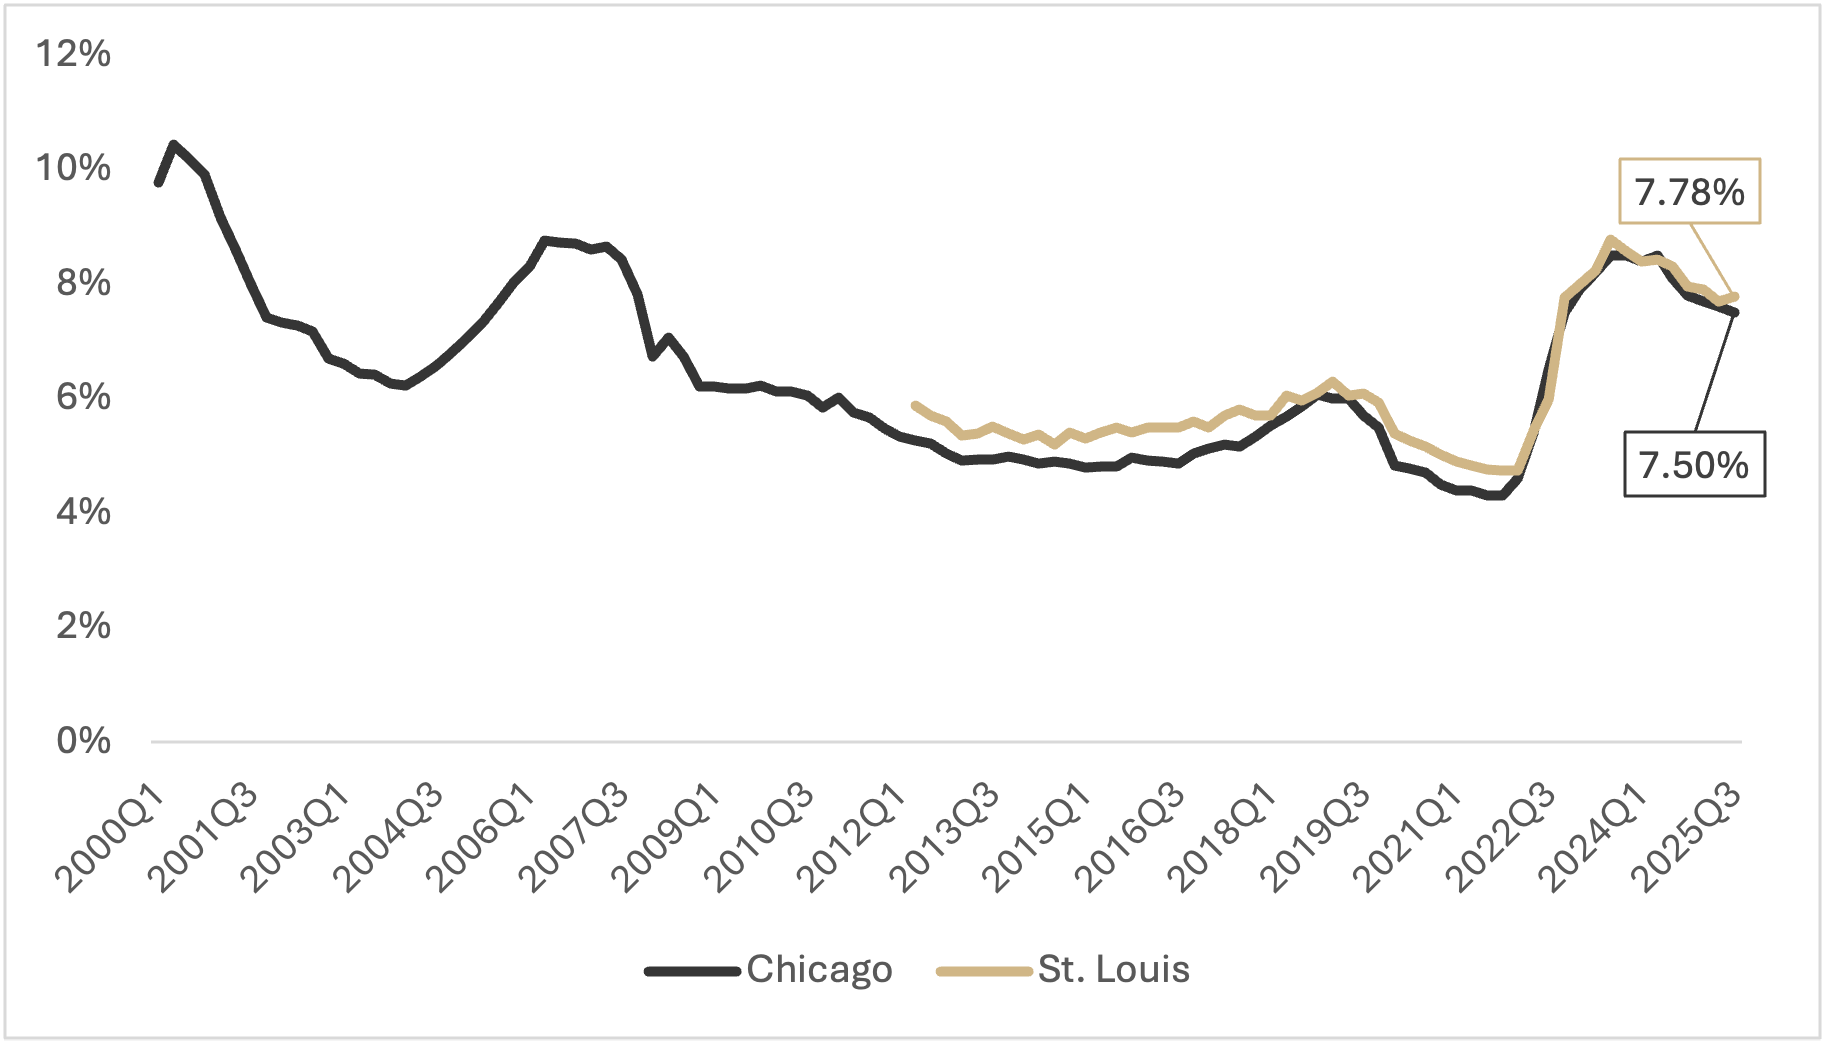
Average interest rates on farm operating loans, used primarily to finance crop production and livestock expenses, have decreased over the past five consecutive quarters (Figure 2). Since the end of last year, interest rates have fallen by 0.3 percentage points in the Chicago District and 0.17 percentage points in the St. Louis District. However, interest rates remain at levels unseen since 2007. As of the third quarter of 2025, operating loan interest rates for the Chicago District were 7.50%, while operating loan interest rates for the St. Louis District were 7.78%.
Figure 2
Average Fixed Interest Rate on Operating Loans, 2000Q1-2025Q3
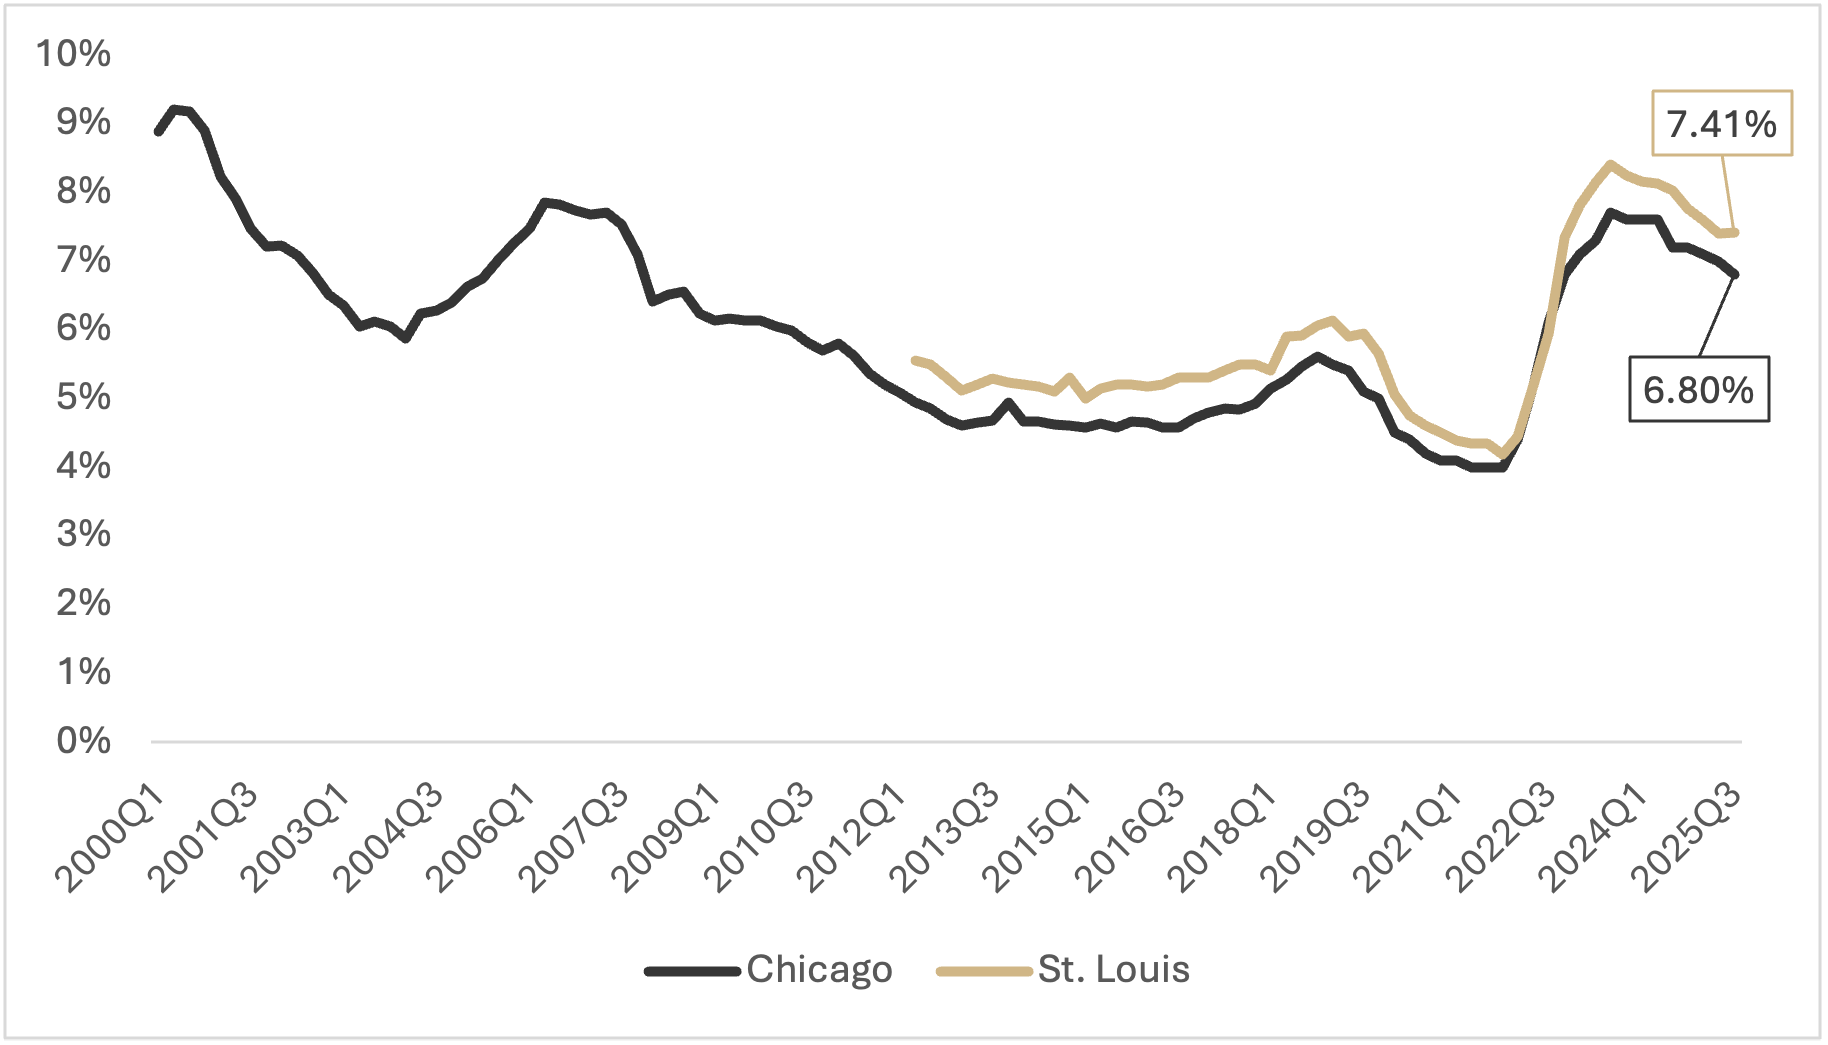
Average fixed interest rates on long-term farm real estate loans have decreased over the past eight quarters (Figure 3). The decrease in interest rates for farm real estate loans closely follows the decrease in interest rates for farm operating loans in both Federal Reserve Districts. Interest rates are down 0.4 percentage points in the Chicago District and 0.36 percentage points in the St. Louis District from the fourth quarter of 2024. Despite consistent, moderate decreases in interest rates for farm real estate loans over the past two years, these interest rates remain at their highest levels since 2007. The most recent survey results suggest an average farm mortgage rate of 6.80% in the Chicago District and 7.41% in the St. Louis District.
Figure 3
Average Fixed Interest Rate on Long-Term Farm Real Estate Loans, 2000Q1-2025Q3
One key predictor of where interest rates will go is the federal funds rate.[1] For example, the Federal Open Market Committee (FOMC) lowered the target range for the federal funds rate by 0.75 percentage points during 2025, which led to a decrease in interest rates on agricultural loans this past year. At every other FOMC meeting, the Committee releases the “Summary of Economic Projections”, which reflects the FOMC’s views on specific economic indicators. A median target range for 2026 of 3.25-3.50% for the federal funds rate, 0.25 percentage points below the current target rate, was published in the most recent Summary. However, there is substantial variance among individual members’ assessments of the target rate for next year. Further decreases in the federal funds rate will depend on whether the US economy continues to show declining inflation and stable unemployment. The December “Summary of Economic Conditions” projects stability in the unemployment rate and a decrease in inflation for 2026.
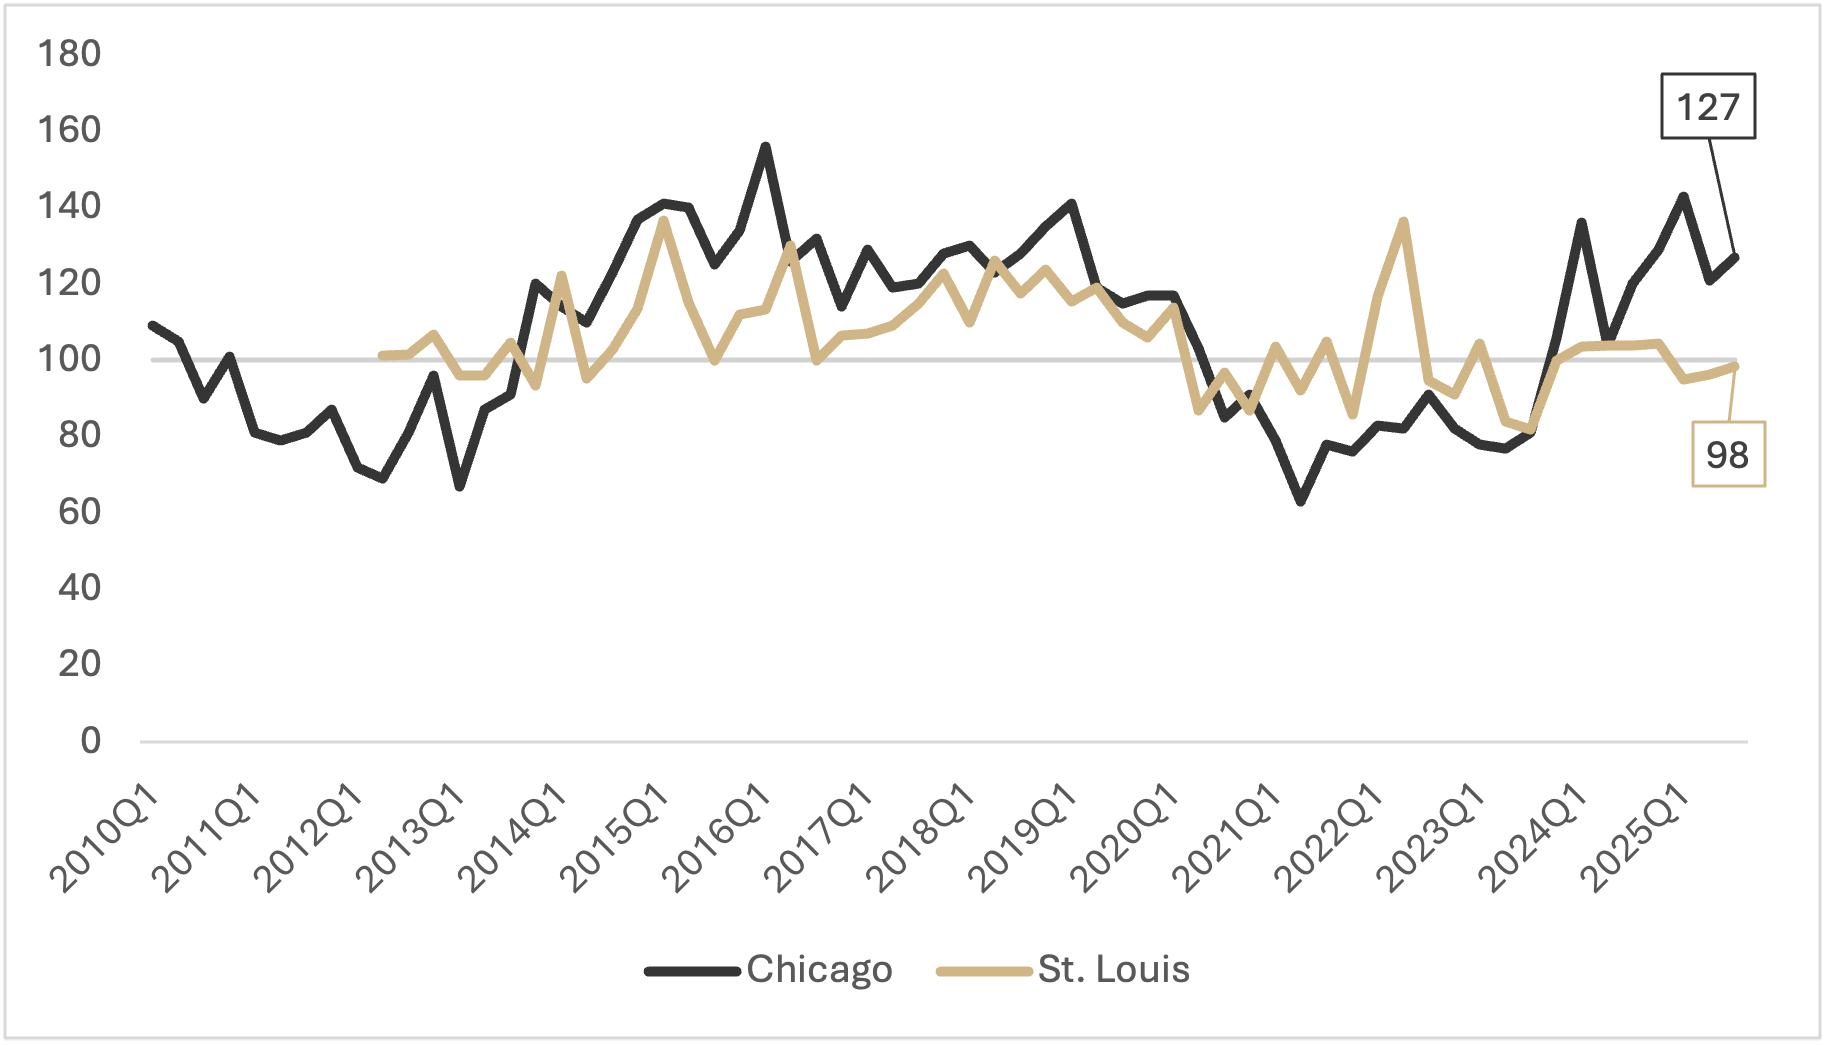
The Federal Reserve Bank Ag Credit Surveys ask agricultural bankers to report whether the demand for loans is “higher,” “lower,” or the “same” relative to a year earlier. These responses are summarized by a loan demand index, calculated as the share of lenders reporting “higher” minus the share reporting “lower,” plus 100. Thus, when the loan demand index is below 100, demand for agricultural loans is decreasing. Among all indices measured by the Ag Credit Surveys, demand for loans shows the greatest gap between the two Districts (Figure 4). It is important to note that these indices also represent areas outside of Indiana. Therefore, it is possible that the difference in loan demand in northern and southern Indiana does not diverge as much as the data suggests. In the Chicago District, the demand for agricultural loans has increased over the past two years. This may be attributed to the continued downturn in farm income, which reduces farmers’ liquidity and increases their need for capital. Additionally, decreased interest rates for agricultural loans may be driving the quantity of loan demand. In the St. Louis District, demand for agricultural loans has remained stable since the fourth quarter of 2023, with the index remaining within 5 points of the baseline during that time.
Figure 4
Demand for Agricultural Loans, 2010Q1-2025Q3
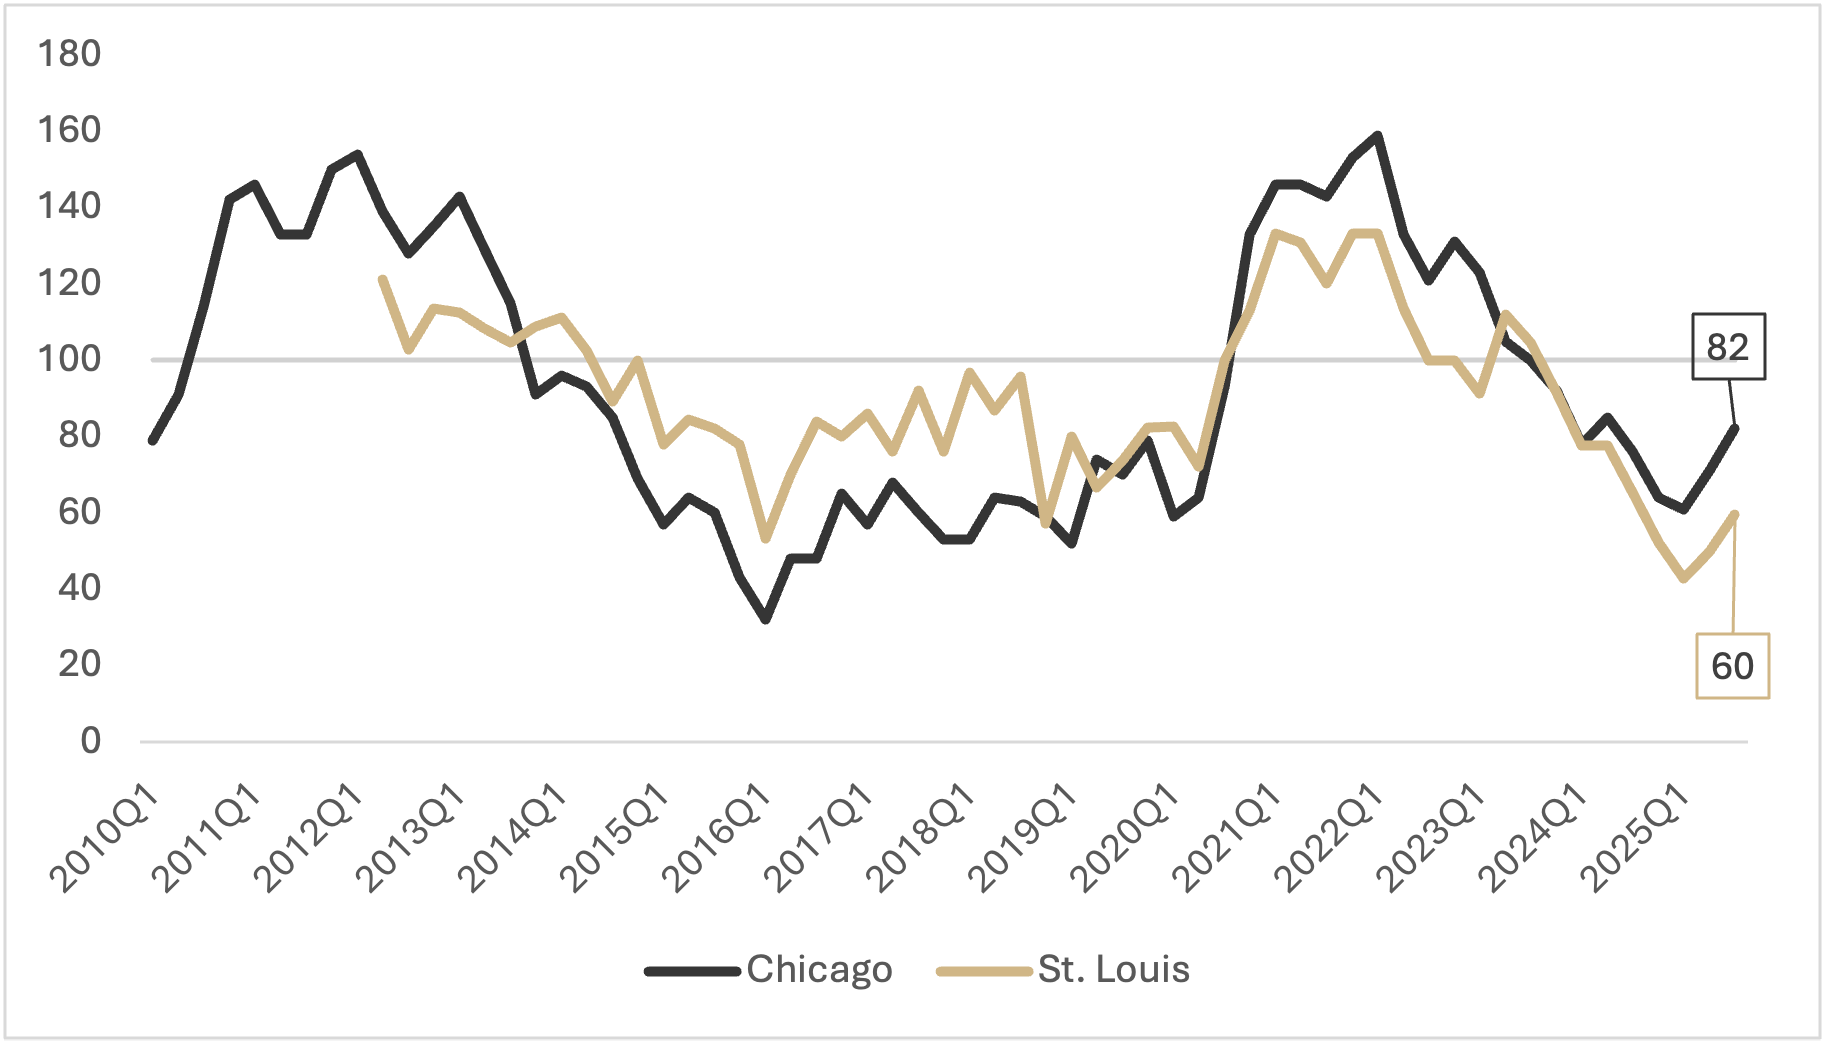
Bankers report a decrease in the availability of funds during the third quarter of 2025. Figure 5 shows the index for the availability of funds at agricultural banks. When the index is below 100, the amount of available funds has decreased relative to the prior year. A trend that began in 2022 was that bankers reported having fewer funds available to loan than in previous years. This trend has continued through 2024 and 2025, as agricultural bankers in the Chicago and St. Louis Fed Districts continue to report lower funds available for loaning.
Figure 5
Availability of Funds at Agricultural Banks, 2010Q1-2025Q3
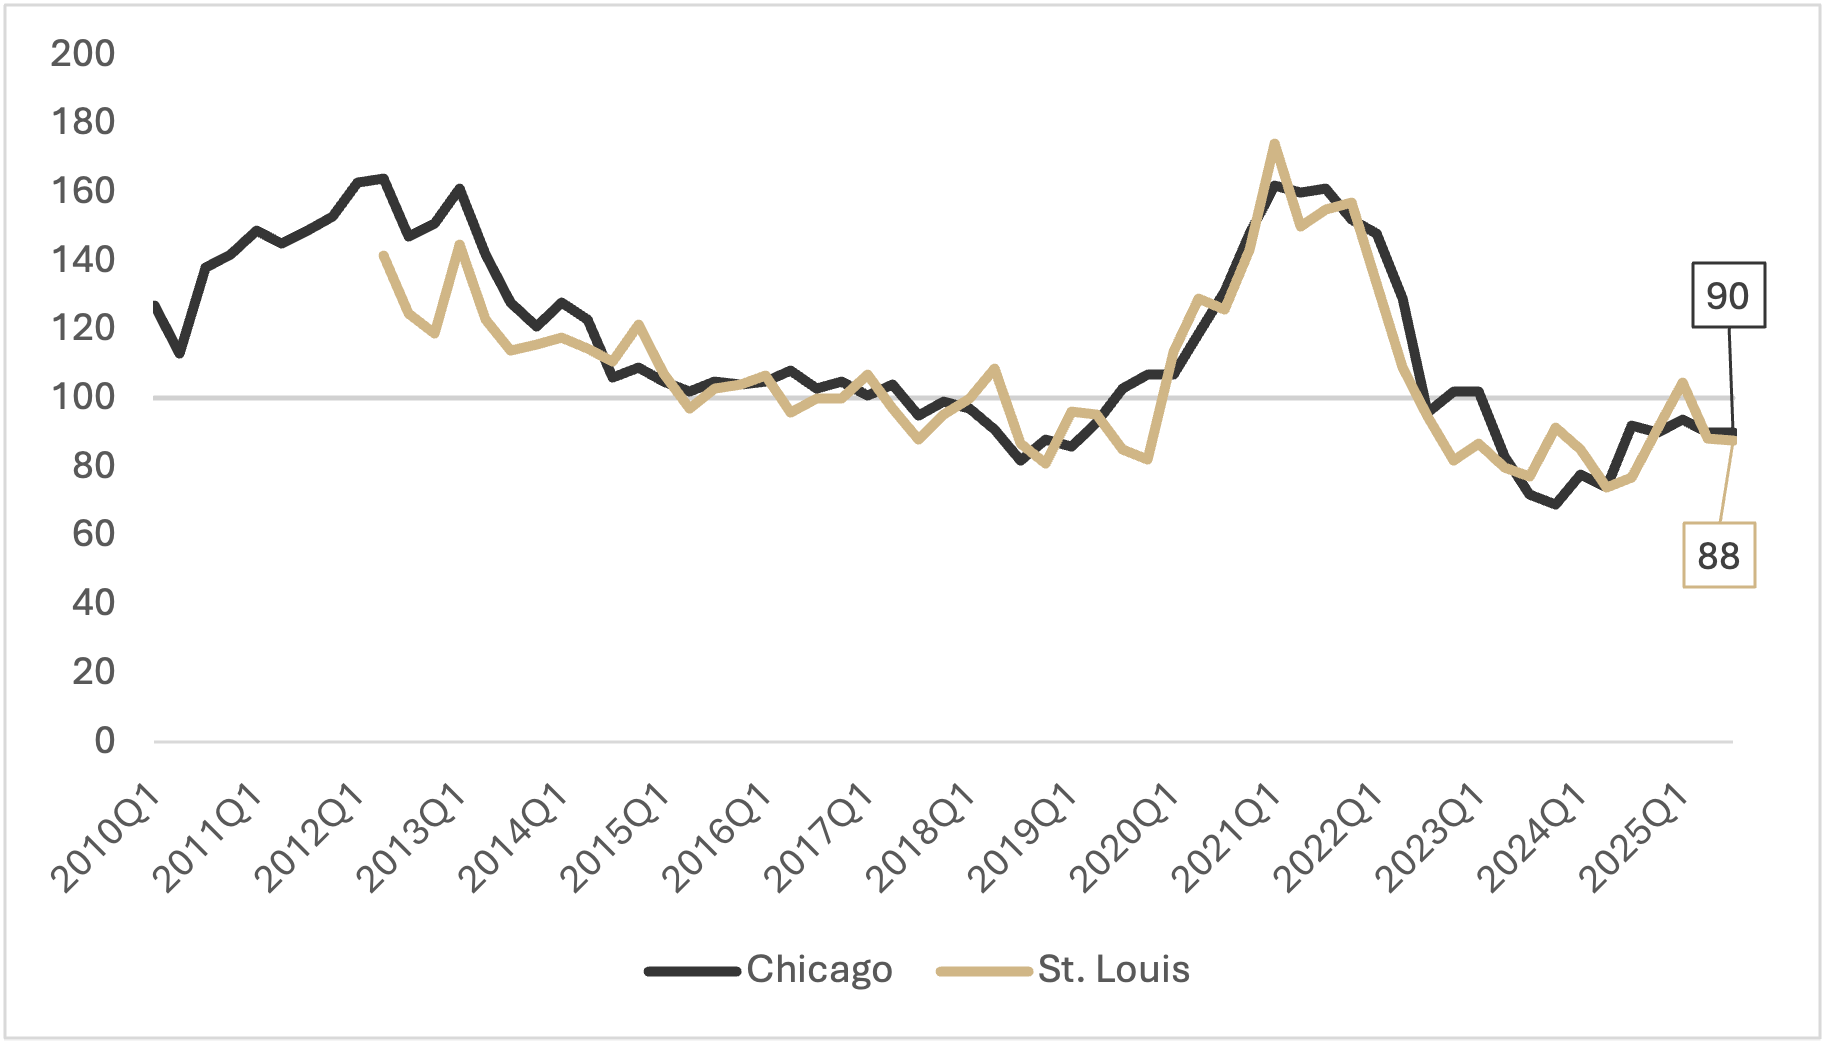
Figure 6 shows the loan repayment index for the Chicago and St. Louis Districts from the first quarter of 2010 through the third quarter of 2025. There have been eight consecutive quarters in which repayment rates have been lower than one year prior, according to agricultural bankers in the Chicago and St. Louis Districts (Figure 6). This is a sharp contrast with 2021 through 2023, when farmers’ repayment rates increased year over year. The recent downturn in the index suggests farmers are struggling more to pay off their debts.
Figure 6
Loan Repayment Index, 2010Q1-2025Q3
The data from 2025 suggests a pessimistic outlook for the agricultural credit market, similar to last year’s outlook. Farm incomes in the St. Louis District have fallen for two straight years as liquidity issues have continued to grow in both districts (Kreitman, 2025; Oppedahl and Kepner, 2025). The impacts can already be observed in the lender-reported increase in demand for agricultural loans and decrease in loan repayment rates. Further tightening the market is the reduced availability of funds at agricultural banks. However, the decline in interest rates offers a slightly positive outlook for agricultural credit markets. The FOMC projects that it will lower the target range for the federal funds rate again in 2026, but only by 0.25 percentage points (FOMC, 2025). Due to the high variability in FOMC individual projections and the minimal projected lowering, decreases in agricultural loan interest rates may be more moderate. Overall, the agricultural credit market followed the trend that started last year and is in worse condition than in recent years. Unless there is a turnaround in farm profitability, decreasing interest rates may be the sole positive as we look ahead to next year.
[1] The federal funds rate is the interest rate at which deposit-granting institutions (i.e., banks) trade federal funds with each other.
References
Federal Open Market Committee. 2025. Summary of Economic Projections. Federal Reserve, December. Available here: https://www.federalreserve.gov/monetarypolicy/files/fomcprojtabl20251210.pdf
Agricultural Finance updates. (2025). https://www.kansascityfed.org/center-for-agriculture-and-the-economy/ag-finance-update-archive/
Kreitman, T. (2025, August 26). Weakness in crop sector weighs further on farm finances. https://www.kansascityfed.org/agriculture/agfinance-updates/weakness-in-crop-sector-weighs-further-on-farm-finances/
Oppedahl, D. and E. Kepner. 2025. Midwest Farmland Values Moved Up Modestly in the Third Quarter. Federal Reserve Bank of Chicago, AgLetter No. 2010, November. https://www.chicagofed.org/publications/agletter/2025-2029/november-2025
![]()
![]()
![]()
![]()
![]()
