Caring Stress Index: What is Happening in Indiana and the Midwest?
March 23, 2026
PAER-2026-13
Authors: Laura Montenovo, Agricultural Economics Assistant Professor, State and Local Finance; Roberto Gallardo, Agricultural Economics Associate Professor, Vice President for Engagement; Maria Marshall, James and Lois Ackerman Professor of Agricultural Economics
![]()
![]()
![]()
![]()
![]()
Report by Laura Montenovo – based on research with Roberto Gallardo and Maria Marshall
Demographic, economic, and institutional patterns across the United States have been dramatically changing the supply and demand of caregiving, both for children and for the elderly. These changes shape caregiving stress in local areas across the counties of the United States and impact the difficulty of households to care for infants and elderly dependents.
The caregiving stress affects both the labor and psychological outcomes of households, especially for individuals who face the expectations of caregiving within their family units. Such stress is exacerbated by two forces: the demand side, consisting of the need, both in terms of the presence and intensity of caregiving, and the supply side, consisting of the infrastructure providing formal care to children and the elderly. Based on the intensity of these forces, the socioeconomic dynamics within households may be more or less disrupted, affecting their economic and health outcomes.
My co-authors, Roberto Gallardo and Maria Marshall, and I have used several variables to build a county-level index across the United States, quantifying the stress in each county from on-demand and supply variables affecting caregiving needs. This index provides key information regarding where such stress is perceived the most, offering valuable data to communities and policymakers regarding where the largest gaps are present, and appropriate policies and targeted investments are most needed.
To build the index, we use data from the 5-Year American Community Survey (ACS), County Business Patterns, and County Health Ranking. From these datasets, we pull 14 variables that shape either the demand or supply of caregiving needs. For example, we use variables on demographic composition (e.g., age and disability of the population or household composition) or income to determine the demand for care. On the other hand, we use variables on residents’ place of birth, labor market outcomes (e.g., remote work), or establishment numbers to determine the supply of care.
Both caring stress demand and supply variables were transformed into z-scores, and by subtracting the supply z-score from the demand z-score, we obtained the caring stress z-score.
In this report, we show details on Indiana’s caring stress index (CSI) at the county level in both 2013 and 2023, and a map of its county-level changes between these two years. Then, we zoom out and show the North-Central region, with state-level caring stress indices in 2013 and 2023, and a map showing the size of the state-level changes between these two years. The exhibits below reveal important temporal and geographic variation regarding the direction of change of the caring stress index.
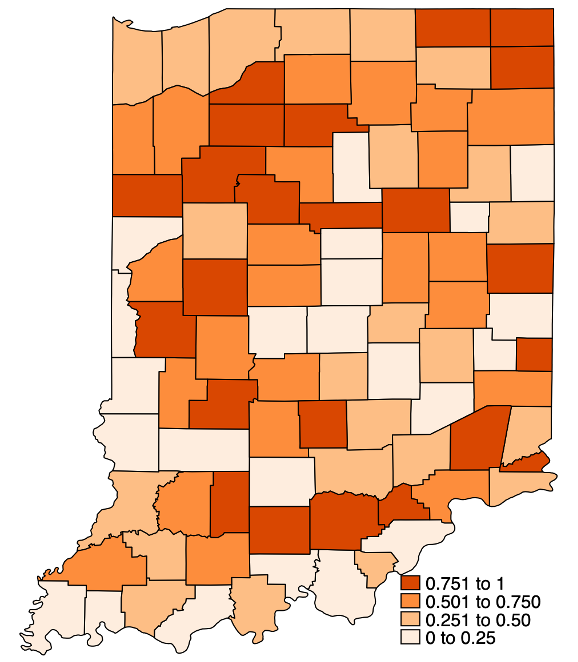
Figure 1 shows county-level maps of Indiana for 2013 and 2023. In these maps, counties are shaded according to their CSI, ranging from low stress (0–0.25) to high stress (0.751–1). The average CSI in 2013 was 0.478 in Indiana and increased to 0.525 in 2023, with 5 more counties with CSIs above 0.75 in 2023 than there were in 2013. The largest increases were in the Central region, the Northeast region, and the Southern region of Indiana. The contrast between the two maps is summarized in Figure 2, which plots the change in CSI between 2013 and 2023. Figure 2 highlights where caring stress levels have increased or decreased over the decade. The figure reveals a somewhat weak statewide trend toward rising caregiving stress, though the intensity and direction of change are not uniform nor particularly steep. This approach allows policymakers and community development organizations to identify counties that may require additional resources or targeted interventions.
Figure 1
County-Level Caring Stress Index in Indiana
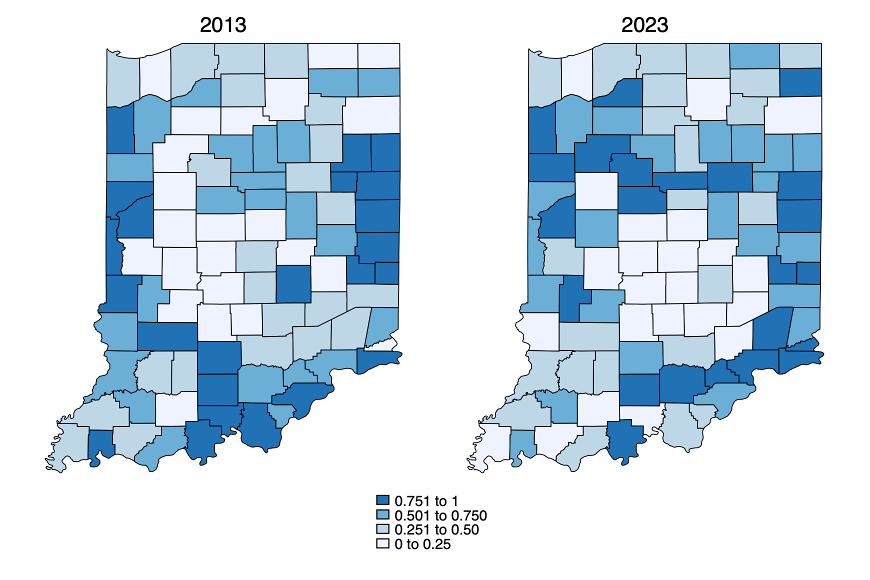
Figure 2
Changes in the Caring Stress Index between 2013 and 2023 in Indiana
The county-level changes in Indiana may reflect potential deep shifts in demographic or socioeconomic factors that affect caregiving demands. However, to better grasp the extent of these increases in CSI, we can compare shifts in CSI between a set of overall comparable states. With that goal, we use state-level data on CSI for the North-Central region of the United States, which includes Illinois, Indiana, Iowa, Kansas, Michigan, Minnesota, Missouri, Nebraska, North Dakota, Ohio, South Dakota and Wisconsin.
For this comparison, we provide a zoomed-in perspective of the North-Central region of Indiana. We use state-level CSI in 2013 and 2023 in Figure 3, and the magnitude of state-level changes between 2013 and 2023 in Figure 4. By including states such as Illinois, Ohio and Michigan in the comparison, the figure illustrates whether Indiana’s observed increase aligns with broader regional trends or stands out as an outlier. For instance, if Ohio and Michigan saw moderate increases while Indiana remained relatively stable, this may signal differences in caregiver support policies, demographic shifts, or healthcare accessibility across states.
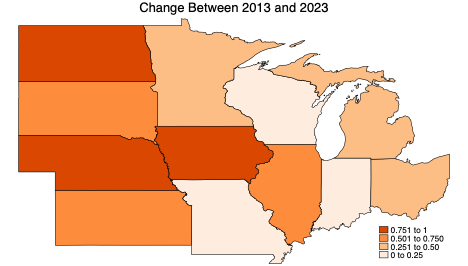
Figure 3 shows that the following North-Central states increased CSI between 2013 and 2023: North Dakota, Nebraska, Iowa and Illinois. Instead, Minnesota, Wisconsin, Indiana, Michigan and Ohio experienced a drop in CSI. Finally, Kansas and Missouri remained in the same (high) CSI interval. Within this context, Indiana did show a release in the amount of caring stress, but remains among the North-Central states with medium to high caring stress. Figure 4 clearly summarizes these changes over the decade by showing the states with the largest increases in CSI in a darker orange.
Overall, the North-Central region shows some state-level variation in terms of CSI changes and patterns, unveiling localized patterns that call for targeted interventions that account for the local context, both demographic, economic and social.
Taken together, the four figures reveal both localized caregiving pressures within Indiana and regional patterns across the North-Central states. While increases in CSI appear more common than decreases, the variation underscores that caregiving stress is not uniform. Counties and states with the largest increases may require enhanced caregiver supports, respite services, or targeted community interventions. The regional comparisons also encourage shared strategies and collaboration among neighboring states to address rising caregiving demands in areas where they are highest, especially relative to supply. A coordinated and effective response to rising caring stress, and the ability to track changes in CSI promptly and accurately, are paramount to supporting community development in Indiana, the Midwest and beyond.
Figure 3
State-Level Caring Stress Index in the North-Central Region
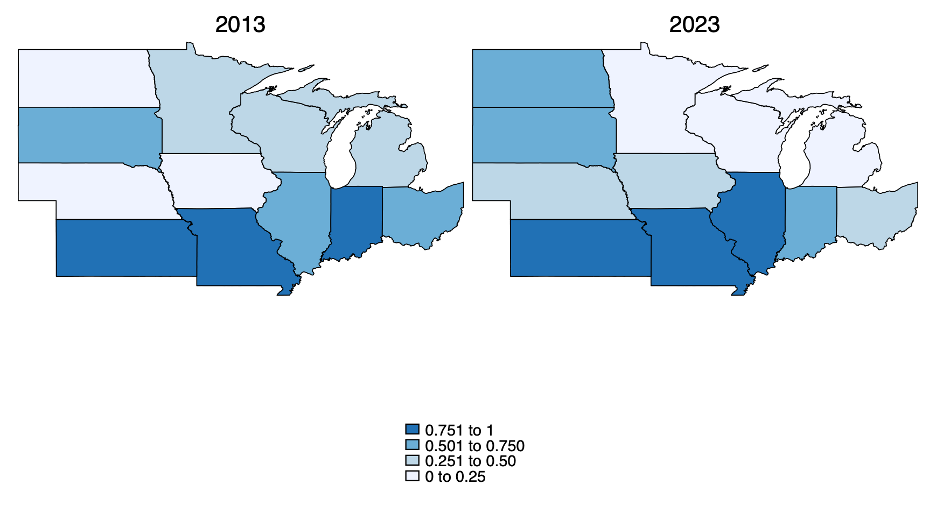
Figure 4
Changes in the Caring Stress Index between 2013 and 2023 in the North-Central Region
References
Montenovo, Laura, Roberto Gallardo, and Maria Marshall. 2025. “America’s Hidden Burden: A County-Level Analysis of Caregiving Stress.” Working Paper available upon request.
![]()
![]()
![]()
![]()
![]()
