Approaches and Data to Quantify Global Soil Organic Carbon for Land-Use Agricultural Policy
May 13, 2026
PAER-2026-20
Lauren Benavidez-Brouk, PhD Student; Farzad Taheripour, Research Professor of Agricultural Economics; Uris Baldos, Research Associate Professor of Agricultural Economics; Qianlai Zhuang, Professor of Earth, Atmospheric and Planetary Sciences and Agronomy; Shuo Chen, PhD Student
![]()
![]()
![]()
![]()
![]()
1. Motivation
Accurately measuring and mitigating land-use emissions is central to agriculture and climate change policy. According to the existing assessments (Friedlingstein et al., 2025), more than 20% of the total global net anthropogenic GHG emissions are related to land use, land-use change, and forestry (LULUCF). While these emissions are usually derived from bookkeeping models (e.g., Gasser et al., 2020; Hansis et al., 2015; Houghton & Castanho, 2023; Qin et al., 2024), they are based on historical land-use transitions, fires, and other elements. Soil organic carbon (SOC) content of land is directly affected by land-use change and agricultural conservation practices like tillage and cover crops. Therefore, it is a key component in LULUCF GHG emissions.
Usually, ecosystems models, agronomic, or land-use emission models (TEM, AEZ-EF, InVEST) can be connected with economic models (Partial Equilibrium, Computable General Equilibrium and Integrated assessment models) to estimate policy implications. Bianco et al., 2025; Frank et al., 2015; Taheripour et al., 2012; Weber et al., (2024) use available SOC data sources, embedded in models like TEM, GCAM and GLOBIOM, to estimate possible implications of changes in agricultural activities for land-use emissions and mitigation potentials. Global gridded soil products such as the harmonized world soil database (HWSD) (FAO et al., 2012), WISE (Batjes, 1997), WISE30sec (Batjes, 2016), SoilGrids (Hengl et al., 2017), and the FAO’s Global Soil Organic Carbon map (GSOCmap) (FAO & ITPS, 2018) are key data sets routinely included in these modeling practices (Dai et al., 2019).
The literature that compares these databases within soil sciences has highlighted structural differences among them, their performance versus field observations and explores methodologies in which SOC estimates are calculated (Dai et al., 2019; Hiederer & Köchy, 2011; Poeplau et al., 2017). However, the policy implications of using these alternative data sources remain a topic that has been underexplored.
Recently, Benavidez-Brouk et al., (2026) analyzed how updates in the baseline global SOC product and regional adjustments could affect the calculation of induced land-use change (ILUC) values for biofuels pathways. ILUC values, which determine contributions of expansions in biofuels pathways to their carbon intensities, are sensitive to changes in SOC estimates.
In this paper, we extend this work, developed by Benavidez-Brouk et al., (2026), to a broader agricultural policy view. We analyze the extent to which the calibration of global SOC estimates matters to policy analysis related to land-use change emissions and agricultural policies. In this paper, rather than focusing on a single model or database, we consider the spread of SOC across databases and regions. Our focus consists of exploring from a multidisciplinary lens how the existing SOC databases and their estimates distribution transfer into the estimates that policymakers ultimately evaluate. We assess metric tons of CO₂ equivalent per hectare of converted land across the world.
2. Data and methodology
The data used for this paper consists of four major databases recognized across the climate and soil sciences. First, SoilGrids (Hengl et al., 2017) uses three non-linear machine learning models to assess the soil properties. It has been used in integrated assessment models (GCAM) to evaluate SOC in land-use transitions (Bianco et al., 2025). Second, the HWSD (FAO et al., 2012) with its legacy version that has been used in CGE models (GTAP) to calculate land-use change emissions (Taheripour et al., 2024; Villoria et al., 2022). Third, the WISE30sec (Batjes, 2016) database is embedded in the newest version of the HWSD, and it has been evaluated as an alternative in some economic models to estimate land-use emissions (Benavidez-Brouk et al., 2026). Finally, the FAO’s GSOC map completes the databases evaluated.
For all the databases, we harmonized the gridded products to a common resolution and land cover to evaluate two aspects: the spatial distribution of SOC and the land-specific variation of estimates across the databases. At the same time, we evaluated different methodologies to calculate SOC that are used within the soil literature (Poeplau et al., 2017) to complete our assessment. For each harmonized grid cell, we compared the four SOC stock estimates available for that same location and computed the mean, standard deviation, and coefficient of variation (standard deviation divided by the mean). We use this coefficient of variation as an indicator of how much the databases differ for a given location; higher values indicating greater disagreement across sources.
We finally translated SOC stocks by database and its overall distribution into carbon stock changes using the existing common stock-change factors (IPCC, 2019) for key land transitions (e.g., forest to cropland, cropland to grassland) and management changes (e.g., conventional till to reduced till). This allows us to express the dispersion in SOC baselines directly in terms of carbon gains, a measure widely recognized in agricultural and land-use policy literature.
3. Results
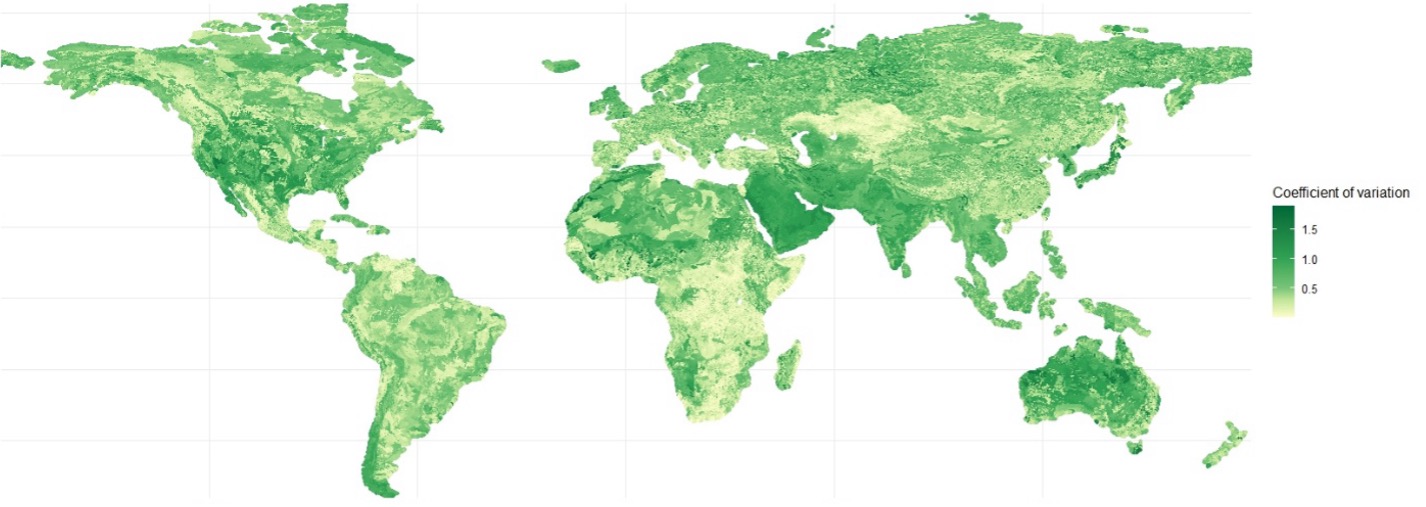
A global map of the spatial coefficient of variation across HWSD, WISE30sec, SoilGrids and GSOC, presented in Figure 1, shows low disagreement (lower coefficient of variation) in arid, low-SOC regions, but much higher variability in humid temperate and tropical agricultural zones and high-latitude forest regions like North America. This database divergence indicates that SOC product choice can materially affect estimated land-use emissions in those regions. In terms of methodologies for estimating SOC, the corrections to include coarseness into the formulation showcased differences in stocks of around 15%.
Figure 1
Coefficient of Variation of SOC stocks across four global databases.
At the aggregated level, the distribution of SOC estimates across databases is high in some regions, particularly islands, where the base land is small. Table 1 showcases the mean SOC, its range, and coefficient of variation across (1) the top five regions with the highest contribution to LULUCF in the 2000-2021 period (Friedlingstein et al., 2025), and (2) the top five regions with the highest agricultural production output in 2024 (FAO, 2026). Note that Brazil and Indonesia are relevant in both aspects, as producers and in emissions generated. However, compared to other countries, their cropland SOC estimates are not as spread. Small- and large-LULUCF emissions generators, such as Tanzania and the Democratic Republic of Congo, have the larger variation across databases.
Table 1
Distribution of SOC estimates in Cropland on selected regions
|
Highest |
Highest |
||||
|
Country |
Mean SOC [Range] T/Ha |
Coefficient of variation |
Country |
Mean SOC [Range] T/Ha |
Coefficient of variation |
|
Argentina |
25.5 ± 3.4 |
0.31 |
Brazil |
24.2 ± 4.6 |
0.45 |
|
Brazil |
24.2 ± 4.6 |
0.45 |
China |
35.7 ± 3.2 |
0.34 |
|
Indonesia |
76.5 ± 21.4 |
0.44 |
India |
48.8 ± 8.9 |
0.68 |
|
Tanzania |
15.2 ± 6.5 |
1.01 |
Indonesia |
76.5 ± 21.4 |
0.44 |
|
Republic |
26.5 ± 20.5 |
1.21 |
United States |
51.1 ± 12.4 |
0.67 |
The differences across databases can be translated into emissions due to land-use change. For example, if we analyze a particular region like the U.S. in areas with a higher proportion of agricultural land (Agroecological zones 7 through 9), the four global SOC products we analyze give mean stocks of 78.99 ± 45.37, 53.69 ± 32.76, and 73.72 ± 90.54 MT per ha for forest, cropland and pasture. When translated through IPCC Tier-1 stock change factors, this spread converts into forest-to-cropland soil emission factors of roughly 66–104 tCO₂ per ha. This paper does not intend to make a choice on which global SOC product is the optimal for model calibration, but rather to open the discussion about the sensitivity of policy-relevant estimates to this choice.
4. Conclusions and policy implications
The evidence in this paper implies that global SOC maps should be treated as a structural input for land-use emissions and mitigation analyses, not a background dataset. In practice, the SOC baseline acts like a starting point that governs how much carbon is assumed to be at risk when land is converted and how much mitigation can be credited to avoided conversion or changes in agricultural practices. When different credible SOC products assign significantly different baseline stocks to the same area, final estimates inherit that difference. The interpretation is not simply that maps disagree; it is that policy-relevant estimates become conditional on map choice, especially when dispersion can concentrate in areas where land-use decisions are critical.
For agricultural and climate policy analysis, the implication is that conclusions should be framed as robust if they hold across SOC baselines. A practical way forward is to adopt a small set of best practices, including reporting key land-use change or management metrics as ranges for various SOC products rather than single point estimates. This practice does not require choosing the best global SOC map; rather, it aims to keep possible uncertainties, sensitivities, and assumptions transparent and to improve comparability across studies.
References
Batjes, N. H. (1997). A world dataset of derived soil properties by FAO–UNESCO soil unit for global modelling. Soil Use and Management, 13(1), 9–16. https://doi.org/10.1111/j.1475-2743.1997.tb00550.x
Batjes, N. H. (2016). Harmonized soil property values for broad-scale modelling (WISE30sec) with estimates of global soil carbon stocks. Geoderma, 269, 61–68. https://doi.org/10.1016/j.geoderma.2016.01.034
Benavidez-Brouk, L., Taheripour, F., Baldos, U., Zhuang, Q., & Chen, S. (2026). Updates in assessing soil organic carbon and their implications for evaluating land use change emissions. Environmental Research Communications, 8(2), 025013. https://doi.org/10.1088/2515-7620/ae3d84
Bianco, C. H., Narayan, K. B., Snyder, A., Weber, M., & Morris, K. A. (2025). A framework for testing soil carbon dynamics post land-use transition in a multisector dynamics model. Environmental Research Communications, 7(12), 121014. https://doi.org/10.1088/2515-7620/ae2a95
Dai, Y., Shangguan, W., Wei, N., Xin, Q., Yuan, H., Zhang, S., Liu, S., Lu, X., Wang, D., & Yan, F. (2019). A review of the global soil property maps for Earth system models. SOIL, 5(2), 137–158. https://doi.org/10.5194/soil-5-137-2019
FAO, IIASA, ISRIC, ISS-CAS, & JRC. (2012). Harmonized World Soil Database version 1.2 [Dataset]. FAO.
FAO & ITPS. (2018). Global Soil Organic Carbon Map (GSOCmap) [Technical Report].
Frank, S., Schmid, E., Havlík, P., Schneider, U. A., Böttcher, H., Balkovič, J., & Obersteiner, M. (2015). The dynamic soil organic carbon mitigation potential of European cropland. Global Environmental Change, 35, 269–278. https://doi.org/10.1016/j.gloenvcha.2015.08.004
Friedlingstein, P., O’Sullivan, M., Jones, M. W., Andrew, R. M., Bakker, D. C. E., Hauck, J., Landschützer, P., Le Quéré, C., Li, H., Luijkx, I. T., Peters, G. P., Peters, W., Pongratz, J., Schwingshackl, C., Sitch, S., Canadell, J. G., Ciais, P., Aas, K., Alin, S. R., … Zeng, J. (2025). Global Carbon Budget 2025. ESSD – Anthroposphere/Energy and anthropogenic emissions. https://doi.org/10.5194/essd-2025-659
Gasser, T., Crepin, L., Quilcaille, Y., Houghton, R. A., Ciais, P., & Obersteiner, M. (2020). Historical CO2 emissions from land use and land cover change and their uncertainty. Biogeosciences, 17(15), 4075–4101. https://doi.org/10.5194/bg-17-4075-2020
Hansis, E., Davis, S. J., & Pongratz, J. (2015). Relevance of methodological choices for accounting of land use change carbon fluxes. Global Biogeochemical Cycles, 29(8), 1230–1246. https://doi.org/10.1002/2014GB004997
Hengl, T., Mendes De Jesus, J., Heuvelink, G. B. M., Ruiperez Gonzalez, M., Kilibarda, M., Blagotić, A., Shangguan, W., Wright, M. N., Geng, X., Bauer-Marschallinger, B., Guevara, M. A., Vargas, R., MacMillan, R. A., Batjes, N. H., Leenaars, J. G. B., Ribeiro, E., Wheeler, I., Mantel, S., & Kempen, B. (2017). SoilGrids250m: Global gridded soil information based on machine learning. PLOS ONE, 12(2), e0169748. https://doi.org/10.1371/journal.pone.0169748
Hiederer, R., & Köchy, M. (2011). Global soil organic carbon estimates and the harmonized world soil database. Publications Office. https://data.europa.eu/doi/10.2788/13267
Houghton, R. A., & Castanho, A. (2023). Annual emissions of carbon from land use, land-use change, and forestry from 1850 to 2020. Earth System Science Data, 15(5), 2025–2054. https://doi.org/10.5194/essd-15-2025-2023
IPCC. (2019). 2019 Refinement to the 2006 IPCC Guidelines for National Greenhouse Gas Inventories. Intergovernmental Panel on Climate Change (IPCC).
Poeplau, C., Vos, C., & Don, A. (2017). Soil organic carbon stocks are systematically overestimated by misuse of the parameters bulk density and rock fragment content. SOIL, 3(1), 61–66. https://doi.org/10.5194/soil-3-61-2017
Qin, Z., Zhu, Y., Canadell, J. G., Chen, M., Li, T., Mishra, U., & Yuan, W. (2024). Global spatially explicit carbon emissions from land-use change over the past six decades (1961–2020). One Earth, 7(5), 835–847. https://doi.org/10.1016/j.oneear.2024.04.002
Taheripour, F., Mueller, S., Emery, I., Karami, O., Sajedinia, E., Zhuang, Q., & Wang, M. (2024). Biofuels Induced Land Use Change Emissions: The Role of Implemented Land Use Emission Factors. Sustainability, 16(7), Article 7. https://doi.org/10.3390/su16072729
Taheripour, F., Zhuang, Q., Tyner, W. E., & Lu, X. (2012). Biofuels, cropland expansion, and the extensive margin. Energy, Sustainability and Society, 2(1), 25. https://doi.org/10.1186/2192-0567-2-25
Villoria, N., Garrett, R., Gollnow, F., & Carlson, K. (2022). Leakage does not fully offset soy supply-chain efforts to reduce deforestation in Brazil. Nature Communications, 13(1), 5476. https://doi.org/10.1038/s41467-022-33213-z
Weber, M., Wise, M., Lamers, P., Wang, Y., Avery, G., Morris, K. A., & Edmonds, J. (2024). Potential long-term, global effects of enhancing the domestic terrestrial carbon sink in the United States through no-till and cover cropping. Carbon Balance and Management, 19(1), 18. https://doi.org/10.1186/s13021-024-00256-2
![]()
![]()
![]()
![]()
![]()
